November 2016
Thoughts from NIC’s Chief Economist
Election Results

Beth Mace
November’s presidential election results have altered the outlook for the U.S. economy. While specifics are not yet known, comments to date and those from the campaign trail, as well as President-elect Trump’s 100-day plan released in October, provide clues to the policies likely to be implemented. The new administration is expected to follow a fiscally expansive policy of higher spending on infrastructure and defense, while cutting taxes. Immigration reform, a renegotiation of trade agreements, a loosening of restrictions on fossil fuel production, and an overhaul of the Affordable Care Act (ACA) are also likely priority policy changes.
Economic Outlook Improving? In a survey conducted by the Wall Street Journal in the two days following the election results, 57 academic, business, and financial economists raised their forecasts for economic growth, inflation, and interest rates for both 2017 and 2018. GDP growth has been revised higher to 2.2% in 2017 and 2.3% in 2018, up from 1.5% over the past 12 months. Inflation is now projected to be 2.2% next year and 2.4% in 2018.
The stock market generally responded favorably in the immediate aftermath of President-elect Trump’s win; there was no rout as some pundits had prognosticated, although not all stocks enjoyed gains. Interest rates moved higher due to predictions of higher inflation, as well as the expectation that the government will be required to issue more bonds to finance greater amounts of spending.
Cost of Capital Rising. For seniors housing operators and providers of capital, the change in political order has several potential ramifications. First, financing costs are rising, although they still remain low by historical standards. The 10-year Treasury bond fell to a record low of 1.3% in the immediate aftermath of Brexit last June, and as of November 28, it stood at 2.3%.
On the shorter end of the yield curve, the benchmark federal funds rate is also likely to move higher once the Federal Open Market Committee (FOMC) meets on December 13 and 14. In December 2015, the Fed raised its benchmark interest rate 25 basis points for the first time since the financial crisis. Since that time, there has been much discussion of further increases, but there has not yet been one because of mixed signals on the strength of the economy and the inflation outlook.
Now, however, with 5.5 million unfilled job openings, an average of 190,000 jobs being created every month, and an unemployment rate of 5.0%, the labor market is close to full employment—one of the two primary policy goals of the Federal Reserve. (Since 2010, nearly 15 million jobs have been created; President-elect Trump’s plan calls for the creation of 25 million jobs). Inflation is the Federal Reserve’s second primary goal. Upward pressure on wage rates associated with tight labor markets, the impact of new fiscal policies, and the threat of rising tariffs on imported goods into the U.S. could very likely push inflation past the Fed’s targeted 2% goal.
Together, the threat of rising inflation with full employment conditions will support the conviction of many within the FOMC that they should increase interest rates at the December meeting. Beyond December, many pundits expect the Fed to push interest rates even higher and at a faster pace than would have been otherwise in 2017. For businesses, this suggests that the days of record low debt are over. Therefore, debt positions should be examined, projects with the most sensitive leverage positions should be assessed, and re-financings potentially should be accelerated. Rising interest rates will also put upward pressure on the U.S. dollar, making U.S. goods and services more expensive abroad as well.
Valuations and Cap Rates. In addition to the cost of capital, higher interest rates have the potential to push cap rates up and valuations down. The relatively large risk premium associated with seniors housing (the difference between its cap rate and the risk-free 10-year Treasury rate, estimated to be roughly 500 basis points) may help buffer the effects of higher interest rates on seniors housing cap rates, since the risk premium has room to potentially shrink toward the premium afforded to other commercial real estate asset types. Additionally, a stronger economy could also act as an offset to falling valuations if a stronger economy results in stronger NOI growth. Importantly, higher interest rates indicate that the Federal Reserve believes the economy has enough heft, strength, and stamina to absorb the effects of a higher cost of capital. A stronger economy, in turn, likely will sustain the demand side of the seniors housing equation and help with lead generation, conversion rates, and, ultimately, move-in rates, absorption levels, and rent growth. Higher interest rates would also support interest earnings from savings for seniors themselves.
Higher Inflation. Investing in commercial real estate in general and seniors housing in particular has the potential to act as a natural hedge against inflation, because property owners can potentially benefit from increasing rents and property values. By periodically raising rents, real estate owners can keep pace with inflation and preserve the value of their investments. For investors and operators of seniors housing, lease structures are typically less than one year, allowing frequent opportunities to adjust rents to accommodate rising price pressures. Many long-term leases contain built-in rent increases over time, while shorter-term leases roll over at the current market rate.
Falling Taxes. The tax environment is likely to change under a Trump regime for both businesses and individuals, although the details have yet to be defined. It is expected that tax rates for individuals will go down, and that the number of tax brackets will be reduced for individuals. The business tax rate may fall to 15% from the current 35%, and tax deductions for firms will become more limited.
Immigration Reform. Immigration reform has been a key tenet of President-elect Trump’s campaign rhetoric, indicating that restricting immigration could lead to more jobs for low-skilled American workers. However, the rhetoric assumes that American workers will want to fill these jobs. What is certain is that cutting back on immigration will make it harder for some businesses to find qualified workers. This is particularly the case for seniors housing care givers.
Health Care Reform. Health care reform, or the rolling back of all or some of President Obama’s signature ACA, was mentioned frequently on the campaign trail. Until the details are more fully revealed, it is difficult to determine the impact on the seniors housing and care industry, although the private-pay sector is not likely to be greatly affected. The broader impact may be Medicare reform or changes in payment structures, much of which will occur outside the scope of the ACA.
Risks. In terms of risks to this outlook, there are many. Foremost is the potential for a trade war with our largest trading partners. Of those surveyed by the Wall Street Journal’s survey of economists, 43% cited this possible trade war as the biggest risk to the economy. At its worst, the imposition of tariffs on U.S. imports could lead to tariffs on U.S. exports, higher import prices, and greater pressure on inflation as well as smaller markets for U.S. exporters.
When all is said and done, President-elect Trump’s policies are just unfolding. Their economic impact will be repeatedly digested, studied, and assessed by the NIC in the months and years ahead. Certainly, a critical question that remains on the table is how the government will pay for increased spending on infrastructure and defense, while reducing tax rates, without significantly raising the U.S. budget deficit (a key Republican stance). Independent analyses suggest that the President-elect’s tax plan alone would add more than $7 trillion to the debt over the next 10 years. Budget pressures will make it all the more challenging for the government to maintain entitlement programs such as Social Security and Medicare. Stay tuned!
Investment Return Results
Seniors Housing Investment Returns Remain Strong. On another note, and unrelated to Washington politics, third-quarter investment return data for NCREIF-reported seniors housing properties equaled 2.22%, composed of a 0.80% capital return and a 1.41% income return. The annual total return through the third quarter of 2016 was 13.11%, overshadowing the NCREIF’s main property index (the NPI) result of 9.22% and the apartment property result of 8.46%. However, industrial property total returns at 12.47% nearly matched that of seniors housing.
Despite the relatively strong showing, the total annual return for seniors housing has been slowly trending down since mid-2014, when it peaked at 20.37%. The annual appreciation return has also been slowing and, at 7.16%, was the lowest for any trailing four-quarter period since early 2013. The income return remained near historic lows of 5.66% in the third quarter. The slowdown in annual income and capital returns also has been occurring for the broader NPI.
On a 10-year basis, total returns for seniors housing exceeded both the NPI and apartments by more than 400 basis points. These performance measurements reflect the returns of 78 seniors housing stabilized properties within the NCREIF database and valued at $3.5 billion in the third quarter 2016.
NCREIF Annualized Total Investment Returns (1, 3, 5, 10-Year Periods, as of Q3 2016)
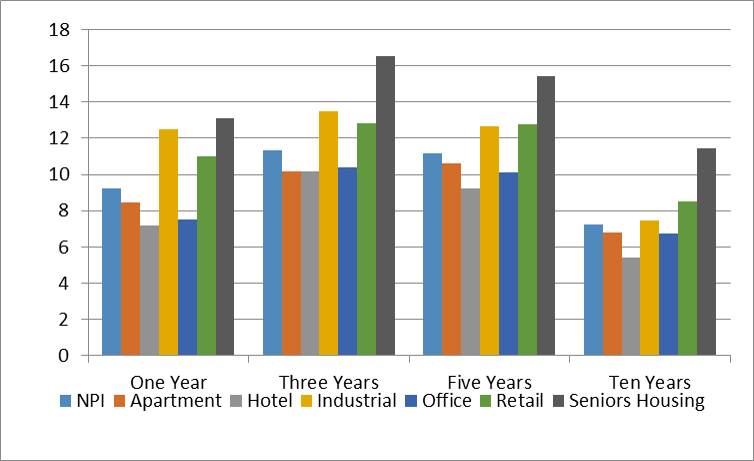
Source: NCREIF, NIC MAP® Data Service
As always, I welcome your feedback, thoughts, and comments.
Beth
By the Numbers: California’s Seniors Housing Market
Of the 99 largest metropolitan markets that the NIC MAP® Data Service (NIC MAP) tracks across the nation, 11 are located in California. Within these metropolitan markets, NIC tracks 870 seniors housing properties with 101,000 units, or nearly 12% of the seniors housing units regularly followed within the 99 markets by NIC. By coincidence, this share is comparable to California’s 12% share of the total U.S. population (38.8 million people live in California versus 320 million in the U.S. as of 2015). Within the state, performance measurements vary considerably.
In short, California is a state to watch when it comes to tracking the seniors housing market.
Strong Occupancy, Variations in Penetration
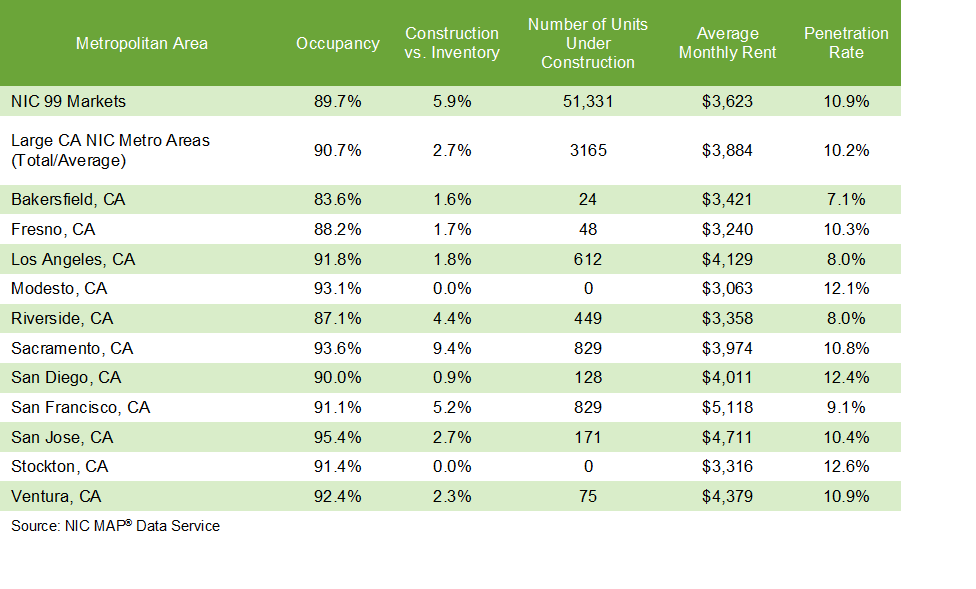
Three of the five best performing markets in the nation for occupancy as of the third quarter of 2016 are in California: San Jose, with an occupancy rate of 95.4%, Sacramento, at 93.6%, and Modesto, at 93.1%. Ventura, Los Angeles, Stockton, San Francisco, and San Diego all had occupancy rates that exceeded the national average of 89.7%. Fresno, Riverside, and Bakersfield lagged behind the national occupancy rate.
With penetration rates, there’s variation among California’s largest metropolitan markets. NIC defines the penetration rate as inventory divided by the number of households older than 75 years of age. On average, the penetration rate among California’s metropolitan areas is not very different than the nation’s: 10.2% versus 10.9%, respectively. Within the 11 metropolitan markets, Bakersfield and Los Angeles had penetration rates below 8% in the third quarter of 2016, while Stockton and San Diego exceeded 12%.
High or low penetration rates can be viewed as either positive or negative, depending on perspective. In markets with high penetration rates, seniors housing tends to be a popular and well-understood living option for seniors. This often means that less marketing is needed to inform the public about the benefits of seniors housing, such as its care, hospitality and socialization offerings. A high penetration rate may also mean that the market has a relatively more intensive competitive landscape due to the sheer number of units in the marketplace, making increases in occupancy more difficult to achieve.
On the other hand, a low penetration rate could mean that the market has less competition, resulting in easier increases in occupancy. However, if seniors housing is less familiar to the pool of potential residents, more marketing may be needed to educate consumers.
Considerations in California
When examining occupancy and penetration rates for California, it’s important to keep a few things in mind.
First, board and care properties, which are not tracked by NIC MAP and are not included in this analysis, may directly compete with many of the properties tracked by NIC MAP. Also, note that these properties are not included in the penetration rate analysis cited earlier. According to the California Registry, there are more than 8,100 of these facilities for the elderly in the state. More than 90% of these properties provide non-medical custodial care within a single-family private residential home setting, licensed for six or fewer residents.
In addition, penetration rates do not necessarily correlate with occupancy rates. For example, Los Angeles has a relatively low penetration rate of 8%, yet a relatively high occupancy rate of 91.8%, while Bakersfield’s low penetration rate was associated with a relatively low occupancy rate of 83.6%. Meanwhile, at 12.6%, Stockton had the highest penetration rate of any large California market and also had a high occupancy rate of 91.4%. Reputation of the incumbent operators in a market and the length of time seniors housing has existed in a market are among the factors that can influence penetration rates.
Penetration rates also change over time depending on the dynamics between construction activity, inventory growth, and household growth of seniors. For example, the 11 California metropolitan areas being discussed here currently have a smaller share of construction activity occurring than their share of inventory would suggest. As of the third quarter of 2016, there were 3,165 units under construction. That is 6% of NIC’s 99 market total and less than the 12% share of inventory these same 11 metropolitan areas make up. In part, this can be explained by the near absence of construction in the Central Valley (Bakersfield, Fresno, Modesto, and Stockton) and only moderate growth in many of the larger Southern California coastal markets (Los Angeles and San Diego). The greatest construction activity is occurring in Sacramento, Riverside, and San Francisco. But even in these markets, it is only Sacramento that has a higher share of construction activity relative to its inventory base compared with the average of the 99 largest markets NIC MAP tracks.
Difficult zoning regulations and entitlement rules, and the subsequent barriers to entry imposed on new development, mean that California’s construction activity remains relatively low for many of its metropolitan markets. While this is bad news for those trying to get into the market, it is decidedly good news for incumbents in those markets as well as those developers and operators that currently have projects underway.
Finally, coastal California’s higher cost of living and doing business, as well as higher home prices, means asking rents for seniors housing in these markets (Los Angeles, San Diego, San Francisco, San Jose, and Ventura) were 23% higher, on average, than the national average. However, with the exception of Sacramento, the more centrally located metropolitan markets in California (Bakersfield, Fresno, Modesto, Riverside and Stockton) had asking rents that were 10% less than the national average.
Looking ahead, it is likely that most of California’s largest metropolitan areas will hold onto their relatively high seniors housing occupancy rankings. The exception may be Riverside, whose already relatively low occupancy rate may be pressured further down due to new supply entering that market. San Francisco and Sacramento may also feel a bit of a squeeze on occupancy due to having more than 5% of its inventory under construction in the case of San Francisco and 9% in the case of Sacramento.
Are More Skilled Nursing Consolidations in Our Future?
 Skilled nursing operators—and those who invest in the sector—are no strangers to challenges. Over the past few years, government, payor, and operator initiatives across the country have been working to create a new health care delivery and payment system, and these initiatives are expected to continue for the foreseeable future. In fact, some industry leaders suggest that it could be two years until we see a narrowing of networks and partner alignment that will expose the winners and potential losers in the emerging system.
So what will happen in the meantime? One possibility is that we’ll see more consolidation within the sector over the next few years.
Market Value & Fragmentation
From an investor’s perspective, the estimated market value of skilled nursing properties in the U.S. is sizable. At the beginning of 2016, the estimated market value was $120.5 billion, based on an estimated 1.46 million beds in investment-grade properties (i.e., properties of 25 or more beds) and at a value of $82,500 per bed.
The following pie chart shows how this market value is divided among different owner types. As you can see, the publicly traded REITs represent $13 billion as of December 31, 2015, which is only 11% of the total market value. The publicly traded operating companies own $2.5 billion, or about 2% of the market value. Non-profit entities own 25%, or $29.7 billion. The biggest piece of the market value pie is held by for-profit entities, including private REITs and owners, who own $75.3 billion, or 62% of the market value.
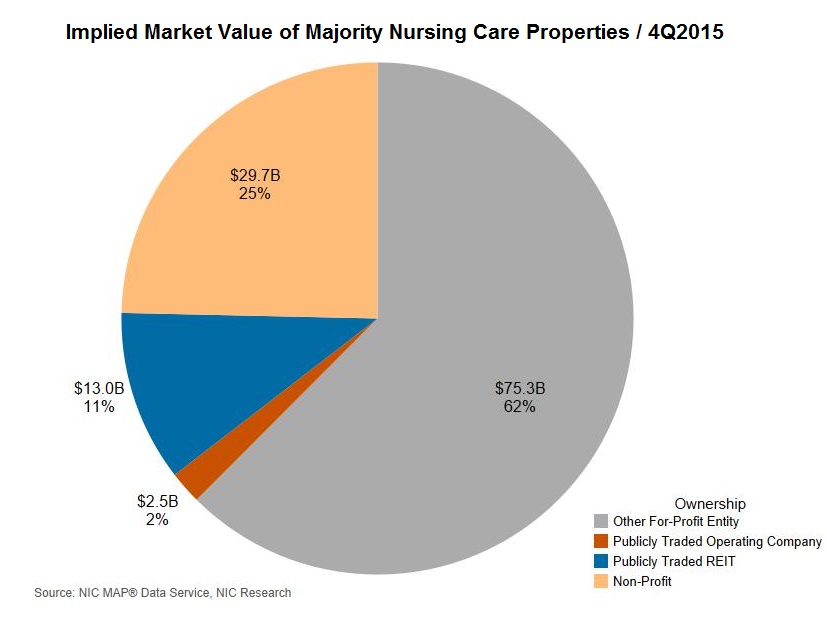
What this chart could indicate is that there is potential for consolidation within the sector. A few publicly traded REITs in the sector, for example, already have sizeable investments in the sector and have the ability to explore deal opportunities in the $75.3 billion slice owned by other for-profit buyers. In addition, many for-profit buyers might start looking for new opportunities as well, such as potentially buying out other private buyers.
As the next chart shows, there is fragmentation among skilled nursing operators, as well, which could lead to operator consolidation. The chart shows, within the top 99 metropolitan markets, the percent of properties by size of operator based on the respective operator’s number of properties. Approximately 33% of skilled nursing properties are operated by an operator with 10 or more properties, and only 26% of properties are operated by an operator with 2–9 properties. That leaves 41% of all properties being operated by an individual operating company.
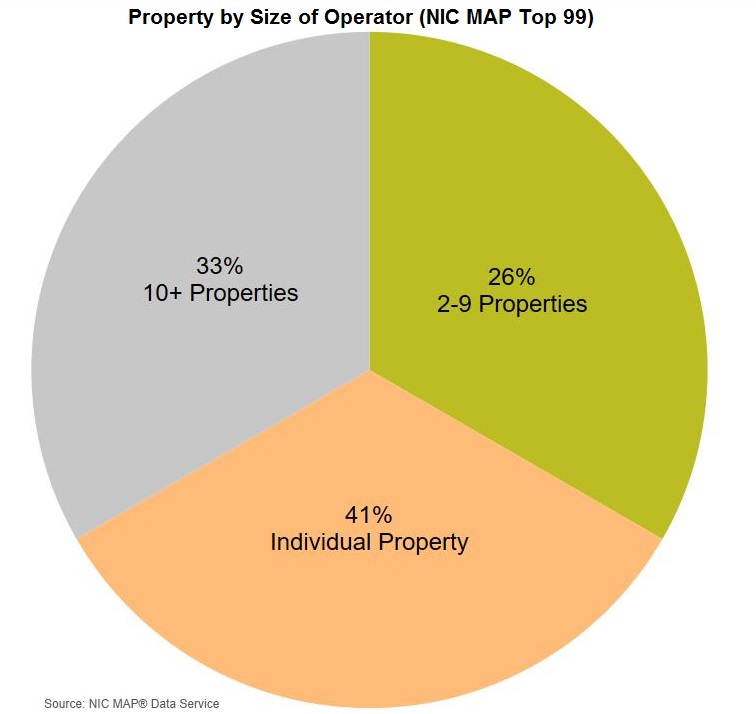
Looking at the pie chart, it would not be surprising to see a larger operator of 10-plus properties look to take over a smaller operator in order to gain market share and increase efficiencies at the corporate and property levels. At the same time, there is plenty of opportunity for one-off acquisitions of individual-property operators. We have already heard of some regional operators starting to pursue this approach as a strategy to grow and take advantage of the current environment.
Increased consolidation is not a given, but as the acuity and complexity of the patients increase, especially over the next decade, and operators are asked to take risk, there will be additional incentives for operator and/or owner consolidation. In other words, the demands on some operators may be so overwhelming that they will either be acquired or simply go out of business.
Delivering on Quality & Creating Value Will Define the Good Operators
As stated earlier, there are a number of care delivery and reimbursement initiatives throughout the country, and these are likely to continue, even with a new presidential administration. For example, acute care providers, managed care payors, and conveners have initiatives in place to divert skilled nursing referrals to home health and other community based care settings. In addition, patients who are referred to skilled nursing are managed by payors looking to reduce length of stay, which creates a reduction in Medicare and managed care days.
These challenges make being a good operator all the more important in order to succeed—and, chances are, those who do not adapt will lose out over the next few years. As the new delivery and payment system takes shape, investors and partners will value operators who are nimble, have a resident-focused culture, deliver quality outcomes, and are able to document and report their outcomes for partners and payors. In addition, the operators who demonstrate the ability to create value for their managed care payors and have a strategy in place, such as growing market share or developing a specialization, will position themselves for potential success in the future.
Many post-acute care experts think there is tremendous opportunity within the skilled nursing sector to accommodate the increase in the number of seniors needing both short-term transitional care and long-term care, as this growth in demand will increase significantly in the 2020s. To capitalize on the opportunity, operators will have to invest in the people, technologies, and service capabilities required for short-stay and long-term care models of the future.
Some experts have observed that operators need to pursue two strategies simultaneously: for short-term survival and for long-term positioning. Both strategies will require investment in operations. For example, in the future, the sector most likely will serve higher-acuity residents who need far more skilled care for short stays and longer-term stays alike. Many of these admissions previously would have been in acute care settings. This is a long-term change that requires a long-term strategy that involves investment in expanding service capabilities and, in
many instances, developing areas of specialization.
Whichever approach investors and operators take—to proactively pursue strategies or to sit back and wait—there will be continuing disruption in the skilled nursing market over the next several years with significant changes in ownership.
Collaborating Outside Traditional Care Silos

Partnerships, Technology, & Care Delivery Added to Spring Forum Program
At the 2017 NIC Spring Investment Forum March 22–24, as leaders from seniors housing and skilled nursing meet in San Diego to discuss funding options with capital providers, some conversations may extend beyond traditional brick and mortar property transactions.
“Operators are being challenged to care for an increasing number of frail seniors within an evolving health care delivery and payment system,” said Doug Korey, senior vice president of Business Development for LTC Properties, Inc., who co-chairs the Forum’s planning committee. “Along with those challenges are new opportunities to collaborate not just on real estate projects, but with providers of products and services outside the care silos.”
From Volume to Value
The seniors housing and care industry has been paying close attention as the nearly $600 billion-per-year Medicare program transitions rapidly from fee-for-service payment to a value-based care model. As the government aims to reduce the high cost of caring for frail seniors, hospitals and physicians are seeing their payments tied to efficiency and quality.
At the same time, seniors are looking for relief from high out-of-pocket health care costs, leading to significant growth in managed care organizations (MCOs), which often cover benefits not available under traditional Medicare and reduce overall out-of-pocket costs for enrollees. Insurers are also under pressure from Medicare to deliver higher value care.
The good news is that seniors housing and skilled nursing properties already deliver value. According to research funded by The SCAN Foundation, per-capita Medicare costs for frail seniors in need of assistance with daily activities is lower for those in nursing homes and seniors housing than for those living at home.
In short, said Kenneth Segarnick, chief corporate officer for Brandywine Living and co-chair of the Forum’s planning committee, “seniors housing and skilled nursing are already demonstrating value for health systems and other risk-bearing entities. It’s an important differentiator that the industry needs to leverage through new relationships that enable them to enhance the continuum of care for seniors and help ensure quality outcomes and improved transitions from hospital to home.”
Breaking Down the Silos
While the flow of capital into the seniors housing and care real estate market remains strong, many believe operators should begin looking for opportunities beyond purchasing a new property. Successful innovation allows operators to expand their reach and develop solutions for organizations taking health care risk.
Funding is also strong from venture capitalists and private equity into products and services that improve care delivery for the growing senior population, including care management companies, technology-enabled home care, data analytics, and enhanced primary care. These new models promise to enable better management of the health care risk for high-cost frail seniors, but they often lack distribution channels that support scale. They look to seniors housing and skilled nursing properties as a channel to consumers and to the risk-bearing organizations that need care management solutions for their elderly patients.
“Through collaboration, operators have the opportunity to bring in new capabilities they need to better care for frail seniors, and their partners will have a platform for developing and marketing better solutions,” said Tom Stanley, founder and principal of Cascade Living Group and vice chair of the Forum’s planning committee. “This alignment can unlock new value for both groups.”
Programming with a Critical Twist
These broader conversations about collaborating with partners that deliver solutions outside the care silos will begin in sessions at the Forum in March.
“Many of the sessions will cover the capital topics attendees look forward to each year, including valuations and supply and demand trends,” said Jim Thompson, senior director of Synovus Bank, who serves as vice chair of the Forum’s planning committee. “But we’re expanding the programming to include sessions with examples and case studies of how operators are creating value through non-traditional partnerships with care delivery/coordination organizations and are preparing to prosper under value-based care.”
The program for the Forum will include sessions on:
- The new president’s and new Congress’ impact on health care policy, entitlement programs, and tax policy in a point/counterpoint discussion with former Senators Tom Daschle and Bill Frist
- Capital opportunities in new business models
- Quality metrics and their influence on providers and investors
- Economic trends and overviews on the seniors housing and skilled nursing markets
- Seniors housing and care’s potential role in home care
- Successful clinical and financial partnerships
- Technology innovation
Registration for the 2017 NIC Spring Investment Forum opens in December. Sign up at the NIC website to receive notification once registration opens.
Seniors Housing & Care Industry Calendar
January/February 2017:
30-1 AHSA 2017 Annual Meeting, Palm Springs, CA
March 2017:
22-24 2017 NIC Spring Investment Forum, San Diego, CA

Be sure to save the dates for both 2017 NIC conferences!
Also note the change in days for the NIC Fall Conference, which will begin on Tuesday rather than Wednesday, and will end on Thursday.
NIC Partners
We gratefully acknowledge our following partners: