Leadership Counts in Times of Crisis: A Conversation with Brookdale’s Cindy R. Kent
 If there was ever an opportune time to bring on a well-regarded healthcare executive with decades of experience, it was in January of 2020 just as the pandemic was emerging. Luckily for Brookdale Senior Living, that’s when Cindy R. Kent joined as Executive Vice President and President of Senior Living. Her extensive background in the management of large organizations dealing with infection prevention and drug delivery have been invaluable during the crisis.
NIC Chief Economist Beth Mace recently talked with Kent about her role at Brookdale, the company’s response to COVID-19, and her appointment to NIC’s Board of Directors. Here is a recap of their conversation.
Mace: You recently joined NIC’s Board of Directors. With your vast array of experiences and leadership roles, we are very excited to have you on our Board. Thank you for your time, commitment, enthusiasm, and ideas.
Kent: I am grateful for the opportunity to serve on the NIC Board at such a pivotal time in NIC’s history. I’m also humbled to represent operators in general, and Brookdale Senior Living in particular and following our President and CEO, Cindy Baier, who had served on the NIC Board for the past two-and-a-half years—who is a passionate advocate for the vital role NIC plays in this sector.
Mace: You also joined the executive team at Brookdale fairly recently in January 2020, just as the pandemic was beginning to take root. Can you tell us about this past year and your role at Brookdale?
Kent: I think, like everyone, 2020 by all accounts has been a ‘once in a lifetime’ set of circumstances and has had a devastating global effect, one that will change the course of society, healthcare systems, as well as the senior living industry. And that’s the impact of COVID-19! We must also layer on top of that the hurricanes, wildfires, and other natural disasters that compounded the challenges of learning a new company, as well as a new industry.
That said, there were also countless ‘silver linings’ to the experience, as well. For example, Brookdale has tremendously talented operators and clinical operations teams that really helped us navigate through the pandemic. A company-wide initiative, established under our CEO Cindy Baier’s leadership and run by several senior leaders, involved setting up a cross-functional central Emergency Command Center to regularly communicate and partner with the Centers for Disease Control and Prevention (CDC) as well as state and local health officials. The Command Center updated our internal protocols and policies and supported our communities and field teams to ensure they had the PPE and information needed to help keep residents and associates safe.
Our first priority was to keep the virus out of communities, if possible. If a community did have positive cases, then the focus was on containing the virus and preventing the spread.
I have watched Brookdale’s ‘everyday heroes’ go above and beyond the call of duty, working tirelessly throughout the pandemic and other disasters. No one overcomes challenges like Brookdale does. It is humbling and wonderful to be a part of such a deeply committed and passionate team.
Mace: You bring a unique set of experiences and perspectives to seniors housing and care. Can you tell us a bit about your career path?
Kent: I’m an engineer by training with an MBA in Marketing as well as a Master of Divinity degree. I’ve spent my entire career in healthcare—in products-based companies. I started my career with Eli Lilly in pharmaceuticals—in a variety of functions, starting off designing research laboratories, followed by stints in sales, human resources, and marketing. I then switched to medical technology and implantable devices with Medtronic, and then was President of 3M’s Infection Prevention business before coming to Brookdale.
Mace: How has your healthcare background helped you in your role at Brookdale and specifically in leading Brookdale’s response to the COVID-19 pandemic?
Kent: Brookdale has incredibly strong healthcare capabilities, from our communities to the Board of Directors. At the Board level, we benefitted from having a physician who is the Chief Medical Officer for a large health system, the Chief Operating Officer of a health system, and a CEO who is on the Executive Committee of the Nashville Healthcare Council.
In the early stages of the pandemic, our CEO established a cross-functional emergency command center to lead our response. As you would expect, this heavily leveraged the experience of our strong clinical team, very seasoned operators, human resources experts, and others within our organization. While I did not lead the pandemic response, I’m pleased that I could help connect Brookdale with people and companies from my background that were able to enhance our response.
Mace: The pandemic has been incredibly challenging. What were some of the most difficult challenges Brookdale faced?
Kent: One of the greatest challenges I think Brookdale, and the senior living industry as a whole, faced was the lack of understanding by some key stakeholders, such as government officials, of the vital role senior living plays in the healthcare continuum. While the impact of COVID-19 in skilled nursing communities, in particular, cast a negative shadow on congregate living, Brookdale has worked hard to change that perception. Our work in this area will continue for the foreseeable future.
Brookdale, other companies in the senior living industry, and our trade associations have spent considerable time educating the U.S. Department of Health and Human Services and policymakers over the past year about our industry. We have seen positive results from these efforts, but there is still much work to do. As the largest operator in the senior living industry, Brookdale has and will continue to be proactive in helping public officials understand our industry, the extensive oversight it has, and the benefits that it provides.
Mace: What lessons have been learned? What changes will remain in place post-pandemic?
Kent: Brookdale successfully navigated its way through the pandemic because we were able to fully leverage the size and scale of our entire company; we are an effective learning organization with a passion for serving seniors; and we partnered really well with health authorities and regulators.
We innovated and found new ways to try to best protect the nation’s seniors. In our communities, we’ve seen the introduction of telehealth services and an increased partnership with other health organizations. We also partnered with CVS through the federal partnership program to provide over 100,000 vaccine doses in the first three-and-a-half months of the vaccines being available.
A critical component of our success was incorporating different perspectives and expertise into our planning—focused not just on the physical health and safety of residents; but balancing that with emotional well-being and engagement. We prioritized balancing clinical needs such as physical safety with the effect of loneliness and loss of family connections.
Many changes we made will last beyond the acute phase of the pandemic. The silver lining is that we were able to pivot and innovate very quickly.
Mace: Has the vaccination rollout improved leads, move-ins, and occupancy? When do you anticipate that you will be back at pre-pandemic occupancy levels?
Kent: While I don’t want to get into any disclosures or predictions right now, I can tell you that the federal partnership program with CVS has run extremely efficiently with our first vaccination clinic on December 18. Brookdale has facilitated more than 100,000 COVID vaccination doses to date at communities across 43 states. There is definitely a strong correlation between the vaccination clinics and the current declining number of new positive cases in the community. Our resident vaccination acceptance rate is over 90%.
Mace: Brookdale is the largest publicly traded seniors housing company in the nation. With that comes complexity but also economies of scale. How does size help or hinder your organization?
Kent: Here are just a couple of examples. We were able to leverage our size and scale effectively by, among other things, providing 24-hour-a-day support to our communities from our Emergency Command Center. Because of our size, we were able to screen hundreds of vendors, so our communities had the personal protective equipment they needed to keep our residents and associates as safe as possible, even though there was a shortage and prices were at a premium. No one person could do that alone. Brookdale kept decisions like that centralized, but, at the same time, it was able to localize some decisions. For example, executive directors knew the risk profiles in their local markets, so they worked with their own local departments of health and, in turn, could make decisions in the best interests of their residents.
It’s worth remembering that not only is our portfolio large, but our communities are also quite diverse, so a one-size-fits-all approach would not work. Our size also requires lots of communication to ensure that we have consistency where it matters most—in the care and service to our residents.
Mace: Now, let’s shift a bit away from Brookdale and back to you. You have been broadly recognized for your commitment to excellence in the workplace and community. In its Spring 2020 edition, Savoy Magazine named you one of the “Most Influential Black Executives in Corporate America.” In 2018, you were named Lead360’s “Executive of the Year.” In 2017, Black Enterprise Magazine named you one of the “Top 100 Most Powerful Women in Business” as well as one of the “Most Powerful Executives in Corporate America”. And in 2014, you were recognized as a “Top 35 Women Leaders in Healthcare” by the Women’s Health Leadership TRUST. That is a lot of recognition! What can you tell our readers about these awards and what they mean to you?
Kent: It’s always humbling and an honor to have one’s hard work recognized. However, that’s not what drives me. I have been in healthcare, and now health services, for my entire 30-year career. I would like to believe that I chose it, but I think it also chose me. It fuels my dual value drivers of altruism and achievement, and is an opportunity to do well, while doing good. I appreciate the recognition. However, what matters most to me, is to do good work that leaves patients, residents, my teams, as well as the organizations with whom I’ve worked, better than when I arrived.
Mace: You have served on many Boards, and as I mentioned earlier in our interview, you are now serving on NIC’s Board of Directors. What are some observations you have made about being on Boards and serving in that leadership role?
Kent: Leadership, in any organization, is a privilege. As a board director for any organization, it is critical to understand our governance role and not to confuse that with the role of management. Governance priorities include ensuring the best leader at the helm, oversight of enterprise risk, and input on strategic direction. As I mentioned before, this is a pivotal time for the senior living industry, as well as for NIC as it redefines its strategic priorities. I am fascinated by the depth of industry experience and knowledge on the Board, both capital partners as well as operators, with such diverse perspectives. I am delighted to be joining the Board at this time.
Mace: Diversity, equity, and inclusion (DEI) is increasingly important in today’s workplace. What are some ways businesses can incorporate DEI into their structures, and what are some practical near-term goals that can be set?
Kent: One practical goal is for business to create an equitable and inclusive environment, with a way for all associates to have their voices heard. At Brookdale, we established a hotline (known as the Integrity Line) for associates to report issues and concerns that will then be reviewed and responded to after careful investigation and evaluations. This process allows associates to report concerns without the threat of retaliation. Leadership carefully and thoroughly investigate and respond to such reports—and take action if/when issues arise. Brookdale has had an Integrity Line for this purpose for many, many years.
There is an overwhelming amount of research that demonstrates that diverse teams outperform on all financial indices. This suggests that employers will see measurable positive results with more effort focused on recruiting great talent and creating an inclusive environment where the best and brightest talent can thrive. We know that this is the right thing to do from personal as well as from business and financial perspectives.
Mace: Lastly, is there anything else you would like our readership to know?
Kent: It is awe-inspiring to see Brookdale’s ‘Everyday Heroes’ in action. I’ve seen many acts of selflessness over the years of my career, but I have never seen anything like Brookdale’s response to hurricanes, wildfires, and pandemic. It takes a special kind of person to work in senior living, and I am so glad to be part of the Brookdale team!

NIC MAP Vision Creates Data Powerhouse for Seniors Housing and Skilled Nursing Sectors: A Conversation with CEO Arick Morton
 The seniors housing and care sector is complex. Informed business decisions depend on reliable, best-in-class data on the factors that drive both supply and demand.
To provide the most robust decision-making tools, NIC recently acquired Raleigh-based VisionLTC, a leading data analytics platform serving many of the industry’s largest and most advanced stakeholders. Together, NIC and VisionLTC have created a new company, NIC MAP Vision. It is led by VisionLTC’s CEO Arick Morton.
NIC MAP Vision is the senior housing and care sector’s leading data and analytics provider and continues to define how the industry accesses and leverages data. Trusted by 5,000-plus stakeholders, NIC MAP Vision provides actionable market intelligence and over a decade of historical time-series data to make informed business decisions.
NIC Chief Economist Beth Mace recently talked with Morton about the integration of the two companies and how NIC MAP Vision provides significantly deeper and broader data for capital providers, investors, owners, operators, and developers.
Here is a recap of their conversation.
Mace: In this NIC Insider interview, it’s my pleasure to introduce the CEO of NIC MAP Vision, Arick Morton. Arick, can you please tell us about the merger of the NIC MAP® Data Service and VisionLTC?
Morton: The goal in creating NIC MAP Vision was to bring together the two best-in-class seniors housing data providers to create an industry-focused champion with the scope and analytical expertise to tackle the most vexing challenges. Some of these challenges include questions around development, integration with the broader healthcare system, and rebuilding census after the COVID-19 pandemic. Our mandate is to drive innovation and develop solutions that can help the seniors housing industry flourish and overcome challenges, while recognizing that the future is bright as demographic growth shifts in a favorable direction.
Mace: What is your vision for the combined entity? What makes you excited about its future?
Morton: We have so many opportunities to create value. That’s what really gets me most excited. The industry needs an optimized analytics solution. We are collecting all the data available and putting it under one roof. There’s been a revolution in machine learning, predictive analytics, and other advanced methodologies. We are bringing those capabilities together with NIC MAP and VisionLTC data to create an algorithmic, analytical engine to help users make optimal choices on transactions, development, and asset management. That is step one. We also see opportunity to connect seniors housing to the broader healthcare continuum. It’s an issue on the top of everyone’s mind. NIC has been very foresighted to elevate healthcare in the consciousness of the industry, a trend that is accelerating. But the lack of data and transparency is a challenge. It’s difficult to look inside seniors housing and really understand what’s going on from a medical utilization perspective. That’s something that we can provide. We also have a number of operational tools focused on helping to solve day-to-day core business challenges faced by the industry. It’s an incredibly complex business to run, and there are so many opportunities to bring data and analytics together to design tools to help operators and investors alike improve operational performance and resident care.
Mace: What is a future benefit from the merger that clients and prospective clients can expect over the next six to nine months?
Morton: We’ve been working around the clock to integrate the two platforms and provide a transformed user experience that expands functionality. Both user platforms are being upgraded. VisionLTC was in the process of upgrading its platform during the merger with NIC MAP. We expect a June launch of VisionLTC 2.0. The NIC MAP upgrade will be introduced after that. NIC MAP data will be included in the Market Insight product of VisionLTC 2.0. Users will have access to robust demand and occupancy data. NIC MAP Vision is working on a number of new data sets that will be included, such as Medicare outcomes data. We have a range of other data sets we are looking to add that will be coming out soon. Several advanced analytical models are under development that will be targeted for introduction later in the year.
Mace: What are the future synergies from collecting both supply and demand data within one organization?
Morton: NIC MAP Vision is unlocking the full value of the data by including both sides of the equation—supply and demand. We capture the local demand factors that drive a resident move-in, including demographics, number of adult children, income qualifications, medical needs, the number of seniors with dementia, how many seniors need help with three to four activities of daily living, co-morbidities associated with residency in seniors housing, the incidence of multiple falls, and other data. We capture home values, relocation patterns, and the seniors housing supply and performance. We also chart factors that impact property performance, such as the labor market. The integration of all the elements of the senior housing market performance equation under one roof unlocks the ability to apply machine learning and other advanced analytics techniques to provide the industry with even greater insight into market opportunity.
Mace: How does the merger affect existing clients of the NIC MAP Data Service and VisionLTC?
Morton: Clients will see tremendous benefits from the merger regardless of their subscription. Those with a joint subscription will be able to unlock the full value of the data sets. And those who subscribe to one of the services will benefit too with the additional functionality of the platform. The core focus of NIC MAP Vision is to continually improve our product offerings. We will be applying that logic to existing products as well as to future advancements.
Mace: What else would you like our readers to know?\
Morton: In just 45 days, this merger has already created a combined organization with incredible analytical and data capabilities. We have an amazing team with a great deal of seniors housing and care expertise. NIC MAP Vision is poised to develop and deploy a number of solutions to many of the industry’s most vexing challenges. We relish helping industry participants solve their business challenges. My favorite part of my job is understanding the challenges of industry stakeholders and figuring out what we can do to help solve those challenges. If any readers of this newsletter find themselves struggling with a business challenge, let’s set up a time to talk and see if there’s anything we can do to help. We obtain our best ideas this way, and we have an entire function inside the organization dedicated to developing new data, analytics, and products. If there is a real opportunity there, something we can do, we will attack it immediately.
Mace: In closing, thank you Arick. NIC is truly excited about NIC MAP Vision and the data it provides today and going forward to continue to advance the transparency of the seniors housing and skilled nursing markets.

The NIC Analytics OPTIC Ranking Index: Which Markets Could Recover Soonest?
By Beth Mace, Chief Economist and Omar Zahraoui, Data Analyst
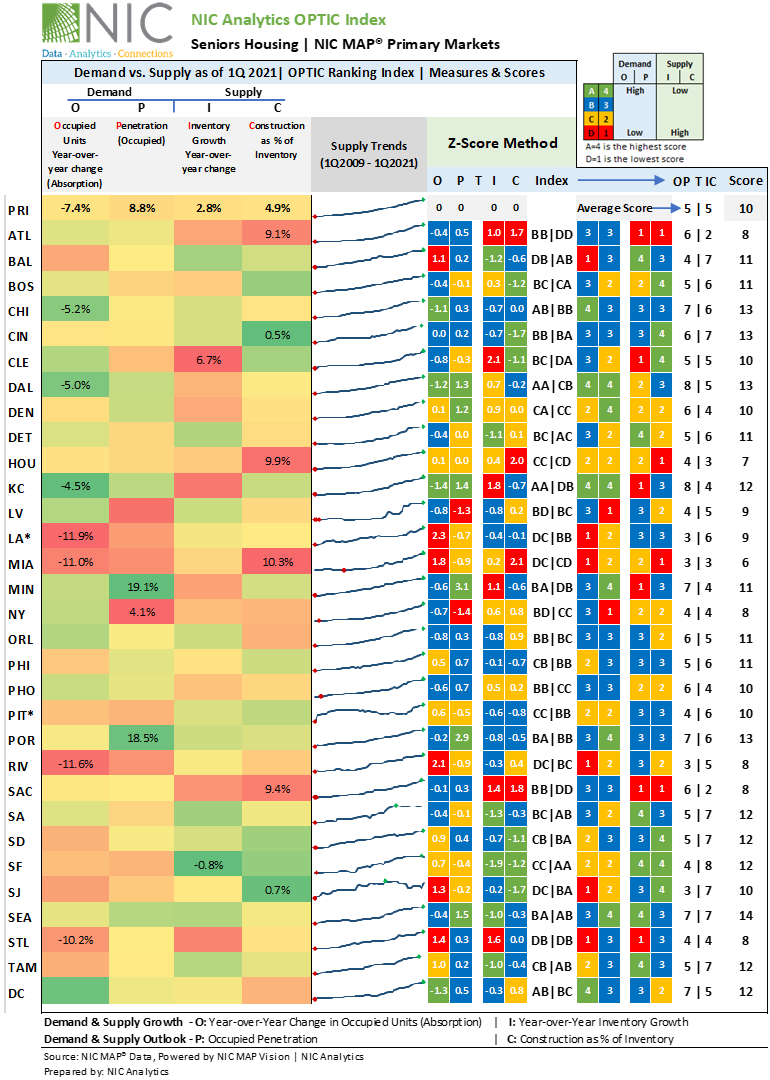
 In this article, we present the inaugural rollout of the NIC Analytics OPTIC Ranking Index. The OPTIC Ranking Index is calculated based on a systematic analysis of metropolitan market demand and supply metrics. It is intended to improve transparency, comparability, and understanding of seniors housing market performance historically and likely in the future. It will enable seniors housing constituents to evaluate and assess observed and anticipated supply and demand growth and the impact these factors may have on future occupancy trends.
This analysis attempts to answer the following questions:
- Will seniors housing markets with less development activity bounce back faster than ones where development pipelines are strong?
- Which of the 31 NIC MAP Primary Markets are likely to recover first, and which ones will lag?
Top Findings:
- The pandemic has overturned over three years of increases in seniors housing occupied units (or demand) in about half of the 31 NIC MAP Primary Markets (14 metropolitan markets), with two markets (i.e., Los Angeles and Pittsburgh) hitting their lowest levels of occupied units since NIC began reporting data in 2005.
- A newly-developed market-ranking index–the NIC Analytics OPTIC Ranking Index–indicates that the pace of recovery for seniors housing will vary across the NIC MAP Primary Markets and will be influenced by both historic and future penetration, as well as demand and supply trends.
- Based on the OPTIC Ranking Index, as of 1Q 2021, the highest-ranking seniors housing markets are Seattle, which received a score of 14, followed by Portland, Chicago, and Cincinnati. These are markets with strong demand and limited available supply overall. They should recover sooner than other markets in terms of occupancy.
- The lowest ranking seniors housing markets as of 1Q 2021 are Miami, Houston, Atlanta, and New York. Atlanta is a market with strong demand characteristics, but developers know this; and, as a result, construction activity is robust, limiting the speed of its recovery. In contrast, New York is a market where demand drivers, as measured by recent annual absorption rates and occupied penetration rates, are low, and new supply is relatively robust compared with the market average.
- Seniors housing markets with rising demand and fewer new developments will likely bounce back faster in terms of occupancy than the ones where new supply is high.
The OPTIC Ranking Index. The interaction of seniors housing supply and demand determines occupancy rates and the likely speed and pace of a market’s recovery. The NIC Analytics OPTIC Ranking Index evaluates and ranks seniors housing markets based on observed and projected supply and demand growth. The OPTIC Ranking Index is based on four critical performance metrics. This includes two demand measures: the year-over-year percentage change in occupied units (the O in OPTIC) and the occupied penetration rate (the P of OPTIC); and two supply measures: the year-over-year percentage change in inventory (the I in OPTIC) and construction as a share of inventory (the C in OPTIC). The OPTIC Ranking Index provides an objective and consistent measure of the impact these key metrics may have on metropolitan market occupancy rates. The index is intended as a benchmark to gauge the impact of seniors housing supply and demand dynamics in evaluating a metropolitan market’s future performance.
The index is computed based on a Z-Score. A Z-score is measured in terms of standard deviations from the mean. If a Z-score is zero, it indicates that the data point’s score is identical to the mean score. Z scores for the four metrics that comprise the OPTIC Index range from a negative 1.9 to a positive 3.1.
NIC Analytics then translates the Z-score into an ordinal value and letters of 1 (D), 2 (C), 3 (B), or 4 (A). For the demand metrics—the higher the value, the better, meaning that a score of 4 would indicate that the annual absorption rate for the past year has been high; or low if the value is 1. For the “P” or occupied penetration rate, a high occupied penetration rate is viewed as positive for demand, meaning (a) that seniors housing is a generally well accepted product offering in a metropolitan market and (b) that, once the pandemic is over, move-ins will accelerate at a rapid rate.
On the supply side, inventory growth over the past year (the “I” of the Index) is viewed less favorably for a market to regain its pre-pandemic peak occupancy rate—there is simply that much more inventory that needs to be filled. Hence, a market with a lot of inventory growth receives a lower score of 1. This is the same logic for looking at a market with a lot of construction as a share of inventory (the “C” of the Index). The higher the level of construction, the lower the ordinal ranking. Each of the concepts are defined in more detail below.
Starting With the “O” of the Index. This measure, the percentage change in occupied units from one year ago, or the annual absorption rate, becomes the “O” in the OPTIC Index. For the aggregated 31 Primary Markets, the annual absorption over the past year was a negative 7.4%. A few markets saw even sharper drops in absorption in the past year. This includes Los Angeles (-11.9%), Riverside (-11.6%), Miami (-11.0%) and St. Louis (-10.2%). Some markets did better, however. And this includes Kansas City (-4.5%), Dallas (-5.0%) and Chicago (-5.2%). Based on these absorption rates, a metropolitan market scored a 1 in the “O” part of the Index if its absorption rate was low and a higher score of 4 if its absorption rate was high.
And Now the “P.” The “P” in the index is the occupied penetration rate. Occupied penetration rate is defined as the number of seniors housing occupied units (as opposed to the total inventory base) relative to the number of 75-plus households in a metropolitan market. This is the same denominator as used in other NIC penetration rate calculations, but it should be noted that other denominators are often used as well including the number of households over 80 or 85, or the number of individuals over 75, 80 or 85.
For the Primary Markets in aggregate, the occupied penetration rate for seniors housing in 1Q 2021 was 8.8%. Pre-covid, the occupied penetration rate was significantly higher at 11.0%. The highest seniors housing occupied penetration rates in 1Q 2021 were in Minneapolis (19.1%) and Portland (18.5%). These high penetration rates may reflect the longevity and familiarity of the seniors housing product in these markets, as well as long-established brand recognition. Markets with low seniors housing occupied penetration rates include New York, Las Vegas, and Miami. New York has historically had a low penetration rate, as many older adults opt to bring services into their apartments and condos and given the market’s relatively low level of inventory historically. A high penetration market received a score of 4, while a low penetration market received a score of 1.
And the “I.” The “I” in the index is the pace of inventory growth during the last four quarters. For the Primary Markets collectively, inventory grew by 2.8%. The growth in inventory reflects construction starts and development that began prior to the pandemic. Notably, since the beginning of the pandemic, starts activity has slowed sharply as lenders have been reluctant to provide debt to borrowers seeking to pursue development. Markets with particularly low inventory growth in the past year include Baltimore, Detroit, Seattle, and Tampa. Markets with robust inventory growth include Cleveland, Kansas City, Sacramento, and St Louis.
Markets with high levels of inventory growth in the past year received a low score of 1, while markets with limited inventory growth received a high score of 4.
And Now the “C.” The “C” in the index measures construction as a share of inventory. It is a forward-looking metric of how much inventory growth is likely to occur within the next 18 months. It includes all units under construction – from recent starts to those near completion. For the Primary Markets collectively, it was 4.9% as of 1Q 2021. The markets with the highest share of units under construction relative to their inventory bases include Miami (10.3%), Houston (9.9%), Sacramento (9.4%), and Atlanta (9.1%). Conversely, markets with limited active construction include Cincinnati (0.5%), San Jose (0.7%), San Francisco, and Boston. Similar to the “I” of the Index, the more expected growth in inventory, the lower the ordinal rank.
And What About the “T?” The T is simply the joiner of the demand and supply metrics; consider it like a plus (+) sign.
And the Winner Is? The overall OPTIC Score is a combination of these four ordinal rankings. The higher the score, the stronger the market. However, when looking at the demand- (OP) and supply-sides (IC) of the OPTIC Ranking Index separately, seniors housing constituents – upstream and downstream – may interpret the OPTIC Scores differently based on their views of markets and perspectives on demand/supply growth.
The highest-ranking market was Seattle, which received a score of 14, followed by Portland, Chicago, and Cincinnati. These are markets with strong demand and limited supply. They should expect a faster recovery than others in terms of occupancy.
The lowest ranking markets were Miami (with a score of 6), Houston, Atlanta, and New York. Atlanta is a market with strong demand characteristics, but developers know this; and, as a result, construction activity is robust, and likely limiting the speed of its recovery. In contrast, New York is a market where demand drivers, as measured by recent annual absorption rates and occupied penetration rates, are low, and supply is relatively robust compared with the market average.
Some markets scored higher in demand growth (e.g., Dallas) but lower in terms of supply and projected development pipeline. On the other hand, some markets (e.g., San Francisco and San Jose) had a high score in supply but low in demand. In summary, a balanced supply-and-demand will help markets bounce back faster and accelerate those markets’ recoveries.
Conclusion. The OPTIC Ranking Index provides a framework for assessing a market. Four specific demand and supply metrics have been used to show historic and projected demand and supply metrics, but other trends can be used. This would include a longer view of absorption rates than just what has occurred in the past year as well as a longer view on inventory trends. Ongoing research by NIC Analytics evaluates in detail the impact the pandemic has had on seniors housing demand, and estimates when will seniors housing markets return to pre-pandemic occupied levels based on demand growth prior to the pandemic. Further analysis on this topic is forthcoming.
The analysis also has made a subjective opinion for supply growth and assumed that more inventory growth is less favorable. This makes sense if one is trying to increase occupancy rates, but other criteria may suggest that inventory growth is a good thing since new inventory is likely introducing state-of-the-art materials and design into the market. The aim of this article is to generate discussion and thought on how one should approach market selection and preferences. We’d love to hear your feedback!

Thoughts from NIC’s Chief Economist By Beth Burnham Mace
 An operator attendee at a recent NIC Meetup mentioned that they are not opening a wing of their property and further commented that they are turning away patients because they can’t find the appropriate staff to care for potential new residents. Notably, this is happening even in a time of pandemic-related record-low occupancy rates. And unfortunately, this is a lament that is not new and was a frequent experience even before the COVID-19 pandemic. Many of us thought that, as the jobless rate rose from the remarkably low level of 3.5% in March 2020 to a historically high level of 14.8% in April 2020, there would be more availability of workers to satisfy the staffing needs of the seniors housing and nursing care sectors. Unfortunately, this has largely not happened. Today, with a current unemployment rate of 6.0%, there is less but still noteworthy slack in the labor market. Yet, finding workers remains a significant challenge in our sector. This commentary addresses this issue.
Slack. Slack in the labor market can be measured by the level of jobs in an economy relative to a prior peak or the unemployment rate, among other measures. Of the 22 million jobs lost in March and April 2020, 14 million jobs had been recovered as of March 2021. An estimated 916,000 of these jobs were created in March 2021. Said another way, as of March 2021, there were 8.4 million fewer jobs than at the pre-pandemic peak. And, at 6.0%, the jobless rate was still above its so-called “natural rate” of 4.4% per Moody’s Analytics. These conditions suggest that the labor market is “loose.”
However, in the Federal Reserve’s Beige Book, labor market conditions are being reported as challenging. The Beige Book, produced eight times a year, provides anecdotal information on current economic conditions in each of the 12 Federal Reserve Districts through reports from banks’ branch directors and interviews with key business contacts, economists, market experts, and other sources. The most recent release was April 12 and was based on information collected between February 23 and April 5.
Labor Force Contraction. In general, the most recent Beige Book showed that while national economic activity was accelerating to a moderate pace from late February to early April, there were reports across all districts of challenges finding and retaining workers in a wide range of positions from entry-level jobs to care providers and nurses. More broadly, shortages were being reported for nearly all construction and transportation sectors as well. Additionally, many were reporting upward wage and price pressures. Some Beige Book respondents mentioned that they were raising starting pay and offering signing bonuses to attract and retain employees, and some were offering $1,000 bonus checks to restaurant workers who stayed in place for 90 days. Separately, reports of “no-shows” for interviews are being increasingly reported.
Greg Ip, a columnist in the Wall Street Journal, recently wrote a commentary about this phenomenon (April 22, 2021) and tried to explain how there can be seemingly still relatively high levels of unemployment and employment numbers that are well below pre-pandemic levels, yet anecdotal stories of tight labor markets. He attributed it to a drop in the labor force. The labor force—defined as people working or looking for jobs—is roughly 5 million less than before the pandemic. Despite the opportunities in the job market, people have simply dropped out of the working queue. This may be due to contagion fear associated with COVID-19, the need to take care of children/parents/loved ones due to the shutdown of much of the economy in the past 14 months, or perhaps a disincentive to work when unemployment insurance provides financial support. Additionally, the stimulus checks provided by the federal government could be an influencing factor.
Permanent vs Temporary Changes. The question becomes if this is a temporary phenomenon or if it remains permanent. As vaccinations increase and the economy kicks further into gear, workers may come back into the labor force. As schools fully open, working parents may re-join the ranks of the employed; and, as unemployment insurance benefits roll back, workers may be more compelled to find gainful employment with regular paychecks. This would all go some distance to closing the gap between demand for and the supply of workers.
However, compounding the labor force challenge is slowing population growth. The U.S. Census estimates that population grew by only 0.35% in 2020. This compares with 0.46% in 2019 prior to the pandemic and 0.74% in the beginning of the decade. Slowing birth rates and higher death rates associated with the pandemic and the recession limited natural population growth in the U.S. in 2020 (birth rates typically drop during a recession). Data from 32 of 50 states shows that the nation’s birth rate fell by more than 4% in 2020, i.e., 95,000 fewer births in 2020 than in 2019.
Slower population growth isn’t a short-term problem, however. The U.N. projects the population growth in the U.S. to continue to slow toward a more permanent annual pace of 0.5% by 2030 and 0.3% by 2050. This is a result of fewer children being born as well as restrictive immigration policies. Indeed, as fertility rates have fallen in the United States, immigration plays an increasingly important role in population growth, labor force growth, and ultimately economic growth. GDP growth is determined by labor force growth and productivity. Without labor force growth, potential GDP growth is limited.
Further adding to the labor force challenge is the aging of the labor force as those nearing “retirement age” drop out of the labor force permanently.
The observed “tight” labor market could also reflect a mismatch between job needs and locations as well. Those seeking jobs may simply not be located in the geographies where jobs are situated and /or there may be a mismatch in skills. Those with the requisite skills may not be situated where the those very jobs are located.
Infrastructure Spending. Additionally, as the Biden Administration promotes infrastructure spending through the American Jobs Plan (part of the “Build Back Better” presidential campaign agenda focused on investing in the national infrastructure) and other job-promoting programs associated with the $1.9 trillion American Rescue Plan (ARP), the demand for workers to fill jobs will grow further, applying further stress to finding workers for the seniors housing and care sector.
All of this has implications for potentially stronger wage growth and ultimately cost-push inflation as well. Inflation is front and center on the minds of many analysts these days as supply chain disruptions associated with the pandemic rear their heads and result in a surge in prices for construction and related materials, and numerous other segments of the economy as well.
Solutions. Biden’s infrastructure program has also drawn attention to the need for workers in the long-term care sector by including $400 billion to expand Medicaid home and community based services (HCBS). While solely focused at this point on home care solutions, the need for creating support for older Americans is being recognized. Hopefully, this recognition will be expanded to include the need for workers for congregate care settings as well.
A solution, or at least a partial solution, to the labor force challenge is a change in immigration policy. More workers simply are needed to take care of America’s aging population. This is not a uniquely American problem, as demographics across Europe, Japan, and China prescribe an imbalance between workers and retirees as well. The so-called dependency ratio—the ratio of the number of dependents (defined as those less than 20 years of age and those 65 and older) to the population of working age citizens (defined as those between 20 and 64)—has shifted in the United States from 67 in 2010, to 74 in 2020, to a projected 83 by 2030, according to the U.S. Census Bureau.
Technology can also be a partial solution in the worker shortage through efficiency gains associated with the use of electronic health records (EHR), robotics, and artificial intelligence (A|). The pandemic accelerated the incorporation of technology into the day-to-day operations of providers and will continue to do so.
But the gap between the supply and demand of workers will remain and requires attention at the policy level. Demand for the housing and care services provided by the seniors housing and skilled nursing sectors will only grow as the baby boomers approach their early 80s later this decade.
In wrapping up and as always, I appreciate and welcome your comments, thoughts, and feedback.
![]()

One Year of Executive Survey Insights By Lana Peck, Senior Principal, NIC
 Launched one year ago in mid-March 2020 as part of a broader effort by NIC to provide timely understanding of the impact of the COVID-19 pandemic across the seniors housing and nursing care sectors, this continuously running, bi-weekly, Executive Survey Insights analysis has been widely viewed and closely monitored by many industry stakeholders, operators, developers, investors, lenders, and analysts.
Yielding data on properties of every size, type, ownership structure, and across each care segment, every completed questionnaire delivers information from the perspective of an owner/operator’s entire portfolio of seniors housing and nursing care properties, providing real-time insights on hundreds of buildings and thousands of units across the country every two weeks since near the beginning of the pandemic.
The survey has provided a flexible medium for owners and operators of seniors housing and nursing care properties to help ensure the wider narrative on the sector is accurate. Early in the time series, in March and April 2020, the survey tracked operators’ mitigation strategies for labor shortages that were aggravated during the pandemic, availability of PPE, and the many ways operators were supporting property staff and their families during the crisis. Later in the series, the survey tracked the needs of operators in keeping residents and staff safe. Answers to questions pertaining to improvement in access to PPE and COVID-19 testing kits, time frames for receiving test results, and the availability, administration, and distribution of COVID-19 vaccines—demonstrates how the full continuum of this survey has kept the industry and the media informed about daily challenges and successes on the front lines and in the properties themselves.
Timeline of Executive Survey Insights and the Coronavirus Pandemic in the U.S.
As shown in the timeline below, across the time series from March 2020 to March 2021, the Executive Survey Insights results have shown clear trends that have corresponded with the broad incidence of COVID-19 infection cases in the United States. The chart below illustrates the drastic slowdown in seniors housing and care move-ins by care segment early in the pandemic, followed by somewhat of a stabilization over the summer, and another tapering off as conditions worsened in the fall. By Wave 18, the COVID-19 vaccine had begun to be distributed across the country through the Long-Term Care Vaccination Program (in the latter half of December) and the pace of move-ins accelerated as reflected in operators’ subsequent experiences in Waves 19 through 24. By Wave 24, the shares of organizations reporting deceleration in the pace of move-ins had fallen to this time series’ lows across each of the care segments.
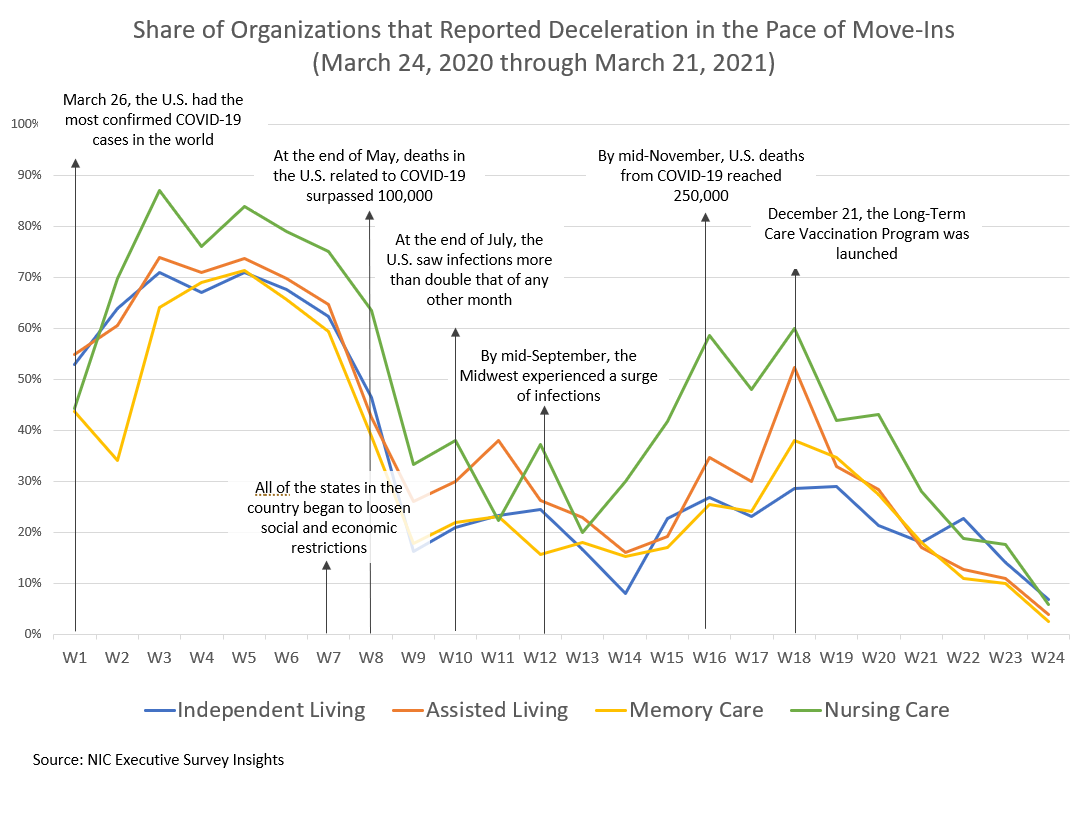
Comparing the chart above and the chart below, which details the same full year of survey data regarding the pace of move-ins (for assisted living as an example), one can see how closely the survey’s results have mirrored the reality experienced by many seniors housing and care operators during the various waves of the pandemic and lays out a framework for the time intervals to be discussed.

Survey Waves 1-10 (March 24 – August 2, 2020)
Early in the pandemic, the most common reason cited by operators for deceleration in move-ins was a slowdown in leads conversions/sales due to moratoriums of moving residents into communities to mitigate COVID-19 contagion within seniors housing and care properties. Ultimately, these bans on move-ins resulted in challenges backfilling vacancies. Respondents also noted at the time that they were seeing fewer hospital referrals or elective surgeries that had reliably served to bring in residents for therapy and rehabilitation stays prior to the pandemic.
By Wave 9 (early July 2020) in addition to bans on move-ins abating, survey respondents commented that improving availability of COVID-19 testing prior to entry, and lessons learned regarding sanitation measures and enhanced safety protocols for visiting with social distancing were working to provide reassurance about moving into seniors housing.
Survey Waves 11-15 (August 17 – November 8, 2020)
Presumably due to new spikes of COVID-19 cases in many areas of the country or possibly due to restrictions on family member visitation rules imposed by some states, more organizations in Wave 11 (late August 2020) than in all of the prior waves of the survey cited resident or family member concerns with moving a loved one into senior living.
While accurate and timely COVID-19 testing (within 48-hours) was considered crucial to operators’ ability to settle new residents into communities and keep them safe from outside contagion—which could be brought into community by visitors and staff—nearly two-thirds of organizations were waiting three-to-five days for test results to come back, and still only about one-half of respondents found it easy to obtain PPE and COVID-19 test kits. Frustration with testing turnaround times was expressed in the survey comments with some respondents fearing that the impact of the testing delays could result in difficulty mitigating infection control, further slowing the pace of move-ins, and hampering their ability to replace census.
By Waves 12 and 13 (September 2020), battling the pandemic was putting a strain on operating costs. Although the pace of move-ins had picked up somewhat in the summer months, more organizations were using agency or temp staff to fill staffing vacancies, adding to increasing operating costs since the pandemic began. Further, the share of survey respondents offering rent concessions to attract new residents in Wave 12 had grown to approximately one-half—a level that remained consistent going forward.
The use of rent concessions appeared to provide some support to occupancy rates as month-over-month seniors housing and care segment occupancy changes (from 30-days prior) in Waves 14 and 15 (October 2020) trended higher than in recent waves of the survey. The loss of revenue associated with a decline in occupancy rates across care segments in conjunction with rising expenses associated with staffing, PPE, and testing protocols was putting acute pressure on NOI for many operators and their capital partners. Beginning early in the pandemic, the majority of organizations had been bolstering staffing deficiencies with additional overtime hours.
Survey Waves 16-20 (November 9, 2020 – January 24, 2021)
The fall surge of the coronavirus resulted in another slowdown in the pace of move-ins, and an increase in the share of organizations reporting residents waiting to move in. Presumably as a result of better and safer visitation protocols and more acceptance, resident or family member concerns cited as a reason for acceleration in the pace of move-outs was then at the lowest level in the survey time series.
By Wave 19 (late December 2020 into January 2021), NOI continued to be pressured as nine out of ten organizations were paying staff overtime hours and two out of three were using agency or temp staff to backfill staffing shortages. The higher levels of care segments (assisted living, memory care, and nursing care) reported increases in PPE budgets commensurate with growing levels of care. Additionally, organizations with the largest portfolios of properties were more likely to report significantly higher PPE budget increases than single-site operators.
The drag on occupancy rates continued to be observed in the Wave 19 survey results, likely reflecting a combination of challenges in backfilling COVID-related vacancies as well as the effects of typical seasonality during the holidays and winter months. Despite reports of record-high COVID-19 cases across the country occurring daily, roughly two-thirds of respondent organizations were not increasing move-in restrictions presumably in part due to operator innovations in infection mitigation and creative visitation protocols which have gained acceptance from many residents and families.
Long-anticipated as a game-changer with regard to improving occupancy, many operators were starting to receive the COVID-19 vaccine. In December, the CDC prioritized skilled nursing and assisted living residents and staff members in phase 1a of the COVID-19 vaccine distribution. In Wave 20, ending January 24, 2021, four out of five organizations had finished their first clinic.
Survey Waves 21-23 (January 25 – March 7, 2021)
Amid growing optimism among operators, in late January when the survey data had yet to show an upward trend in occupancy, respondents were starting to notice an increase in prospect interest specifically related to the availability of the vaccine. Positive signals became palpable in the Wave 22 (February 2021) survey results, which revealed upward shifts in organizations reporting acceleration in move-ins and occupancy increases across each of the care segments. Data compiled in NIC’s Skilled Nursing COVID-19 Tracker clearly showed that COVID-19 cases in skilled nursing communities were falling at a faster pace compared to the U.S. since the launch dates of the Pfizer and Moderna vaccines in long-term care settings, and more organizations with memory care units and/or nursing care beds reported increases in occupancy than decreases since prior to the fall surge of the coronavirus.
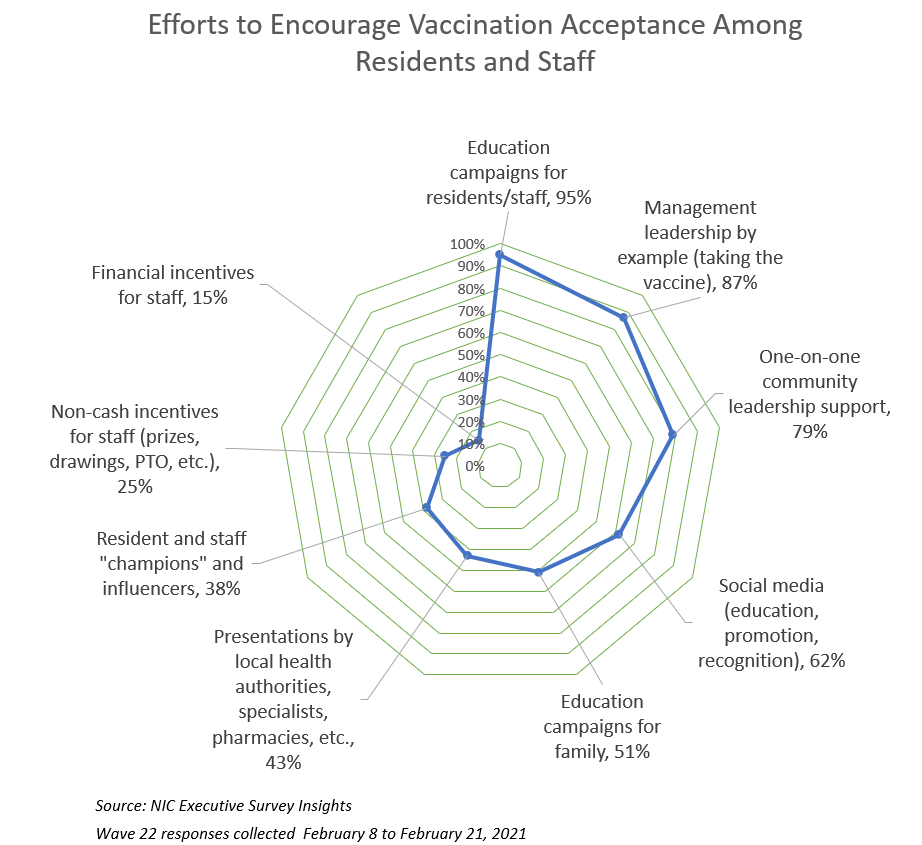
Roughly nine out of ten respondents in the Wave 22 survey indicated that educating and motivating staff to take the vaccine was a challenge, and operators applied a variety of strategies to encourage and improve vaccine acceptance. In addition to education/communication campaigns, community and corporate leadership stepped up and publicly took the vaccine themselves and the majority had been personally available with one-on-one support for concerned staff. Few respondent organizations incentivized staff to take the vaccine with financial benefits.
One year into the coronavirus crisis, the pandemic has necessitated many changes in the way seniors housing and care operators do business. In the NIC Executive Survey Insights Wave 23 results, respondents were asked to list one of the things that their organization plans to keep doing, stop doing, bring back and further develop. In addition to maintaining COVID-19 and infection mitigation protocols, organizations will continue leveraging virtual technologies for a variety of uses including digital marketing campaigns, entertainment, remote visits, and some activities.
Survey Waves 24-26 (March 8 – April 19, 2021)
According to Wave 26 (April 2021) seniors housing and care survey respondents, on average, nine out of ten residents (91%) of their respective properties—including all care segments across their portfolios—have been fully vaccinated for COVID-19. Staff uptake of the vaccine, however, leveled off between Waves 22 and 24 and has just recently increased slightly from over half (55%) to nearly two-thirds of staff in survey Waves 25 and 26 (63% and 64%, respectively). Having residents vaccinated has made a significant impact in opening communities. As stipulated by a variety of disparate state guidelines, many respondents commented that their organizations are now able to resume in-person tours, offer limited/socially distanced communal dining, and allow small indoor gatherings, worship services and larger gatherings outdoors. Others are now allowing family visitations in apartments and resuming off-site excursions of vaccinated residents. Many organizations indicate they continue to mandate mask wearing in community areas.
Staffing shortages that were experienced by many operators prior to and exacerbated by the pandemic persist. Four-out-of-five respondents to the Wave 26 survey indicated their organization was experiencing staffing shortages in their properties. Nearly all respondents to the Wave 25 survey were paying staff overtime hours, and four-out-of-five organizations were tapping agency/temp staff. In Wave 26, survey respondents described various strategies that operators are implementing to attract staff. Most organizations commented that they are offering hiring/sign-on bonuses, bonuses for employees who refer new hires, and wage increases. Others are staging job fairs and recruiting events, offering flexible shifts/schedules, and enhancing benefit packages.
The Wave 26 survey data continue to show a trend in the shares of organizations reporting higher occupancy across all four care segments, and each of the care segments set new peaks in the time series. Between one-third and more than one-half of organizations reported upward changes in occupancy.

Notwithstanding historically low occupancy rates, according to NIC MAP® data in the first quarter of 2021 (record low of 78.8% seniors housing occupancy rate), on average about 50% of survey respondents since July 20 indicated their organization was offering rent concessions. As of Wave 26, three-out-of-five respondents (61%) with multiple properties in their portfolios were offering rent concessions in more than half to all of their properties.

The market fundamentals in the Wave 26 Executive Insights survey data through mid-April show signals of making headway. Leads volume is up and the shares of organizations reporting accelerations in move-ins continues to trend positively with each of the care segments reaching new high points in the survey time series. Exactly when these leading indicators will translate into higher occupancy rates being reported across the sector is yet to be seen.
Going forward as vaccine optimism replaces uncertainty, the NIC Executive Insights Survey will track changes in the seniors housing and care sector with continued focus on the market fundamentals, labor and staffing, and other factors that affect NOI. From time to time, new questions will be asked as conditions necessitate.
NIC wishes to thank survey respondents for their valuable input and continuing support for this effort to bring clarity and create a comprehensive and honest narrative in the seniors housing and care space at a time when trends are continuing to change in our sector.
If you are an owner or C-suite executive of seniors housing and care and have not received an email invitation to take the survey, please click this link to complete the current survey or send a message to insight@nic.org to be added to the email distribution list.

State of the Market: One Year into the COVID Pandemic
By Emma Rosen, Director, Acquisitions, RSF Partners
 Current Macro Data Hides Recent Disruption
A snapshot of today’s real estate values and economic data does not reveal much evidence of the disruption caused by the COVID pandemic last year. The S&P currently sits at a record 4,173 – 23% higher than its pre-pandemic peak – and the average Commercial Property Price Index1, a real estate value indicator based on actual negotiated transactions, now trails its pre-COVID value by just 4.5%. It is not obvious in such figures such as:
- the number of travelers passing through TSA checkpoints in 2Q 2020 totaled just 11% of the volume during the same period the prior year2;
- by May 2020, only 38% of the pre-pandemic workforce was commuting daily – about half the percentage before the pandemic;
- by December 2020, 11,060 fashion stores and 17% of restaurants in the U.S. had permanently shuttered, while many more had been closed temporarily4; and
- the number of occupied units in senior living communities in 1Q 2021 was 7.3% fewer than the number of occupied units in 1Q 20205.
By the end of 1Q 2020, real estate capital providers, lenders, and tenants generally held a cynical outlook. Offices were vacated as workers were told to stay home – in May 2020, Twitter and Facebook told employees that most could work from home indefinitely, and the largest investment banks were all work-from-home with no plans to require return to the office until potentially summer 2021 (at which point they would only be at partial capacity). Hotels shut down – New York hotel occupancy dropped to under 20% the first week of April 2020 versus near 90% the same week of 2019 – and the “retail apocalypse” continued with more brands announcing closures or filing for bankruptcy court protection, from Tuesday Morning to Neiman Marcus. And with spring 2020 still early days into the pandemic, many assumed the worst was still to come and that economic and real estate distress was imminent.
Twelve months later, however, 1Q 2021 data presents not too far off what it might have been in the absence of the pandemic. The public markets are trading at all-time highs, and many are predicting a year of strong growth.
The Pandemic Has Cut Deeper but Evolved More Quickly and Unevenly than the Great Financial Crisis
One month into the pandemic, unemployment across the U.S. had jumped from 3.5% in February to 14.8% – significantly higher than the Great Financial Crisis (GFC) peak of 10% in 2009. GDP fell 31% from 1Q to 2Q 2020 – again, noticeably more severe than the largest quarterly drop during the GFC, which was “just” 8.4% in 4Q 2008. Within real estate, the Commercial Property Price Index (CPPI) lost 10% between March and April 2020, and by the end of the first quarter, equity REITs on average produced a year-to-date return of -20%, with the biggest losses being among mortgage REITs (-49%)6, lodging REITs (-46%), and retail REITs (-42%). Within eight weeks of the COVID pandemic, many aspects of the market had swung more than seen in the first 12 months of the GFC – peak unemployment during the GFC, for example, took over a year to reach, and CPPI fell for ten consecutive months during the GFC before hitting its trough.
As soon as 2Q 2020, however, GDP growth had turned positive again (+33% for 2Q 2020) and unemployment decreased by 1.4 percentage points. Lodging and retail REITs closed the year having recouped almost half their losses, while data center REITs yielded a very positive return of 21%. And today, in April 2021, one year into the pandemic, the S&P is coming up on one month of daily closings over 4,000, compared to the pre-pandemic peak of 3,300 in February 20207. Lodging and retail REITs have continued to gain, now up 19% and 24%, respectively, already this year8. Unemployment is back down to 6%, and GDP growth for the first quarter was 4.3%. The Congressional Budget Office (CBO) now expects GDP to return to its pre-pandemic level by the middle of 2021, which is a more optimistic than the CBO’s previous forecast because “the downturn was not as severe as expected and because the first stage of the recovery took place sooner and was stronger than expected.”9
Real estate was hit hard at the onset of the pandemic, however, values have largely recovered. Compared to the GFC, real estate has, on average, seen less of a decline in value, which is in part a reflection of the GFC being a financial crisis whereas the pandemic is a healthcare crisis. Moreover, banks are better capitalized today than they were in 2007, and they have higher underwriting standards today. Importantly, the government also reacted much more immediately and significantly to COVID than it did to Lehman’s bankruptcy and other early fall-out of the GFC.
 Figure 2 charts the average CPPI for all property values in bright red, with specific asset class CPPI graphed in other colors: while values declined 37% from peak to trough during the GFC, during the pandemic, average CPPI fell 9.5%.10 However, in the case of the GFC, the decline spanned 19 months, whereas during the pandemic, the fall occurred in the first two months, and then a recovery began.
Another key difference between the behavior of real estate during the GFC and during the pandemic is the great imbalance caused by COVID: different property types have fared very differently throughout the pandemic, as illustrated in Figure 2 with the divergence in the lines at the right side of the graph. While lodging and retail real estate CPPIs immediately lost 20-25% in value last year, industrial CPPI was only very briefly and slightly down and is now 15% higher than its pre-pandemic high. Industrial’s success is a direct effect of the acceleration of the COVID-triggered jump in e-commerce activity and the increasing demand for warehousing and logistics space. Healthcare and office values have been hurt more modestly than lodging and retail, however, healthcare has rebounded more so than office, likely because much of healthcare real estate relates to need-based products or services, whereas many office users have shown they can be productive at home.
Government Stimulus Has Supported Businesses and Markets
The federal government has supported businesses and, in turn, real estate values. Lodging CPPI is already back to ~90% of pre-pandemic values, much like office (now 91% of pre-pandemic values) and just trailing the recovery of apartments, SHOP, and skilled nursing (95% of pre-pandemic values). This is evident in the public markets as well, as NAREIT reports total returns for 2021 year to date almost fully compensate for the negative returns among lodging and retail REITs in 2020.
To date, the government has provided $5.3 trillion in fiscal stimulus and an additional $3.4 trillion in quantitative easing. And government agencies acted immediately: it was in the first two months of the pandemic that the federal government passed $2.8 trillion in relief packages and that the Federal Reserve resumed its quantitative easing program and expanded its repo operations by $2.0 trillion. It was also in March 2020 that the Federal Reserve lowered the federal funds rate twice and by 150 bps total to 0.00-0.25% and cut its discount rate from 1.5% to 0.25%. The federal government has continued to step in meaningfully when distress looms, as evidenced by the most recently passed $1.9 trillion American Rescue Plan in March 2021.
By propping up businesses with PPP loans and other stimuli, and by encouraging landlords and lenders to be lenient with tenants and borrowers, significant distress has been avoided, at least for now, and borrowers have been able to avoid default. CoStar reports that real estate transaction volume in the first quarter of 2021 totaled $64 billion, a 62% increase from the pandemic low in 2Q 2020, but still down 34% from 1Q 2020. In terms of distressed sales, Real Capital Analytics calculates that distressed retail sales comprised 2.4% of retail transactions (vs. 12.8% during the GFC), while just 1.3% of office sales and <1% of multifamily and industrial sales. Only lodging has seen meaningful distressed activity, with distressed lodging sales comprising 8% of hotel sales. Trepp similarly estimates modest delinquency rates: 0.73% for industrial, 2.2% for office, and 3.1% for multifamily. Only within lodging and retail is there notable rates of delinquent CMBS – 15.0% for lodging and 10.9% for retail.
Optimism Prevails Despite Ongoing Challenges
Goldman Sachs is currently forecasting economic growth of 5% for 2021, and JP Morgan Chase CEO Jamie Dimon predicts, in a March letter to shareholders, an “economic boom” that “could easily run into 2023.” While many have been significantly hurt by COVID, consumer spending has been increasing (up 2.3% for 4Q 2020), and with vaccines available, data show more people traveling and dining out again. Many businesses have indeed successfully weathered the COVID storm. As explained above, however, this is in large part thanks to government stimulus. For the NIC readership base, the skilled nursing industry is an obvious example: occupancy among skilled nursing properties fell 14.4 percentage points to 74.2% from 1Q 2020 to 1Q 2021, yet the volume of distressed skilled nursing and senior housing property sales remains relatively low (<1% of total sales11 ). Would this be the case without CARES funds and PPP loans?
Those with memories of prior downturns and particularly the GFC might suggest that we are still in an early phase of the fallout from COVID: distress takes time to unravel. If the stimulus stops, and if certain industry veterans are proven correct in their predictions – that 40% of hotels in Manhattan will permanently close (Starwood CEO Barry
Sternlicht12 ), 10,000 more apparel stores will soon close (Coresight Research13 ), and 50% of pre-pandemic business travel will never return (Microsoft Co-founder Bill Gates14 ) – then consumer spending will likely ease, companies will go out of business, and distress will ensue. Others, however, see the S&P and Dow up 33% and 16%, respectively, from their pre-pandemic highs and note the record $324 billion in dry powder that real estate investors are seeking to deploy15. After a year at home watching and evaluating, both those with a clear outlook and strategy and those simply consumed by FOMO16 will be back in the market with their checkbooks.
