Want to Know Where the Market is Headed? Ask a Broker. A Conversation with Todd Lindblom at Marcus & Millichap
 Brokers know what’s selling, what isn’t, and why. Daily contact with buyers, sellers, and lenders give brokers reliable insights into the market. They know what’s possible, and what isn’t. What’s smart, and what isn’t—especially during a highly disruptive pandemic.
NIC Chief Economist Beth Mace recently talked with Todd Lindblom, regional manager at Marcus & Millichap, a leading specialist in commercial real estate investment sales, financing, research, and advisory services. Lindblom also serves as the national director of Marcus & Millichap’s Seniors Housing Division. They discussed what buyers and sellers can expect just ahead. Here’s a recap of their conversation.
Mace: Can you tell us about Marcus & Millichap and your specific role?
Lindblom: Marcus & Millichap has close to 2,000 investment professionals located throughout the United States and Canada. Founded in 1971, our firm closed nearly 10,000 transactions in 2019 with a value of approximately $49.7 billion. Our company has perfected a powerful system for marketing properties that combines investment specialization, local market expertise, comprehensive research, and relationships with the largest pool of qualified investors.
Currently, I’m a regional manager with oversight of both the Milwaukee and Minneapolis offices. I’m also the national director of the Seniors Housing Division. It has 34 agents in 20 offices throughout the United States and Canada. Collectively, the Seniors Housing Division has closed more than 1,600 transactions in 45 different states worth over $11 billion since its inception. We execute transactions across the entire care continuum, including independent and assisted living, skilled nursing facilities, and continuing care retirement communities.
Mace: What is your view of the current state of the market?
Lindblom: The pandemic has significantly disrupted the seniors housing sector with owners and operators still mostly focused on the health and care of residents. Transaction volume in the space is down considerably on a year-over-year basis. The broader commercial transaction market was down 56 percent in the second quarter and down an estimated 35 to 40 percent in the third quarter. With respect to seniors housing, requests for property valuations have increased significantly over the past 60-90 days. Owners with larger portfolios are evaluating their holdings on an individual asset basis.
Smaller owner/operators remain primarily focused on resident safety but have recently begun to initiate conversations about bringing assets to market. The buyer pool consists mostly of private equity firms with ample cash looking for well-valued assets. The REITs are not as active because they have more internal and logistical hurdles to overcome. In an odd way, buyers and sellers are acclimating to the pandemic and becoming more comfortable. There is an enormous volume of capital beginning to flow into the market. We expect transaction activity to pick up in the fourth quarter. Deals put under contract when COVID hit will finally close. Pricing has held up. Contracts now include COVID clauses that allow the buyer to exit or delay the deal. But generally, the market is starting to move again.
“We are playing a game measured in decades. So, a disruption that lasts a year or two, while difficult, is still short.”
Mace: How do you underwrite deals in a period of uncertainty?
Lindblom: Underwriting standards still lack clarity and can vary significantly across the country. We stay in contact with investors, lenders, appraisers, and our team of brokers and try to identify and understand the underwriting hurdles and to inform the owner/client. Regarding COVID, we have not seen a remarkable change in our underwriting so far.
We look at each property or assignment on a case-by-case basis. We analyze everything that could impact the deal: potential buyer pool, occupancy prior to the pandemic, current census, and extra costs related to staffing and the purchase of personal protective equipment. If a facility has been greatly impacted by COVID, we might recommend that a seller hold the asset until the property is restabilized. Although there is a strong buyer pool for a discounted facility with troubled operations, it’s often not in the best interest of our clients to sell the property. If the owner must sell, Marcus & Millichap will help the investor position the asset for market.
Mace: What do our readers need to understand about the assumptions you make in assessing and valuing properties?
Lindblom: Every region is its own micro-climate with regards to economics and transactions, and there’s a great deal of variance. We need to really do a deep dive on a case-by-case basis as regions and individual assets have been affected differently. Understanding the buyer pool and capital stack is critical.
The main assumption we make is that COVID is a short-term obstacle. Many of the assets we’re marketing will continue to do well. And those that are struggling primarily due to COVID should rebound as states remove their restrictions and COVID runs its course. In some cases, as I said, we will advise the client to hold off on marketing until census/operations improve.
Mace: How do you describe today’s capital markets?
Lindblom: It’s probably one of the largest transactional hurdles right now. Many lending sources are still not back in the market. Good rates are available in the commercial world right now but finding debt providers for seniors housing remains difficult. It’s one of our bigger unknowns. Apartment, industrial, and most office assets face fewer financing hurdles. There’s a lot of liquidity. But financing for many retail properties and seniors housing is much tighter, and even more difficult for hotels. Funding for new entrants into senior housing would be exceptionally difficult. Buyers with a strong balance sheet and significant operational track record can get debt, but at a slightly higher rate than, say, apartments.
On the positive side, we are seeing more lenders continue to re-enter the space and bring back their full line of loan products. Stabilized assets still have a good home with Fannie Mae, Freddie Mac, and HUD offering historic low rates in the mid to low three percent range. Reserves of 12 to 18 months of debt service are required depending on the market and leverage. Banks are the primary lender for distressed, pre-stabilized, value-add, or any other story-type deal. In these cases, cost basis, guarantor experience and balance sheet strength are paramount. Even in a strong market, the cost basis and sponsor/borrower profile need to meet certain standards to find competitive bank financing.
Banks are financing assets generally in the 65 percent loan-to-value range with rates in the high three percent to low four percent range. Full-recourse loans are the rule regardless of leverage. Bridge loan pricing is finally starting to decline since there have been some successful collateralized loan obligation (CLO) securitizations. Whereas pricing started in the six percent range this summer, we’re now seeing pricing back down in the high four percent to high five percent range. The bridge loan market is where we’re seeing more activity. These lenders are more likely to understand a turnaround story than a bank.
Mace: How does the availability of capital and access to capital affect your viewpoint?
Lindblom: We are vetting buyers very thoroughly to ensure they have a good plan in place for their capital.
Mace: Where is pricing today? Has the risk premium for seniors housing widened?
Lindblom: It’s a moving target that really depends on the property and a number of variables, as always. I believe the overall outlook regarding risk premium has eased. When COVID first hit, the consensus was that the impact on seniors housing valuations would be significant, but people are coming to terms with the new normal and risk premiums are coming back in line. There will be a pricing adjustment for assets that were struggling pre-pandemic. But we’re seeing some pricing normalcy for assets that were and have continued to be relatively stable as the long-term view remains positive. There is also a disconnect in terms of available inventory in comparison to the buyer pool which will help to underpin pricing. Many investors are looking at this as an opportunity to acquire assets that generally wouldn’t be for sale. There may be some pricing disruption as more properties come to the market in 2021, but that remains to be seen.
Mace: Is there a property type you prefer?
Lindblom: We have clients that own and transact across the entire care continuum. Each segment is quite different, but they all have a solid long-term outlook. There are buyers for every property type.
Mace: In your crystal ball, what are you optimistic about? Pessimistic about?
Lindblom: The industry is surviving well, and once we are past COVID, the industry will be stronger. I believe the effects of COVID will be felt well into the first half of 2021, and perhaps beyond that. A lot will depend on whether another round of stimulus is passed. If government assistance dries up, then we will see the hurt the pandemic has caused some organizations. There is continued need for stimulus and support of seniors housing in managing through this health crisis. Access to personal protective equipment is better now, and facilities are more equipped to handle COVID. We need a medical solution through therapeutics and ultimately a vaccine for our industry and the country to really move forward. At that point, the economy and seniors housing should reach some sense of normalcy.
Mace: Anything else you would like our readers to know?
Lindblom: Amid a pandemic that so greatly affects the resident base, we have seen many owners and operators contend very well with the crisis. I believe this is why our research department survey found that last quarter the seniors housing industry was the second most desired industry by investors. We are playing a game measured in decades. So, a disruption that lasts a year or two, while difficult, is still short. Investors have a long-term view which is favorable considering the demographics and metrics on the horizon.

Executive Survey Insights | Wave 15: October 26 to November 8, 2020
By Lana Peck, Senior Principal, NIC
 “A key underlying theme that can be derived from looking at the findings of the Wave 15 NIC Executive Insights survey as a whole is uncertainty. Uncertainty around the need for seniors housing and care operators to use temporary and agency staff, ability to grow NOI amid rising costs of labor and PPE, the pace of sales in light of consumer concerns about being able to visit loved ones, and the direction of record low occupancy rates. When (and how) life as we knew it will settle into a new normal are all being driven by the durability of the pandemic.”
—Lana Peck, Senior Principal, NIC
NIC’s Executive Survey of operators in seniors housing and skilled nursing is designed to deliver transparency into market fundamentals in the seniors housing and care space at a time when market conditions continue to change. This Wave 15 survey includes responses collected from October 26 to November 8, 2020. Detailed reports for each “wave” of the survey can be found on the NIC COVID-19 Resource Center webpage under Executive Survey Insights.
Wave 15 Survey Demographics
- Responses were collected from October 26 to November 8, 2020 from owners and executives of 64 seniors housing and skilled nursing operators from across the nation. Half of respondents are exclusively for-profit providers (52%), one-third (33%) are exclusively nonprofit providers, and 15% operate both for-profit and nonprofit seniors housing and care organizations.
- Owner/operators with 1 to 10 properties comprise 56% of the sample. Operators with 11 to 25 properties make up 24% of the sample, while operators with 26 properties or more make up 20% of the sample.
- Many respondents in the sample report operating combinations of property types. Across their entire portfolios of properties, 72% of the organizations operate seniors housing properties (IL, AL, MC), 33% operate nursing care properties, and 33% operate CCRCs (aka Life Plan Communities).
Wave 15 Summary of Insights and Findings
- Staffing is a growing challenge for many operators. More than two-thirds of respondents—70% up from 36% in Wave 3—are using agency or temp staff to fill vacancies. Although down slightly from Wave 14, most respondents are continuing to pay staff overtime hours, putting ongoing strain on NOI. While fewer organizations in Wave 15 than earlier in the pandemic continue to allow staff to work remotely and offer paid sick leave, three-quarters are still offering flexible work hours.
- The use of rent concessions may be providing some support to occupancy rates, as month-over-month seniors housing care segment occupancy changes in Waves 14 and 15 trended higher than in prior waves of the survey. Between 62% and 69% of organizations with any independent living units, assisted living units and/or memory care beds reported offering rent concessions. Fewer organizations with any nursing care beds reported offering rent concessions (43%).

- In Wave 15, similar shares of organizations with independent living units, assisted living units and/or nursing care beds reported roughly equal proportions of increases or decreases in month-over-month occupancy changes.

- The shares of organizations with assisted living units reporting increased month-over-month occupancy is the highest in the survey time series at 42%. Just under one-half (45%) of organizations with memory care units, 40% with nursing care beds, and roughly one-third (30%) with independent living units noted upward changes in occupancy rates in the past 30-days. Regarding the change in occupancy from one week ago, between two-thirds and three-quarters of organizations (63% to 79%) reported no change.
- The shares of organizations reporting no change in the pace of move-ins and move-outs in the past 30-days for the independent living, assisted living and memory care segments remained high in Wave 15 (between 49% and 52%). That said, while smaller in proportion, the shares of organizations reporting accelerations in move-ins outpaced decelerations in the independent living, assisted living, and memory care segments.
- In Wave 15, organizations with nursing care beds had both the smallest share of reported accelerations in the pace of move-ins and the largest share of decelerations in the pace of move-ins since Wave 8.


- As shown in the line graph below, the share of organizations citing increased resident demand as a reason for acceleration in move-ins in Wave 15 also remained high. The 29% of organizations citing hospital placement in Wave 15 is up from a low of 13% in Wave 12 and down from a high of 41% in Wave 10. Resident or family member concerns was cited most frequently as a reason for deceleration in move-ins and reached the highest point in the survey time series at 88%, followed by slowdown in leads conversions/sales at 75%. Interestingly, there appears to be a relationship between these two primary reasons.
- Respondents citing an organization-imposed ban as a reason for deceleration in move-ins increased from 0% in Wave 14 to 17% in Wave 15. While still a small percentage, about one in five respondents (19%) indicated their organizations were increasing move-in restrictions in one or more of their properties. This is up from an average of 7% in waves 11 through 14 (surveyed early August to the end of October).
- One-third of organizations with nursing care beds (33%) reported an acceleration in the pace of move-outs. This was the largest share since the Wave 5 surveyed in late-April to early-May.
Three-quarters of organizations (77%) reporting acceleration in move-outs cited resident deaths (reason unspecified), which was up from 61% in Wave 13. Resident or family member concerns declined from 52% in Wave 13 to 45% in Wave 15, followed by residents moving to higher levels of care (41%).


- Accurate and timely testing (within 48 hours) and access to PPE is crucial for operators to keep residents safe from contagion and grow occupancy. Over one-half of respondents find it easy to obtain COVID-19 test kits and PPE. A significant improvement since the late summer months, more than one-half of respondents (56%) received their COVID-19 test results within two days, up from 13% in Wave 10, surveyed late-July to early-August.

- About one-quarter of organizations (24%)—more than in the Wave 10 survey (13%) and similar to the Wave 3 survey (27%)—expect their development pipelines to decrease. The reason cited by all of the respondents was uncertainty.

Owners and C-suite executives of seniors housing and care properties, we’re asking for your input! By providing real-time insights to the longest-running pulse of the industry survey you can help ensure the narrative on the seniors housing and care sector is accurate. By demonstrating transparency, you can help build trust.
“…a closely watched Covid-19-related weekly survey of [ ] operators conducted by the National Investment Center for Seniors Housing & Care…”
Wall Street Journal | June 30, 2020
If you are an owner or C-suite executive of seniors housing and care and have not received an email invitation to take the survey, please click this link or send a message to insight@nic.org to be added to the email distribution list.
NIC wishes to thank survey respondents for their valuable input and continuing support for this effort to bring clarity and transparency into market fundamentals in the seniors housing and care space at a time where trends are continuing to change.

By the Numbers: Seniors Housing Occupancy Performance in the Pacific Region
By Beth Burnham Mace, Chief Economist
 Of the 99 Primary and Secondary Markets that the NIC MAP® Data Service (NIC MAP) tracks across the nation, 13 are in the Pacific Region. These 13 metropolitan markets have 1,358 investment-grade seniors housing properties totaling 156,000 units, or more than 15% of the seniors housing units regularly followed by NIC within the 99 markets. (Seniors housing units are comprised of independent living, assisted living and memory care units). Within the region which is comprised of California, Oregon and Washington state, performance measurements vary, and the impact of the COVID-19 pandemic has been jolting. The shock of the pandemic is not the only influencing factor on occupancy rates, however. The legacy of recent development activity and ongoing construction pipelines continue in some markets, one of which—Sacramento—will be highlighted in this commentary. And in other markets—San Jose, for example—the recent vestige of more limited construction activity helps support a relatively higher occupancy performance, albeit lower now due to a loss of occupied units because of move-in restrictions associated with COVID.
Of the 13 Primary and Secondary Markets within the Pacific Region, all but four had 3Q 2020 occupancy rates higher than the overall Primary and Secondary Market average benchmark of 82.3%. As the table below shows and ranked from highest to lowest according to third quarter occupancy rates, this includes San Jose, Modesto, San Francisco, Fresno, Ventura, Portland, Seattle, Los Angeles, and San Diego. Of the 13 markets, four were sub-performers. These include Stockton, Sacramento, Riverside, and Bakersfield.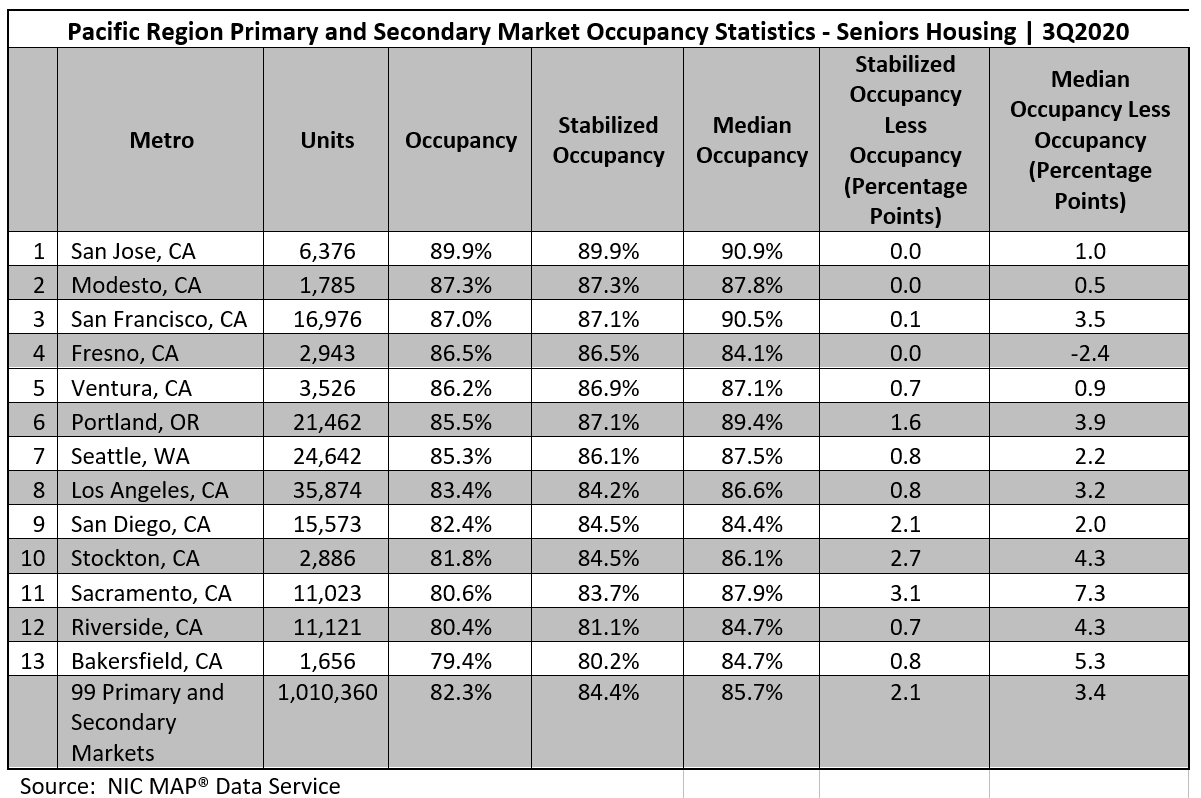
Median, Stabilized and Total Occupancies: What’s What? Digging deeper into Sacramento, the relatively low occupancy rate of 80.6% in the third quarter reflected the impact of the pandemic on net absorption in the past six months (with 684 units of negative net absorption), but also stemmed from new product entering the market—nearly 400 units since the end of 2019 (4% increase in stock and 850 units since late 2018 or an 8% increase in stock). Further development is underway, with nearly 1,600 units under construction. As these units open, they will exert further downward pressure on an already low occupancy rate, especially during the forthcoming months of further probable coronavirus infections (or at least until a vaccine is widely distributed).
One quick way to gauge the impact of newly opened competition is to look at the difference between total occupancy and stabilized occupancy. As the table above shows, this ranges from virtually no difference in some markets to a wide 3.1 percentage point difference in Sacramento. Further detail from the NIC MAP® Analyst report shows that there are six properties with 690 units that are not yet stabilized in Sacramento, most of which opened in the past 18 months. Hence, recently opened but not yet leased properties are also adding pressure to this currently over-supplied market.
The distribution of occupancy rates in Sacramento also shows the pressure newly opened properties are exerting on overall occupancy performance. Although the average occupancy rate was 80.6% in Sacramento, the median occupancy, defined as the mid-point of the distribution, was 87.9%. The very wide 7.3 percentage point difference between these rates is due to a relatively large share of lower occupied properties pushing the average rate down. This may be due to new properties that are just in early lease up or it may be due to a larger share of poorer performing properties. Indeed, the distribution of seniors housing occupancy rates within Sacramento shows that 31% of the 108 properties in Sacramento had occupancies below 80% in the third quarter, compared with 17% in the first quarter of 2020. This large share is dragging down the average rate.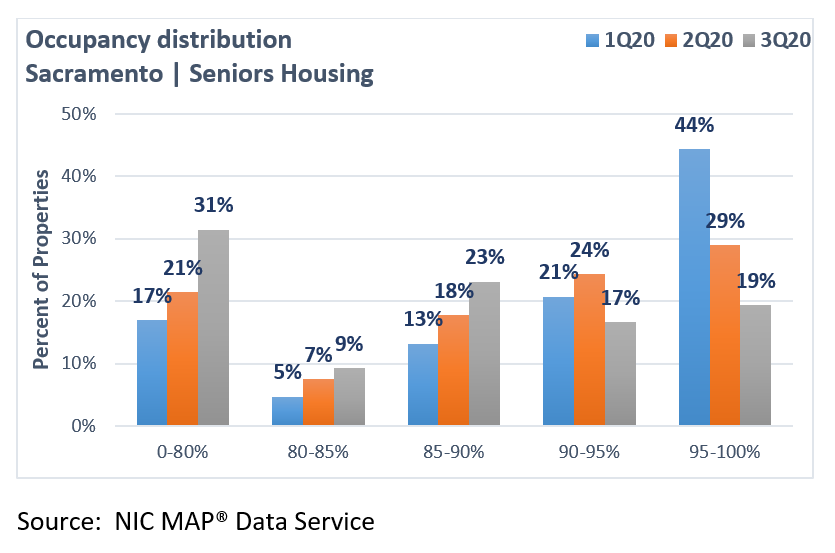
San Jose Retains Top Ranking. On the other end of the performance spectrum is San Jose, which had the highest occupancy rate within the Pacific region and was the only metropolitan area in the region that ranked among the top-five most occupied metropolitan markets in the country. With a 3rd place ranking (out of 99 Primary and Secondary Markets), San Jose’s occupancy rate of 89.9% in the third quarter was 7.6 percentage points higher than the national average. Notably, however, the impact of the pandemic did not skip San Jose, as its third quarter occupancy rate was 4.9 percentage points below its pre-pandemic level of 94.8%. The decline in occupancy was due to a loss in occupied units (with negative absorption of 856 units in the second and third quarters); supply growth has been limited. The two-quarter decline in occupancy in San Jose was slightly less than the nation which saw a 5.2 percentage point drop from 87.5% in the first quarter to 82.3% in the third quarter.
Once again, by looking at the difference between the median and total occupancy rate, it becomes clear that there are considerably fewer sub-par performing properties in this market especially compared with Sacramento (1.0 percentage point versus 7.3 percentage points). The higher overall occupancy rate of San Jose reflects far fewer properties with very low occupancy rates. Indeed, a smaller 16% share of properties had occupancies below 80% in the third quarter, and this was unchanged from the first quarter. Further, there was little difference between total occupancy and stabilized occupancy, meaning that there are few newly constructed properties in this market that are in lease-up. This in turn reflects the fact that the development pipeline in San Jose has been relatively limited, and therefore fewer properties recently opened to drag down occupancy rates since there were simply fewer properties in lease up.
Difficult zoning regulations and entitlement rules, and the subsequent barriers to entry imposed on new development, mean that California’s construction activity remains relatively low for many of its coastal metropolitan markets. While this is bad news for those trying to get into the market, it is decidedly good news for incumbents in those markets as well as those developers and operators that currently have projects underway.
Rank Order Shifts. Following San Jose, the metropolitan markets of Modesto and San Francisco had the 2nd and 3rd highest occupancy rates in the Pacific Region in the third quarter. This was followed by Fresno, Ventura, Portland Oregon and Seattle Washington, which ranked 4th through 7th within the Pacific Region. These seven markets all had occupancy rates above 85%. As the table below shows, San Jose suffered the most occupancy loss among these seven markets (4.0 percentage points) since the pandemic began in the first quarter, and Fresno the least (3.7 percentage points).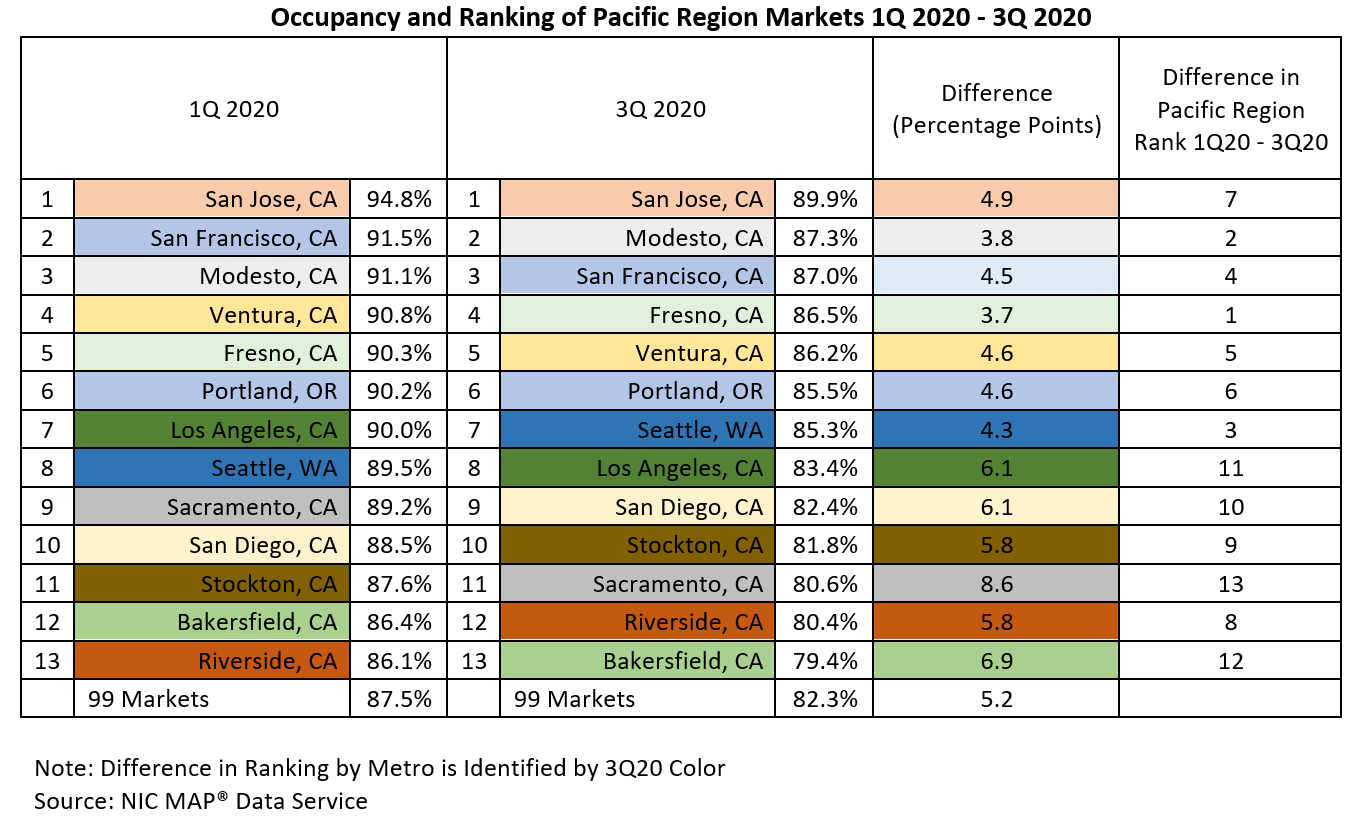
The market with the greatest loss in occupancy was Sacramento (i.e., 8.6 percentage points), pushing its occupancy rank among the Pacific markets to 11th in the third quarter, down from 9th in the first quarter. This was followed by another Central Valley metropolitan market, Bakersfield, where occupancy fell 6.9 percentage points to 79.4%.
Conclusion. The pandemic has caused occupancy to fall precipitously for many markets in the Pacific region—as much as 8.6 percentage points in Sacramento. The strongest markets—San Jose, Modesto and San Francisco—remain generally strongest and the weakest—Bakersfield and Riverside—remain generally the weakest but the reasons for individual market performance have changed from simply a supply response to a demand response due to the coronavirus. Looking ahead, the demand response as evidenced by the direct impact of the disease on leasing activity and net absorption will largely be determined by the still unfolding devastation of the second wave of the COVID-19 pandemic. At the time of this writing, a few vaccines look promising, although they remain unproven outside of controlled testing environments. If, and when, a proven vaccine becomes ubiquitous for front line workers and residents, an expected jump in occupancy for all seniors housing segments can be anticipated due to pent up demand. Indeed, waiting queues already exist. Moreover, the challenges of excess supply in many markets, especially in the central parts of California, may start to dissipate going forward as many projects have been cancelled or postponed. While this is difficult for those with projects on hold, for the near term, this is good news as the competitive landscape may be less crowded in the not so distant future.
To learn more about the NIC MAP® Data Service, contact the NIC MAP Sale & Client Services team by emailing sales@nic.org.

“It Is Not Perfect… But We Are Not Going Back” 2020 NIC Talks, Part One
A highlight for many attendees since 2015, the ever-popular NIC Talks returned again this year for the 2020 NIC Fall Conference, featuring another small group of America’s most informed experts, all answering the question “How Will COVID-19 Impact the Future of Aging and Aging Services?” As with previous years, each short TED-x-style presentation was delivered by an accomplished, influential thought-leader from a variety of sectors that are informing and influencing seniors housing and care – but from beyond its own walls.
As promised in 2020 NIC Talks promotional materials, “If you’re eager to hear that it will soon be ‘business as usual’ again for seniors housing and care, you won’t want to listen to this year’s NIC Talks.” Instead, each speaker focused on how COVID-19, demographic changes, and shifting public perceptions are driving fundamental changes impacting operating models, and new ways of thinking about design and delivery of care for America’s elders.
In his introduction, NIC Founder and Strategic Advisor Bob Kramer emphasized the importance of paying attention to a swiftly evolving market, saying, “Remember, in a time of disruption and disruptive innovation in our industry, you want to be a disruptor, not the disrupted. Those who are disrupted usually go out of business.”
Underlining that point, the first to speak was Dr. Tim Ferris, MD, CEO of Mass General Physicians Organization and Professor, Harvard Medical School. Dr. Ferris began by relating how, as a young physician working at Massachusetts General Hospital, he had to put his medical license on the line to provide appropriate care to his grandmother, who lived in a congregate setting, rather than allow her to be transported to the hospital. Speaking from his perspective as one of the nation’s top medical officers, Dr. Ferris made it clear that the old model is no longer acceptable – and that the seniors housing and care sector faces both a challenge and an opportunity as the world changes around it.
Dr. Ferris focused on three macro-trends brought on by the pandemic, “digital, hospital at home, and infection control.” He pointed to the reality that COVID-19 has “very nearly destroyed” barriers to the widespread utilization of digital medical technology. Mass General, which cares for over 12,000 patients every day, went from providing only three percent of those patient encounters virtually, in pre-COVID days, to over 50 percent today. On digital healthcare delivery, he concluded, “It is not perfect, and it does not come close to completely replacing the importance of, and need for, in-person encounters, but we are not going back.”
Hospital-at-home is also here to stay, driven both by value-based care, and the need, amidst the COVID-19 pandemic, to keep “minor acute illness and recovery” within home settings, including seniors housing settings, and out of the hospital. He said, “Care is coming to patients rather than patients coming to care. I could have used that for my grandmother.”
Dr. Ferris’s final point was that infection control is now “front and center” as a top priority for all congregate settings. He stated that infection control will become, “a whole new industry,” employing new technologies, building designs, and tech such as smartphones, smart speakers, and video to significantly advance infection control beyond today’s disposable barriers and PPE, both in the hospital, and in the seniors housing and care community.
Although some of these new measures may slow things down initially, they will eventually improve, and will in many places be required by regulators and payors. Those senior living operators who remain on the cutting edge, in Dr. Ferris’s eyes, will gain an important differentiator, particularly for adult children, who, post-COVID, will likely prioritize effective infection control when making purchasing decisions.
As he concluded his talk, Dr. Ferris argued that these trends will continue to accelerate beyond COVID, driven by newly available payments, new regulatory requirements, and new competitive drivers to demonstrate superior outcomes. Healthcare systems will want to negotiate with operators who demonstrate the ability to deliver care where their residents live, in order to meet the requirements of a value-based payment system. The underlying message seemed not only to be that the healthcare system is evolving very swiftly – but that it will be looking for partners in seniors housing and care.
In his introduction of the next speaker, Krista Drobac, executive director, Alliance for Connected Care, Kramer pointed to her “long and distinguished background in healthcare, working in the U.S. Senate, at the Centers for Medicare and Medicaid Services (CMS), and, as the Director of the Health Division of the National Governors Association.” Although coming from a more policy-oriented perspective on healthcare than Dr. Ferris, Drobac shared the view that healthcare is swiftly evolving, and that this is a time of great opportunity for the seniors housing and care sector, as the drive to care for seniors where they live becomes a more widespread – and more permanent – reality.
Describing years of slow progress before COVID-19, as she worked to gain access to telehealth for seniors through Medicare, Drobac was surprised at the speed with which things changed. “As you can imagine, I was fairly surprised at the beginning of the spring, when in the matter of one month, all of the barriers that we’d been working to break down, fell.” Today, she is advocating for the trend to continue, even beyond the pandemic, and to result in new care models for seniors, where they live.
Like Dr. Ferris, Drobac saw a massive shift as COVID-19 hit the U.S. Before the pandemic, she said, “Out of 55 million seniors on Medicare, only 13,000 accessed telehealth every week.” That number rocketed to a total of 9 million from mid-March to mid-June of 2020. Six million of those encounters were ‘evaluation and management codes,’ which Drobac explained are mainly primary care check-ins, chronic disease management, and triage kinds of visits. An additional 500,000 seniors per month during the same period used telehealth to access mental health services.
Rather than preserving existing models of in-person care using telehealth, Drobac advocates for the creation of new models of care, that allow seniors to age in place. Barriers include fragmented provider networks, a lack of interoperability of medical records, and “thin” coverage of in-person care in the home. Hospital discharge policies also present a challenge, providing little assurance that patients are able to properly care for themselves once they go home. She sees the permanent establishment of telemedicine as a key to overcoming many such challenges.
Using a story, Drobac illustrated where some of the gaps exist in today’s healthcare experience, particularly for seniors, and where they may likely be resolved in the future. Her protagonist, a 69-year-old woman living in an age restricted apartment community, has a fall, resulting in a broken hip, that results in transportation. In many instances, beyond major metropolitan areas, this requires crossing state lines in order to access specialty care. Without a sheaf of her medical records, and without interoperability of digital records, her doctors fail to notify her primary care or specialist providers. She is discharged but is unable to drive to rehab. She would be unable to get treatment, even with telehealth, from a different state. Her dial-up internet is not sufficient, even with a telehealth practitioner. She is isolated and becomes depressed. Missing physical therapy and follow-up visits with her providers, she becomes less attentive to her diabetes, gaining weight. Ultimately, she becomes homebound.
The story changes dramatically with a few changes. Replace dial-up with a 5G network. Interoperability of her medical records enables any healthcare provider, anywhere, to understand her history. With telehealth in place at her doctor’s office and the hospital, she can receive in-person care with a visit, but then receive follow-up care, check-ins, and disease-management services via the internet, and with her own doctors. With in-home reimbursement models, she can receive care in her apartment, such as physical therapy, nursing, or a fall prevention assessment.
Asking us to imagine these changes, Drobac said, “we would live in a much safer environment, and we would be able to stay in our homes much longer.” Wireless monitors, quarterly calls with her medical team, and telehealth connections from her local hospital – which could access surgical specialists from further afield – all would greatly improve this senior’s quality of life and ability to stay at home, minimizing the need to travel for care.
While the technologies all exist for this scenario, Drobac advocates for policy and regulatory change, in order to make it more widely available. Specifically, Drobac asked her audience to call their member of Congress and support the “Protecting Access to Post-COVID Telehealth Act,” which, she said, would make permanent the telehealth changes enacted as a response to the pandemic. In addition, Drobac advocates for more connectivity infrastructure, such as 5G networks, particularly in rural areas. She said, “This is going to take new care models, new incentive structures, and new permissibility for different kinds of providers to come to your home, so ask your members of Congress for that.”
Look for a review of the second day of the 2020 NIC Talks program in next month’s NIC Insider, featuring the insights and unique perspectives of Louise Aronson, MD MFA, professor, UCSF Division of Geriatrics; Daniel J. Cinelli, FAIA, principal, Perkins Eastman; and Jo Ann Jenkins, chief executive officer, AARP.
A library of all NIC Talks presentations, including those from previous years, can be accessed on NIC’s YouTube Channel.

Dramatic Moments: 30 Years of Investment in Seniors Housing and Care
While much of the programming for the recent 2020 NIC Fall Conference focused on the pressing issues of today, particularly during a time of COVID-19, economic and political uncertainty, and disruption, one session stepped back, and looked at what is happening today through a lens that stretches back to 1991.
In “Dramatic Moments in History: Another Period of Disruption,” Kurt Read, Chair of Board of Directors, NIC; and Principal, RSF Partners; provided a review of the seniors housing and care industry’s performance characteristics over the last three decades. Following his professorial, yet highly practical, and accessible retrospective presentation he introduced past, present, and future leaders of NIC, to comment on what the organization has achieved over its nearly 30 year history – and where it will likely lead the industry in coming years.
Crammed with original charts, and many examples pulled from his own experiences as a long-time investor in the industry, Read’s presentation was a guided tour, pointing out key facts and figures through recessions, building booms, floods of capital both into and out of the industry, major disruptions, and the current worldwide pandemic. The overall effect was of a master class, not to be missed by anyone with an interest in the sector.
Attendees of the 2020 NIC Fall Conference who might have missed the session when it initially aired, can access the session recording online. For everyone else, NIC is publishing a three-part series of posts on the NIC Notes blog, which provide highlights in bite-sized pieces.
The first of these posts, titled “Dramatic Moments: 30 Years of Investment in Seniors Housing and Care, Part 1,” reveals how rising demand and falling rates, changing demographics, and a series of disruptions over the past 30 years, have impacted the industry. Readers will delve into the characteristics of each of the four major disruptions which have occurred over the last three decades, including the savings and loan crisis of 1986-1995, the healthcare real estate crisis of 1998-2001, the great financial crisis of 2008-2009, and, of course, the current healthcare crisis, which has yet to run its course.
Another way to look at the past 30 years is to see how this relatively new industry features development cycles, driven by the need to meet growing demand. Read analyzed three distinct cycles, which have occurred since 1991. Part two of the NIC Notes series goes into these in more detail. Looking at all three of the economic crises outlined in the first NIC Notes post, Read observes three distinct opportunities to buy quality properties at lower prices, saying, “You put periods of disruption together with a highly cyclical development flow and money flow into our space, and what you get are some really interesting opportunities.” While opportunities exist, Read cautions to keep an eye on capital flows into the sector, however, and to be patient.
Heading into the current period of disruption, in the third and final post, Read looks at a number of factors impacting the market today, including cap rates and the cost of capital. He looks at NCREIF annualized total investment returns, observing that, “We’ve gone from being the darling to one of the team.” He looks at transaction volumes and occupancy rates across different property types, underlining the importance of context when understanding the impact of this pandemic across the sector.
Finally, Read introduces a number of NIC leaders, past, present, and future, to share, in their own words, the role NIC has played in the development of the seniors housing and care sector – and how it will continue to help support access and choice for America’s seniors in the years to come.
