May 2019
Equity Investor Takes Aim at Vertical Integration: A Conversation With Bridge Investment Group’s Blake Peeper
 Product specialization and vertical integration are the hallmarks of Bridge Investment Group. The firm not only invests in several different commercial real estate segments, but also operates property management divisions across its various asset classes.
With two seniors housing private equity funds, Bridge advanced its integration strategy last December with the acquisition of Somerby Senior Living, a seniors housing management company that operates a portfolio of nine seniors housing properties in the Southeast.
As plans unfold for the firm to leverage the Somerby operating platform, NIC’s chief economist Beth Mace recently had the opportunity to talk with Blake Peeper. He is deputy chief investment officer of Bridge Seniors Housing Fund Manager LLC, based in Orlando. What follows is a recap of their conversation.
Mace: Can you tell us about Bridge Investment Group?
Peeper: The principals of Bridge Investment Group LLC began in real estate in 1991 and became a nationally-respected property management firm. Then, launched their first discretionary fund in 2009 and became a registered investment advisor in 2011. We focus on value-add investing alongside property management with equity and debt strategies within private equity. Our hallmark is that we have specialized investment and property management teams across various asset classes. In total, Bridge has 2,600 employees and $15 billion of assets under management. We have 34,000 multifamily units, more than 10,000 seniors housing units, and 13 million square feet of office space across the country.
We launched the seniors housing team in 2013. The leadership team has an average of 20+ years of experience with transactions totaling more than $7 billion. Currently, Bridge has two private equity funds dedicated to seniors housing. We are actively investing, and we anticipate that we’ll be making multiple property acquisitions throughout 2019 and 2020.
Mace: What is your investment strategy?
Peeper: We invest in stabilized, value-add properties, and development opportunities, with clear investment criteria in each of those categories. Generally speaking, we focus on market quality, building quality, and operator quality and alignment. Our platform is set up to drive value for our investors, so we are comfortable with the risk of repositioning, capital improvements, and lease-up. We’re fairly long-term investors compared to other private equity firms, and we underwrite properties for 5- to 8-year hold periods.
Mace: What’s different about seniors housing compared to your other business lines?
Peeper: The biggest difference is that other Bridge verticals are fully integrated from an operating perspective. In seniors housing, we have integrated Somerby, but we also partner with other third-party operators to drive investment returns.
Mace: Do you invest in all seniors housing segments?
Peeper: We invest primarily in independent, assisted living, and memory care community types. The vast majority of our properties have combinations of two, if not all three, levels of care. We invested in some for-profit CCRCs in our first fund.
Mace: Recently, Bridge acquired Somerby Senior Living. Can you tell us why you were interested in Somerby?
Peeper: When we look at investment opportunities, we take into consideration the product, the markets, and the people. The Somerby acquisition checked the box on all three and was a unique opportunity to acquire a portfolio of nine highly-occupied, best-in-class properties within high barrier-to-entry markets and with a proven and scalable operator. We executed the transaction quickly in about 90 days. First and foremost, we were highly attracted to the real estate. The properties are leaders in their respective markets. Additionally, Somerby’s operating company was performing at a high level with 94%occupancy across the portfolio and a very high level of resident satisfaction.
The acquisition of the operating company has several benefits. It creates alignment between the owner and manager. We have found that when operators think like owners, culturally and structurally, it leads to quality performance. We see the acquisition and integration of Somerby into our fund management platform as a key to managing the risk and opportunities related to delivering care, understanding resident preferences, and developing best practices.
Mace: Do you own other operators?
Peeper: No.
Mace: Is Somerby part of your property management division?
Peeper: One of the things that differentiates Bridge is our product specialization and vertical integration in each asset category we are involved in. So, in the case of our multifamily group, for example, they manage all of the multifamily assets we own. The same is true for commercial office space. The world of seniors housing is different. We will have a vertically integrated property management company through Somerby, but it will not operate all of the properties we own. We are very committed to the space and will continue to grow with our current operating partners and seek new operating relationships throughout the country.
Mace: How much equity has Bridge invested in seniors housing since it was established?
Peeper: The seniors housing group has invested $1.15 billion of equity since 2014 and more than $400 million in the past 12 months.
Mace: What are your assets under management?
Peeper: Bridge Seniors Housing Fund Manager LLC has $3.6 billion of assets under management, including the addition of about $1 billion in the past 12 months.
Mace: How big is your team?
Pepper: We have 42 employees in our Orlando office dedicated to our seniors housing investment platform. The Somerby corporate staff in Birmingham has 22 people.
Mace: What’s your source of capital?
Peeper: We raise discretionary capital through multiple channels including sovereign wealth funds, public and private pension funds, family offices, and high-net-worth investors that span the globe.
Mace: You have an opportunity zone initiative. Is seniors housing a part of that?
Peeper: For Bridge, the opportunity zone initiative is a chance to leverage the in-place knowledge base across the Bridge verticals. Currently, the seniors vertical is actively supporting the OZONE team on potential seniors housing investment opportunities.
Mace: NIC is sponsoring a big study on middle market housing opportunities for middle income seniors. Would the opportunity zone be a good way to create a more affordable seniors housing product because of the tax benefits?
Peeper: No question. It’s an interesting idea.
Mace: From an operator’s standpoint, why is Bridge a good partner?
Peeper: We consider ourselves to be very supportive and relationship-oriented capital. Seniors housing operations is complex and challenging, and we feel our history in the sector and our emphasis on relationships helps to create an alignment of interests and good outcomes. Our capital is nimble, and we can grow with our operators through development and acquisitions. Furthermore, we can invest in single assets and portfolios.
Mace: How do you choose operating partners?
Peeper: First, we look for depth of experience and cultural alignment around resident care and satisfaction. We want partners with good systems and infrastructure, and a high level of focus on sales and marketing.
Mace: How do you align interests with your operating partners?
Peeper: We create alignment through various joint venture and incentive management structures. The variations of structures depend on the nature of the deal as well as the resources of our operating partners.
Mace: When do you turn down a deal opportunity? Any immediate red flags?
Peeper: We like to think we see our fair share of investment opportunities in the market. In the first quarter of this year alone, we tracked over 16,000 units across a variety of product and market quality and investment types. We typically turn down deals for reasons associated with market characteristics and the relevance of the building. We are highly focused on markets with deep demand and growth potential. We like buildings that have the physical characteristics to be relevant as new competition comes online.
Mace: What physical characteristics do you look for in a building?
Peeper: We look for purpose-built senior housing buildings that have the proper amount of amenity and activity space to create an environment where residents and associates can excel. As part of our review, we pay close attention to the dining experience, including the quality and number of dining options. We evaluate unit mix in terms of studios, one- and two-bedroom units and unit square footage, as well as unit mix from an acuity perspective. We also evaluate finish levels and amenity offerings relative to the competitive set and typically identify opportunities to renovate or upgrade.
Mace: Do you only invest in the U.S.?
Peeper: Yes.
Mace: Is there any locale that you avoid?
Peeper: We do not avoid specific regions. We think seniors housing is a regional, if not local, business. We acknowledge regional trends and have preferences on where we like to invest. However, our underwriting of local markets is the primary driver of where we choose to invest.
Mace: Any thoughts on how seniors housing has changed in the last five to ten years? Anything that makes you excited about the sector? Or worried?
Peeper: We find the business to be rewarding, especially when we are touring communities and see happy and engaged residents. There is nothing better than getting feedback from resident family members about how happy their loved one is at one of our communities. In our business, happy residents, happy/engaged associates, and happy families translate to highly occupied communities, which in turn results in favorable returns for our investors. We approach this business and our properties with a sense of pride in service, which includes capital reinvestment in the properties to support our operating partners in an effort to benefit the residents.
The industry has evolved in the past five-plus years. The investor base has expanded from public and private REITs to include a growing number of private equity groups. Meanwhile, cap rates have compressed, and we’re seeing pricing hit some unprecedented levels on a price per unit basis. From a product perspective, we have seen the design and programming evolve to be more residential and include amenities that enhance the resident experience. New supply in the past few years exceeded our expectations, but thankfully we are starting to see that get absorbed. These factors and more continue to put an emphasis on quality operators. Identifying those operators and establishing good alignment can be challenging.

Thoughts From NIC’s Chief Economist
 Breaking A Record
In July, a significant record is likely to be broken. The U.S. economy officially will be in the longest expansion recorded since 1854, beating out the 10-year or 120-month expansion of the 1991 to 2001 period. In addition, this growth period is now more than twice as long as the average expansion of 58 months enjoyed in the post war period. Wow! It’s a remarkable time in which we live.
The question now is how much longer will this growth continue? What factors could cause a slowdown or even a reversal of fortune? The business cycle has not disappeared. Are we around the corner from a recession? What are the indicators we can be watching?
Recession Triggers
As has been repeated often of late, an expansion does not die of old age in and of itself. Other factors come into play. This could include an unexpected shock to the economy as has often occurred in the past, such as an oil price spike (1973-75 recession as OPEC quadrupled oil prices). Often related to an oil price shock is a sudden run-up in inflation which generates a sharp retraction in spending behavior, slower economic growth, and an increase in joblessness. Possibly adding fuel to a slowing economy are rising interest rates caused at least in part by the Federal Reserve trying to slow inflation (1980-82 recession). Consumer and business confidence are also significant contributors to exacerbating or reversing broad economic strength. And lastly, financial shocks—busts following a boom or the popping of an asset bubble—can lead to serious setbacks such as the subprime mortgage crisis in 2007 and the dot-com bust in 2001 (exacerbated by the 9/11 attack).
Until January, it was widely speculated that the U.S. economy would slip into recession by 2020 as (a) the short-term positive effects of the 2017 deficit-financed tax cuts and fiscal stimulus faded near year-end 2019 and (b) the Federal Reserve continued its policy of rate normalization by raising interest rates. The sentiment held by many was that this would tip the scales into a recession. However, as Federal Reserve chairman Jerome Powell indicated in the early part of this year, his previously announced intentions of raising interest rates in 2019 have likely gone on hold as the Fed pledged to take a “patient” approach to future policy changes. As a result, the fear of the Fed stepping too heavily on the brakes by raising interest rates and tipping the economy into a sharp downturn have now dissipated to at least some degree. In fact, many prognosticators believe the Fed’s next move may be to cut interest rates to stimulate further growth in the economy.
All in all, it is now likely that the U.S. economy will slow in 2019 due to the waning effects of the tax cuts and fiscal stimulus as well as an overall slowdown in the global economy, a potential escalation of the Trump administration’s tariffs on China (and other countries), and slowing growth in the automotive and housing industries.
For 2020, and barring any significant exogenous shock to the economy, it is also not likely that a severe recession will take place, which, combined with moderate growth in 2019, would clearly cement this recovery as the longest one in U.S. history.
Yield Curve Warning Sign
One indicator to watch as an early warning indicator of a recession though is the shape of the yield curve. The yield curve plots bond yields from the shortest maturity to the highest and is considered a barometer of economic sentiment. Normally, the yield on a shorter-dated 3-month Treasury bill is less than a longer-dated 10-year bond. That’s because the perceived risk for holding a bond for a longer period of time is higher. In “normal” market conditions, the yield curve is upward sloping as bond investors require higher rates for a longer-hold period than a shorter-hold period.
When the longer yield is lower than the shorter-term instrument, it creates an inverted yield curve, and it is typically an indicator of concerns about the long-term growth potential of the overall economy. When the yield curve inverts, it is a leading indicator that a recession may be on the horizon. Historically, the yield curve has inverted 7 to 24 months ahead of a recession. An inverted yield curve does not guarantee a recession, but since 1956, every recession has been preceded by an inverted yield curve.
On March 22, the yield curve inverted for the first time since mid-2007, i.e., the yield on the U.S. 10-year Treasury note dipped below the yield on the 3-month paper. Time will tell if this was a harbinger of a recession next year.
Is Seniors Housing Recession-Resilient?
While an economic recession does not appear to be on the immediate time horizon, it may be prudent to consider the seniors housing sector’s recession-resiliency. For this, we can look back at how the sector fared during the Great Recession from December 2007 to June 2009.
During that period, a difference was observed in the occupancy performance of assisted living properties versus independent living properties. For assisted living, the occupancy rate fell 3.1 percentage points from 89.5% in the third quarter of 2007 to 86.4% in the second quarter of 2009, a near-record low rate of occupancy (the subsequent nadir was 85.2% in the second quarter of 2018). Once the recession officially ended, occupancy for assisted living began to improve.
Independent living lost 4.3 percentage points of occupancy during this same time period (91.7% in the third quarter of 2007 to 87.4% in the second quarter of 2009) and continued to slip further until the third quarter or 2010 when it hit a low of 86.8% (for a total decline of 4.9 percentage points). Independent living occupancy declined for a longer period, and the decline was more significant than that of assisted living.
The difference may be that, because assisted living is more need-based and less choice based, it is less sensitive to the economic cycle. When an older adult has significant mobility limitations or significant activities of daily living care, it is difficult to not respond. Independent living is perceived as less need-based and more choice-based, so it may be more easily postponed. This may have been particularly the case during the Great Recession, since that recession was largely housing related and significant amounts of home equity were eroded, reducing the dollars available to move into a preferred housing option.
Unlike other property types, asking rent did not go negative for either independent or assisted living properties during the Great Recession or in the months thereafter, but they did decelerate during this period. For assisted living, year-over-year asking rents shifted from a 3.7% annual pace just prior to the recession starting to 1.9% by the end of the recession in mid-2009, and then continued to decelerate to 1.1% in the fourth quarter of 2010. For independent living, asking rent growth decelerated from 3.9% before the recession to 2.9% at the end of the recession, and then decelerated to 1.2% by late 2010.
In terms of investment returns, for the seniors housing properties that are tracked by National Council of Real Estate Investment Fiduciaries (NCREIF), there were two quarters of negative total investment returns during the recession for a cumulative decline of 6.1%. This compares favorably with the overall NCREIF Property Index (NPI), which had six quarters of negative total investment returns for a peak-to-trough decline of 26%.
Taken in its entirety, seniors housing is not recession resistant, but it did show resiliency during the last economic recession. This was particularly the case for assisted living. Looking ahead, the need-based component of assisted living (including memory care) does suggest that, when (not a question of if) the next recession occurs, investors would be wise to have assisted living in their portfolios, especially in those markets where today’s market fundamentals are strong.
As always, I welcome your comments and feedback.
Beth

NIC Skilled Nursing Data Report: Key Takeaways from Fourth Quarter 2018
 As the skilled nursing sector entered 2018, there were very few bright spots as the sector dealt with numerous challenges in the years leading up to 2018. However, as 2018 progressed, the latest data showed the sector had potentially stabilized, as occupancy hovered around 82% since April 2018. And, now in 2019, there are more positive indications that demand may in fact be increasing to offset the excess patient day capacity that we have seen in recent years. One could consider this a cautiously optimistic outlook in the near-term.
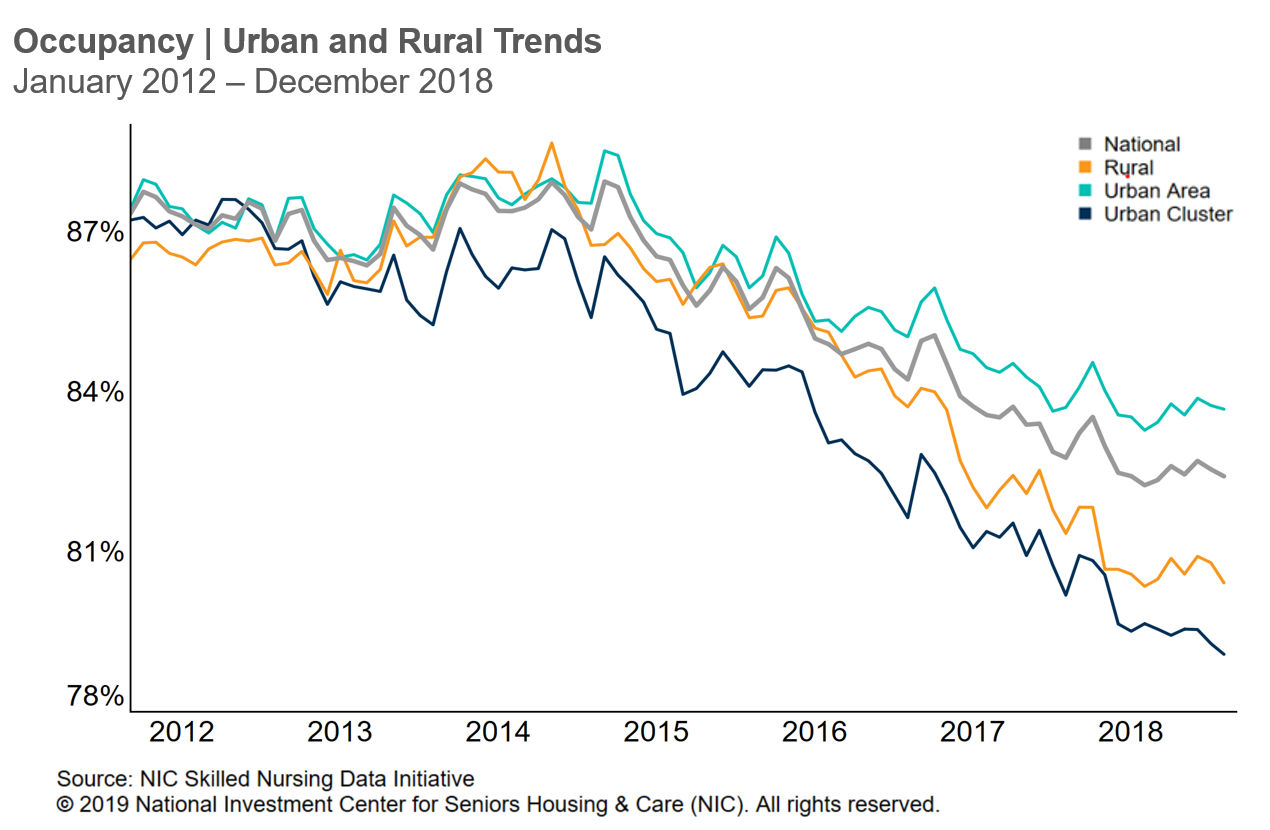
NIC released the fourth quarter 2018 edition of its Skilled Nursing Data Report in March 2019, which included key monthly data points from January 2012 through December 2018. The report also includes the latest urban vs. rural comparative data points as well as revenue mix trends.
Key takeaways from the report include:
- Occupancy continued to hold in a narrow range, as it has over the past several months. Overall occupancy ended the fourth quarter of 2018 at 82.4%, which was virtually unchanged from the third quarter and down 35 basis points from 82.8% in the fourth quarter of 2017. It has been hovering around 82.5% since April 2018. The fourth quarter occupancy trend varied by geographic area, with urban areas experiencing an increase, while occupancy in rural and urban cluster areas declined from the third to the fourth quarter of 2018. The occupancy rate ended 2018 at 80.4% in rural areas and at 83.7% in urban areas, representing a significant difference of 330 basis points.
- Managed Medicare revenue per patient day (RPPD) increased in the fourth quarter of 2018, albeit slightly, ending the year at $430. Any ease in pressure on managed Medicare RPPD would be a positive for skilled nursing operators, as the last few years have seen a continued downward trend. The managed Medicare RPPD has decreased from $495 in January of 2012 to $430 as of December 2018. There has not been a quarterly increase in managed Medicare RPPD since the fourth quarter of 2016 when the RPPD was at $449. However, RPPD is down 1.7% compared to a year ago in December of 2017 when managed Medicare RPPD was at $437. Managed Medicare RPPD trends varied by geography, as rural areas saw a decrease and urban areas represented a slight increase; urban cluster areas increased as well.
- Private RPPD was relatively flat from the third quarter to the fourth quarter of 2018. It has continued to be range bound over the past few months but has declined since February 2018. This is notable because it has steadily increased over the past few years. However, the latest data suggest there has been a slowdown since last year. Whereas the private RPPD did grow at 1.7% compared to a year ago in December of 2017, it has been hovering around the $262 range for several months. Private RPPD decreased the most in rural areas representing a quarterly decrease of 1%. It was relatively steady in both urban and urban cluster areas. Meanwhile, patient day mix continued to hold steady as it has the last several months.
- Skilled mix held steady in the fourth quarter 2018 at 24.8%, which is somewhat common from a seasonal perspective when comparing the third to fourth quarters. The data usually shows a flat to slight increase from the third to fourth quarters. The quarterly change was driven by an increase in Medicare patient day mix and a decrease in managed Medicare mix. However, compared to December 2017, skilled mix decreased 56 basis points as the pressure on skilled mix persists. The continued pressure over the years has been mainly due to the decline of Medicare patient day mix, which was down 110 basis points from a year ago. Managed Medicare patient day mix was up 28 basis points compared to a year ago. The decline in skilled mix over the past year was most pronounced in urban areas, as rural areas saw a slight increase.
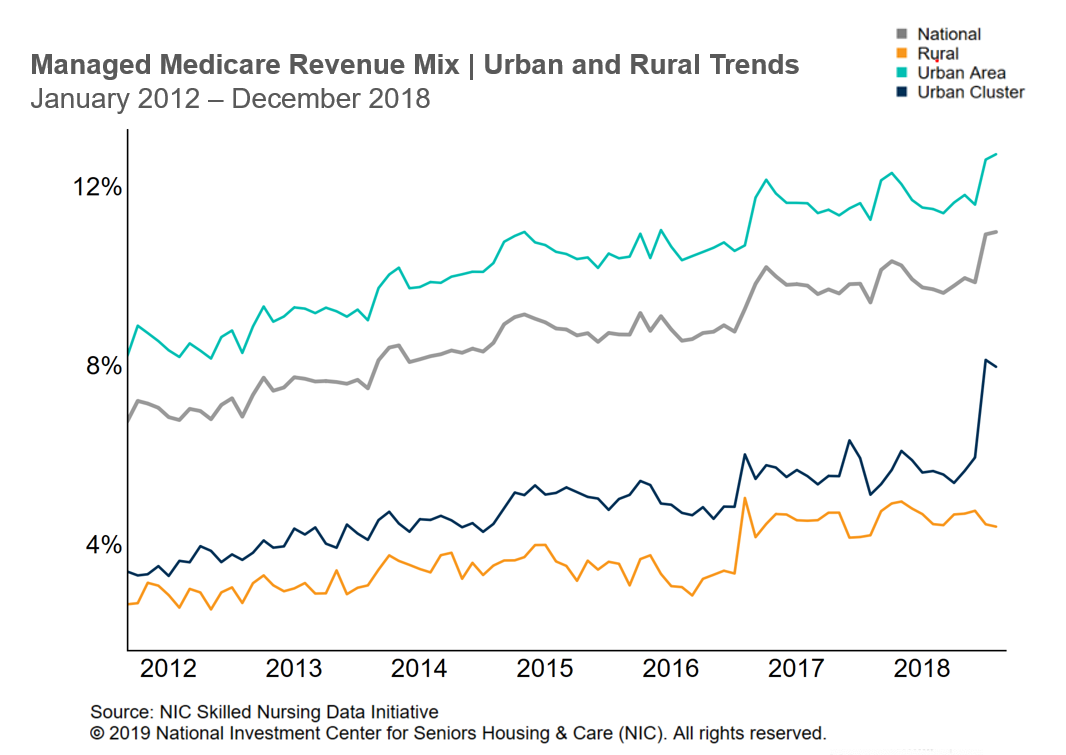
- Managed Medicare revenue mix was the only main payer type that increased from third quarter 2018 and is now at 11% overall. This highlights the importance of continuing to follow the trends of managed Medicare for operators and investors. Compared to one year ago, Medicaid and managed Medicare revenue mix increased, while Private and Medicare decreased.
To get more trends from the latest data, you can download the NIC Skilled Nursing Data Report here. There is no charge for this report.
The report provides aggregate data at the national level from a sampling of skilled nursing operators with multiple properties in the United States. NIC continues to grow its database of participating operators in order to provide in the future data at localized levels. Operators who are interested in participating can complete a participation form here. NIC maintains strict confidentiality of all data it receives.

NIC MAP Includes Walk Score®
 Last October, NIC MAP® added Walk Score® as a way to dig deeper into a market’s unique attributes by looking at property-level “walkability” measures. As part of NIC’s mission to promote data transparency in seniors housing and care, NIC identified neighborhood walkability as another helpful factor in analyzing properties in response to increasing numbers of capital providers, developers, and operators becoming interested in providing seniors housing in high-density areas.
Walk Score, a company owned by Redfin, has a mission to promote walkable neighborhoods with aims of improving population health, the environment, and the economy. Walk Score data is widely used by analysts, urban planners, public health researchers, commercial and residential real estate companies, consumers of all ages, and seniors and their families evaluating senior living options.
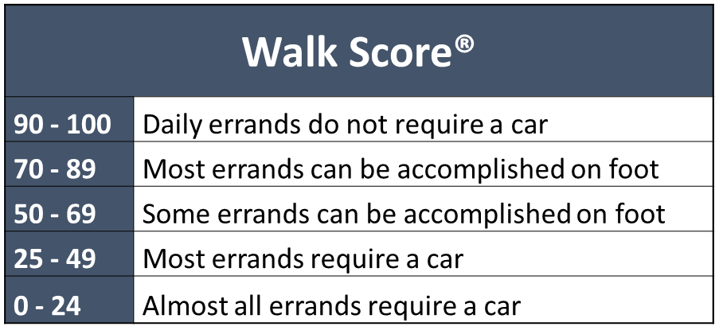 A Walk Score is a measure of neighborhood pedestrian friendliness, ranging from 0 to 100. Walk Score methodology analyzes walking routes to nearby amenities and services, and points are given based on distance. Higher points indicate greater walkability and addresses with amenities located within a five-minute walk garner the most points.
What Does the Research Say?
More and more research studies, as well as the press, suggest living in walkable neighborhoods is good for an individual’s physical, mental, and social health, and walkability may have economic benefits for seniors housing real estate investors and developers.
- A Brookings Institution white paper, citing an economic analysis of a sample of neighborhoods in the Washington, D.C. metropolitan area using walkability measures, found that highly walkable neighborhoods perform better economically, suggesting that capital providers and lenders should incorporate walkability into underwriting standards, and developers and investors should consider walkability when assessing or acquiring property.
- Senior Housing News noted that neighborhood walkability may be an important feature for future senior living communities looking to align the product with the lifestyle desires of the next generation of senior consumers.
- The AARP’s 2011 Boomer Housing Survey found that 60% of people age 50 and older want to live within a mile of daily goods and services.
- The New York Times stated the future of retirement living is “walkable and urban” because more older adults want to live in a community where they can retire without a car.
Why is Walk Score Important?
For growing numbers of operators, developers and investors, location walkability of seniors housing properties is gaining importance for several reasons:
- Surveys suggest that seniors housing residents are more engaged in health and wellness activities, and in their communities, than prior generations.
- Transportation mobility and access to nearby goods, services, and amenities are attractive features in senior living not only for the senior consumer and their family members but also for operators that must fund, staff, and provide on-demand transportation to their residents. Walk Scores can provide input for seniors housing operators planning transportation resources and provide input for seniors housing developers planning robust on-site wellness amenities or adding walking paths or trails to an existing property.
- Although more research with seniors housing providers needs to be conducted, seniors housing developments with higher Walk Scores could potentially experience faster lease-ups and maintain stronger occupancy rates.
- Seniors housing properties situated in areas with easy foot traffic access and proximity to public transportation may better attract and retain a dedicated senior living workforce than properties in car-dependent locations.
Average Walk Scores in the 31 Primary Markets
![]() As of 4Q2018, the metropolitan markets within NIC MAP’s 31 Primary Markets with the highest Walk Scores are located on the West Coast. Interestingly, most of the nursing care property average Walk Scores by market were higher than those for assisted living (26 of 31) and independent living (19 of 31). About half of the independent living property average Walk Scores by metropolitan market were higher than those for assisted living (16 of 31).
As of 4Q2018, the metropolitan markets within NIC MAP’s 31 Primary Markets with the highest Walk Scores are located on the West Coast. Interestingly, most of the nursing care property average Walk Scores by market were higher than those for assisted living (26 of 31) and independent living (19 of 31). About half of the independent living property average Walk Scores by metropolitan market were higher than those for assisted living (16 of 31).
The average Walk Scores across the 31 Primary Markets as of 4Q2018 for independent living and assisted living properties was 43, and for nursing care properties, the average was slightly higher at 47—placing all three property types in the generally “car dependent” category.
Seniors housing has historically been developed in suburban or exurban areas due to greater land availability, cheaper cost of land, and ease of entitlement. However, as more urban and infill development opportunities gain traction among seniors housing investors and developers, it will be interesting to track Walk Scores within the NIC MAP database.
It is important to note the Walk Scores shown in the table on the right are the averages for entire metropolitan markets, and individual properties located within each market will have greater or lesser Walk Scores depending on property-specific neighborhood amenities and services.
Accessing Walk Scores in NIC MAP
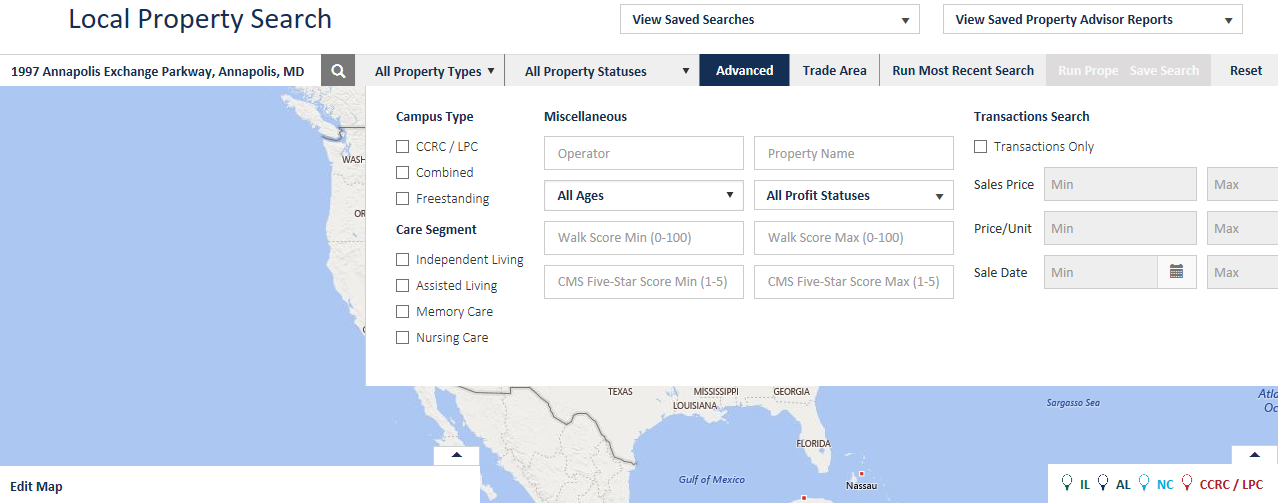
Walk Scores can be accessed in NIC MAP Local Property Search in the pop-up windows by hovering over a property on the map, by viewing the property listing along the side, and in the exported inventory file. Additionally, NIC MAP includes an advanced search feature for users to enter a Walk Score minimum and maximum “walkability range” to view selected properties. Shown below is a screenshot of this advanced search feature in NIC MAP Local Property Search.
With a share of current and future seniors housing residents preferring to live in walkable neighborhoods, and recent research pointing not only toward the health benefits of walkability for individuals but also the potential economic benefits for real estate investors and developers, integrating Walk Scores into NIC MAP provides additional input to assess development locations and property acquisitions. NIC is pleased to offer Walk Scores to our NIC MAP data subscribers as an additional tool for analysts, capital providers, developers, and operators who wish to understand seniors housing property-level neighborhood walkability metrics and explore new ways for segmenting markets.

Boot Camp: A Day to Remember
The 2019 NIC Seniors Housing Boot Camp sold out within a few days, generating a wait-list that would fill the event twice over. Developed in large part by NIC’s Future Leaders Council (FLC), and held in Charlotte, North Carolina, the day-long event, titled “An Interactive Workshop on Assessing the Art of a Deal” was packed with practical, no-nonsense insights, and discussion on assessing seniors housing investment opportunities.
Real-world, detail-oriented presentations were given by a range of industry players, each bringing their perspective on the sector while sharing the best practices and professional insights earned over years of working experience. Attendees, most of whom have been in the industry, or in a new role, for one to three years, were rewarded with a holistic view of the sector, expert analysis of its trends, a deeper understanding of the market, and a straight-to-the-point approach to understanding what drives the industry today—and what will be impacting it tomorrow.
Developers, investors, equity providers, lenders, debt providers, transactional service providers, and financial intermediaries were distributed across a handful of small working groups. NIC planners seated each group, ensuring that a broad array of experience and knowledge was accessible to each group. FLC members Elyse Hanson (Blue Moon), Andrew Lavinder (MidCap Financial), Sarah Veit (Omega Healthcare), Brandi Healey (Sabra Health Care REIT), and Dana Scheppmann (Capital One) acted as table captains for their respective groups. The day was emcee’d by FLC member Fritz Kieckhefer (CIBC).
Anchored by a lunchtime keynote presentation given by John Moore, chairman and CEO of Atria Senior Living, the day yielded many deep dives into a wide range of issues facing anyone in the business of assessing seniors housing investment opportunities. The schedule moved briskly through nine presentations in all, each with a question and answer component, as well as table discussions, and a valuation review and group discussion to end the day’s program.
Starting with an industry overview, featuring the latest NIC MAP® data, presented by NIC senior principal, Lana Peck, the day’s sessions included:
Case Highlights & Investment Guidance, presented by Ryan Chase, managing director, Blueprint Healthcare Real Estate Advisors
Investment Assessment, presented by Jerry Taylor, executive vice president, Strategy and Operations, Solera Senior Living
Market Assessment: Assessing Supply & Demand, presented by Susannah Myerson, vice president, Wells Fargo
Sales & Marketing, presented by Melissa Owens, vice president of Marketing, Eclipse Senior Living
Operational Strategy, Care & Staffing, presented by Jay Leo, president, The Springs Living®
Capitalizing the Deal, a panel discussion featuring Kate Nicholls, director of investments, Ventas, Peter Trazzera, vice president, Key Bank Real Estate Capital, and Dustin Warner, director, Harrison Street
Valuation Model & Interactive Discussion, presented by Richard Wang, vice president, Investments & Strategy, Belmont Village Senior Living
Moore’s presentation featured his analysis of demographic trends, looking back to the 1980s and ahead to the impact of aging baby boomers, all the way to 2050. By looking back at important demographic and market shifts, Moore was able to illustrate the potential impact of the coming “age wave” of baby boomers, who will begin to enter the sector “in large numbers in the early–to mid–2020s”
He also discussed opportunities in gateway cities, a potential resurgence of adult day services, and the market for more affordable senior housing, before delving into a detailed analysis of supply and demand, both of which he expects to grow over time. He concluded with short- and long-term factors for attendees to consider as they think about business decisions going forward. There was time after his presentation for Moore to answer a number of questions from Boot Camp attendees.
Setting the stage for the afternoon’s highly interactive case study exercise, Richard Wang presented the valuation model each group would be asked to use while calculating their offer on a senior living property located in nearby Raleigh, North Carolina. The case study, which was handed to every attendee, included many of the pertinent details they must look at when considering a potential investment—and preparing to make a bid on a property. The model provided a framework for calculating many of the valuation and investment factors that should be weighed before arriving at a strategy and an offer.
The case study offered the “Emerald Vista” senior living community, with three clearly defined investment initiatives: 1. increase low assisted living utilization by completing a renovation; 2. convert vacant two-bedroom units to studio and one-bedroom units; 3. convert a portion of the community to memory care. An executive summary provided each group with an investment overview, paths to upside (for each option), a property description, and a market overview, as well as questions to consider after reviewing the case.
After having some time to discuss the case study and develop an investment strategy, each group arrived at an offer. Kieckhefer then asked a representative from each group to walk through the group’s thought process and present their offer. Groups diverged considerably in their strategies, yielding a range of offers on the community, and a variety of justifications. In a collegial atmosphere, there was a discussion of each group’s views and calculations, providing for some useful insights on how different organizations—and individuals—view the same opportunity in different ways.
Finally, it was revealed that the case study was pulled directly from a real transaction that occurred a few years earlier. Boot Camp attendees learned about the real-world deal and how it was executed, and how it is performing today. In the context of the case study exercise, the revelation of the transaction’s facts provided another level of insight into how to assess an investment opportunity in seniors housing and care.
With the case study completed, attendees enjoyed a roof-top reception hour, where they had an opportunity to network with each other, the FLC, and representatives from NIC. While it was a long day, it seemed to be over too soon. As one attendee, overheard at the reception, exclaimed, “This was so good, I hope I can come again next year!”

FLC Alumni Spotlight – NIC FLC’s 10-year Anniversary

At the upcoming 2019 NIC Fall Conference, September 11–13 in Chicago, the NIC Future Leaders Council (FLC) will celebrate the 10-year anniversary of the founding of the FLC in 2009 with its inaugural first class of 2012. In this article, Tony Hong, vice president, Investments and Acquisitions, Clearwater Living, and Lucas McCurdy, owner, The Bridge Group Construction, interviewed Paul Mullin of the FLC’s class of 2014 and senior vice president of Development at Silverado, to talk about the importance of the FLC and the influence it had on him.
McCurdy: How has your involvement with the FLC impacted your life and career?
Mullin: It’s been incredibly meaningful and very powerful. I work to focus my energies on my strengths, which are, from StrengthsFinder, the WOO—winning others over—and really creating solid relationships and the Speed of Trust. I really believe in the Speed of Trust and relationships to get anything done, particularly given the really tough business of real estate. You’ve got to have a good relationship.
The FLC really engenders trust, and just the fact that people very quickly get to know each other and very quickly get to trust each other. With trust comes relationships that allow for business to happen. That’s obviously one of the most meaningful things. I think the commonality that we all share is the mission and purpose of making seniors lives better on a day to day basis, creating new product, creating new services, new opportunities, and to move the needle on the way seniors are taken care of. That common bond really helps build that Speed of Trust. That’s probably one of the most meaningful things that I can think of.
McCurdy: To what parts of the FLC did you contribute while you were a member?
Mullin: I immediately got involved with the university outreach. The other initiative that hasn’t taken as much root, but I think has to, is coming up with a meaningful accounting for CapEx, capital improvement, and capital expense. Billy Petit and I set about trying to create accounts for capital expenses, and we unveiled it at a NIC. It wasn’t something that others really wanted to dive into. I think most are still comfortable in the way of CapEx with a metric of $500 per unit, depending on how they look at it for a community.
Some of our biggest exposure not only as operators but also as financial intermediaries, particularly on the REIT side, is CapEx. It is the one variable that can really make or break an earnings column. So, Billy and I wanted to shed some light on that. Our belief and my belief still today is that $500 does no justice to a 10 to 20 year old community. For a new community which got built in the last 5 years, that maybe sounds about right. But we started to come up with accounting that looked more like $1,500 in the case of memory care, because you have that much more exposure to a really tough environment to keep furniture and finish looking like day one. That was a real interesting initiative.
There is a whole entrepreneurial spirit that has incubated at NIC, so that’s probably the moral of where I’m going here. While not all initiatives took off, like the CapEx initiative, they definitely will resurface and once again get the entrepreneurial thinking going among some really bright people. I’m certain some people will take that information and create their own products. Billy and I will be coming out with CapEx finders soon. I currently can’t tell you more than that.
 McCurdy: What is your advice to the current FLC members?
Mullin: My admonition or advice to the newest members of the new FLC is get out there. Get out to the universities. Get out to other communities, other businesses. Get engaged in your community locally, and make sure that senior housing or senior living is part of what we’re all pitching to the greater public.
We always talk about our “Got Milk” campaign for senior living, and I think Brookdale did somewhat of a good job of producing a commercial around that. How do we all do that? How do we all get out and get the word out on things like cognition and enhancement? This business isn’t just about caring, it’s about improving people’s cognition that have memory loss.
How do we get out and talk to people about this? Where, after you retire, you find a whole new group of friends in senior living and you’re no longer sitting in front of your TV or just depressed at home. Depression kills seniors. How do we really uncover what is an exciting lifestyle for seniors, and move our penetration from 6 to 10 percent to more like 50 percent of the senior population?
That would be my challenge. What are your ideas to do that if you’re running the FLC? What’s the big idea to make what is obvious about senior living for all of us more obvious to the greater population?