Cost Effective Debt Solutions in a Challenging Market: A Conversation with MidCap Financial’s Lawrence Brin
 What do borrowers need when capital markets are challenged? Experience and a dose of creativity, according to Lawrence Brin, managing director, head of healthcare real estate, MidCap Financial Services. The firm’s highly skilled finance teams can tailor solutions to meet the borrower’s needs in a difficult environment.
NIC Chief Economist Beth Mace recently spoke with Brin about MidCap’s customized approach and the growing need for alternative capital as other sources press pause. What follows is a recap of their conversation.
Mace: Please tell us about MidCap Financial and your role as head of the Healthcare Real Estate practice?
Brin: MidCap Financial is a middle market focused specialty finance firm that provides senior debt solutions to companies across multiple industries. We are diversified across seven product lines to maximize risk adjusted returns as markets change. Our products include real estate lending; asset-based lending; leveraged lending; lender finance; life sciences and technology lending; franchise finance; and climate and energy transition finance. This diversified model benefits MidCap Financial as markets shift. For example, asset-based lending will typically grow as the leveraged lending market contracts.
I joined MidCap Financial at its inception, when we were a specialty finance firm focused solely on healthcare. While the platform has since diversified into secular asset classes, we retain our expertise in the healthcare markets and our appreciation for the sector.
I lead MidCap Financial’s healthcare real estate business, with a focus on lending to senior housing, medical office, life sciences and skilled nursing properties. On the business development side, I set the strategy for the business, oversee our team efforts, including assessing prospective transactions for our portfolio and advocating for those transactions with our credit committee.
MidCap Financial is a credit focused lender, and I also work closely with our underwriting team during the underwriting and closing processes. We also are a relationship lender and service everything in house. So, I interface with our portfolio management team as they manage credits.
Mace: What does it mean to be a middle market-focused specialty finance firm that provides cost effective debt solutions. Middle market in this context is not middle-income seniors or what NIC calls the “Forgotten Middle.” What does middle market-focused mean? Who are your clients?
Brin: While the terminology is similar, our focus is different. Middle-market lenders traditionally focus on businesses with annual revenue between $10 million and $1 billion. That definition pertains mostly to our enterprise finance businesses, such as sponsor & leveraged finance; asset-based lending; and lender finance.
Our real estate lending is focused on the value per asset, typically below $100 million. It’s very uncommon for MidCap Financial to pursue a loan above $60 million for a single asset.
Our clients range from prominent institutional investors in the senior housing space to seasoned operators we have known for years to smaller entrepreneurial groups.
We are a balance sheet lender, and our business is focused on our lending portfolio as opposed to a business that uses its balance sheet to drive agency lending business.
Mace: As of September 2022, MidCap managed or serviced $43.6 billion of commitments. How much of your business practice focuses on senior housing?
Brin: MidCap Financial’s healthcare real estate business has always focused very heavily on senior housing, and it is our largest asset class within our real estate portfolio. We believe in the senior housing sector and remain committed to it. We are actively focused on senior housing transactions nationwide.
Mace: Tell me about MidCap’s lending profile. What do you look for in prospective clients? Do you provide debt capital for acquisitions, development, and refinancing opportunities? What can MidCap do that traditional lenders such as banks cannot do? Where does MidCap stand in the capital stack?
Brin: MidCap Financial looks for experienced investors and operators with achievable business plans and equity alignment. We provide capital for acquisitions and refinancing opportunities. We don’t provide standalone ground-up construction financing. As a non-bank lender, we can provide borrowers with bespoke solutions, more flexible terms, and greater certainty.
Our focus always has been and will continue to be on senior debt. We are not an equity investor and rarely consider standalone subordinate debt, but we will consider senior stretch debt for the right situations.
MidCap Financial is different than some other alternative capital that frequently goes very deep into the capital stack. We are very selective and focus on alignment. We are not fee driven. We believe our value proposition is driven by our acumen, credit selection, and execution.
Mace: Where do your funds originate?
Brin: MidCap Financial has a permanent equity capital base that we leverage in various ways across our different business lines. We then have various debt vehicles for each of our business lines that we have raised since 2008. I appreciate your question because it touches on an important distinction in the real estate space: MidCap Financial is unique as a non-bank real estate lender because we are not a debt fund. Our capital does not have a discrete investment horizon with an expected redemption date. We are also less vulnerable to capital market swings because we hold our real estate loans on the balance sheet rather than in repurchase facilities or securitizations.
Mace: What is MidCap’s relationship with Apollo Global Management?
Brin: MidCap Financial is Apollo’s primary direct origination platform in the private middle market credit arena. We are an integral part of Apollo’s credit strategy, which is Apollo’s largest business unit.
Apollo, via its managed funds, is an investor in and capital partner to MidCap Financial. Apollo has also helped MidCap Financial to raise equity capital from third party institutional investors. MidCap Financial and Apollo have an investment management arrangement which provides strong synergies.
Apollo is one of the world’s leading investment managers with approximately $523 billion of assets under management. The firm provides market leading industry expertise, market reach, and financing.
Mace: The debt markets have been very challenged since March 2022 as the Federal Reserve has shifted into a very restrictive monetary policy stance and raised the fed funds interest rate six times from a level of near-zero to a range of 3.75% to 4.50%. How has this affected your business and ability to provide debt to your client base and prospective clients?
Brin: First and foremost, the biggest impact of rising rates has been on those clients and prospective clients trying to determine whether a transaction makes sense. If they do not have to execute, the best course of action may be to hold off, and I think that’s played out over the past few months.
For those groups that have to transact, due to a performance issue, debt maturity, or other situations, the ability to deliver a potential solution may be tied to a number of factors such as the quality and vintage of the property, the health of the local market, prospects for improvement and the timing of that improvement, and the strength and alignment of both the owner and operator. All of these factors that present themselves in any given situation collectively affect our appetite and ability to provide a debt solution.
It also warrants saying that the market is extremely fluid, and market perspectives among all participants continue to shift. Our posture is impacted by observations across all of our business lines regarding market changes, investment performance, and financial fluctuations.
Mace: Has MidCap been able to continue to provide debt financing? If so, what’s changed?
Brin: MidCap Financial has been able to continue to lend in this challenging market. We believe we have filled a void in the capital markets given the lack of liquidity.
We recently closed a loan on a six-property portfolio in Florida with a joint venture between Heitman and NexCore Companies. Our strategy has been measured, and we’ve been disciplined about the transactions we’ve pursued. We’ve been selective about asset vintage, market, and operator. We have also emphasized the importance of sponsorship.
Mace: One of your taglines is “Meeting opportunity with creative debt capital to support every need.” What are some of the creative debt solutions you have been able to offer in 2022?
Brin: As a business, we pride ourselves on being knowledgeable about the healthcare real estate sector. We believe that by being a sophisticated capital partner, we can tailor our terms to enhance our borrowers’ execution, and we can make sense of challenges that might hinder more conventional lenders.
Our creativity can be a real differentiator, but only to the extent that a borrower sees value in it. In today’s market, much of our creative structuring has focused on anticipated volatility in operating performance as borrowers execute their business plans. We have devised structures to provide the time and flexibility borrowers need to execute while mitigating risks.
We have also demonstrated creativity managing interest rate risk in a way that maintains alignment with owners while avoiding being unduly onerous. We have been regularly creative in working with our clients regarding hedging strategies given the financial burden imposed under certain structures.
Mace: How are the owner/operators (your borrowers) in your portfolio being impacted by rising interest rates? Is debt service coverage an issue for MidCap’s borrowers?
Brin: Debt service is a concern for all borrowers in this environment. Base rates have increased from 50 bps to 450 bps over the course of 2022—in many cases that has caused borrowers’ stream rates to more than double. The logical consequence of that increase is tighter debt service coverage for income producing properties and higher cash burn for non-income producing properties.
MidCap Financial can be pragmatic about that impact and focus on constructive ways to address interest rate shortfalls, such as replenishment structures, as opposed to interest reserves sized to the worst-case scenario. We can also recognize the inherent consequence of the math and the impact to debt service coverage ratio tests. The impact is more challenging to banks that are subject to regulatory scrutiny.
Mace: Do you expect to see more distressed properties in 2023? Would MidCap step in to provide debt capital in that situation?
Brin: We anticipate that the increased interest rate burden will cause more distress. We may be able to help in some situations for opportunistic acquisitions and refinancings. But everything is case specific.
Mace: How do you see the interest rate environment in 2023? How does this affect your outlook for being able to offer debt to senior housing businesses?
Brin: At the short end of the curve, the Federal Reserve’s recent commentary implies another two to three 25 bps rate increases during 2023 followed by only a gradual decrease by the end of 2024.
At the longer end of the curve, the consensus expectation seems to be that the 10- year treasury note will hover around 4% in 2023 and settle in around 3% by the end of 2024. So, our expectation is that the interest rate environment will remain challenging in 2023. MidCap Financial will do our best to work through that with our clients in our portfolio. We also anticipate that the challenging environment will continue to impact banks, life companies, CMBS, CLOs, and agencies. As such, it will create even more need for creative alternative capital in the market. We are optimistic that we will be able to continue to fill that need.
Mace: Is there anything else you would like to add?
Brin: I would like to express my appreciation for being asked to participate with you in this discussion. I am personally gratified to have the opportunity to be engaged with NIC, and MidCap Financial values our affiliation at an organizational level.
These are heady times in the capital markets and for our sector in particular, and NIC is performing a vital role in helping the stakeholders make sense out of the various stages of the post pandemic landscape.

Value-Based Care: What It Is and Why It Matters: A Conversation with Andre Maksimow, Senior Vice President, Kaufman Hall
 Andre Maksimow understands industry trends. With over 25 years of experience, including mergers and acquisitions, private equity, finance, and operations, Andre provides strategic financial advisory services focused on hospitals and other healthcare providers. Combined with his expertise in post-acute care sectors such as home health and hospice organizations, skilled nursing, inpatient rehabilitation, and continuing care retirement communities (CCRCs) or life plan communities, Andre has a tremendous knowledge base regarding current industry trends.
NIC Senior Principal Ryan Brooks recently interviewed Maksimow, Senior Vice President at Kaufman Hall, on the topic of value-based care. What follows is a recap of that conversation.
Brooks: We hear a lot about value-based care these days. To kick us off, can you tell our audience what value-based care means?
Maksimow: In essence, value-based healthcare means reimbursement for services based on delivering certain outcomes and cost targets, rather than being paid for the volume of healthcare services delivered. Value-based care can range from “upside only” arrangements where providers are paid more for meeting certain quality, outcome, and cost targets – with no downside risk – all the way to full capitation whereby a provider is responsible for all the costs of care for a patient (i.e., both “upside and downside risk”). When taking responsibility for a group of patients, this is known as population health. Population health involves managing the health outcomes and costs of a group of individuals.
Brooks: So why does value-based care matter? What are some of the primary trends going on right now in the U.S. that are leading us to think about value-based care and how it might help the situation?
Maksimow: Value-based healthcare matters because healthcare costs in the U.S. are unsustainable. The U.S. spends more per capita on healthcare than any other developed country, while healthcare outcomes are mediocre at best. Medicare is projected to run out of money by 2028. Employers cannot continue to endure medical inflationary pressures, and cost-shifting to employees has caused increasingly larger deductibles. Proliferation of value-based care will help stem the rising costs of healthcare by reducing unnecessary utilization and improving overall outcomes.
Brooks: It seems like most often value-based care is talked about in the context of hospitals and health systems, but does value-based care have a place in the senior housing sector as well?
Maksimow: Value-based care is most-often talked about in the context of health systems, but also with specialty primary care groups who focus on the Medicare population (like Oak Street Health, ChenMed, and others). These organizations all have access to large populations needed to take on capitation risk and have the necessary analytical infrastructure and aligned primary care physicians needed to succeed in value-based care. The challenges these organizations endure include engaging with patients and also controlling for social determinants of health (SDoH); often these patients do not have food security, social supports, or appropriate housing needed to support good health.
In the context of senior housing, value-based care (capitation) has a place in the sector, because unlike other patients in risk arrangements, it is much easier to engage with residents in a controlled environment where many elements of SDoH are already taken care of (such as food security, safe environment, transportation, social supports). The challenge for senior housing operators is to obtain the necessary level of scale (covered lives) to mitigate insurance risks in addition to building out the proper analytical infrastructure necessary to maintain the health of residents. Furthermore, an aligned, highly accessible primary care base of providers is necessary to monitor chronic conditions and provide preventative treatment before hospitalizations or emergency department (ED) visits become necessary.
Brooks: You just mentioned analytical infrastructure. How can data be used to make healthcare more efficient under value-based care?
Maksimow: To succeed in value-based care, you need to be able to categorize patients by their health risks and unmet needs. Health IT tools and data analytics are critical for providing this visibility. With the right digital tools, primary care practices will be able to stratify patients by risk, close gaps in care, and identify areas for performance improvement.
Brooks: What role do social determinants of health (SDoH) have in value-based care?
Maksimow: SDoH play a very large role in managing the health of a population. According to the Institute for Medicaid Innovation, socioeconomic and physical environmental factors that are directly linked to your local area account for 50% of overall health outcomes, with another 30% tied to health behaviors which can be affected by SDoH as well. Only 20% of total health outcomes are determined by access to quality healthcare services. What does this mean in practice? Depending on your zip code, you could be living in an area that lacks proper grocery stores for proper nutrition and is a “food desert.” Transportation may be impacted preventing access to medical appointments. By knowing SDoH for a particular patient, providers may be able to help access social services to help mitigate the impact negative determinants have on overall health.
Brooks: How does traditional Medicare differ from a Medicare Advantage program, and how are Medicare Advantage plans helping to deliver value-based senior care?
Maksimow: Medicare Advantage plans are partnering with providers by entering into capitation agreements whereby the provider receives a certain portion of the premium to cover all of a patient’s health care costs. By doing so, providers are incentivized to manage a patient’s care proactively, by providing preventative care and managing chronic conditions as best they can in order to avoid costly hospital admissions and ED visits. Further, providers are incentivized to take into consideration SDoH and coordinate social services where necessary.
Brooks: What about Accountable Care Organizations or ACOs? What is an ACO, and how does an ACO improve quality of care?
Maksimow: ACOs are groups of providers that contract with a payer to achieve the shared goals of improving outcomes and reducing unnecessary spending. ACOs can contract with many different types of payers, including Medicare, Medicare Advantage, Medicaid, and commercial insurance entities. An ACO may be composed of different types of providers (such as hospitals, specialists, and primary care practices) or a single type of provider (such as just primary care providers). If an ACO successfully meets its quality and spending targets, the practices in that ACO could receive a portion of the resulting shared savings, or the difference between what the payer expects to spend and what the payer actually spends on care for those attributed patients.
Many ACOs start with “upside only” risk models, meaning they receive a check for shared savings if they succeed, but are not required to return any money to the payer if they spend more on care delivery than expected. But accountable care organizations have other options as well. If an ACO is interested in potentially earning a larger proportion of any shared savings, it can accept downside risk, also known as two-sided risk. In a downside risk model, an ACO that meets its quality and spending benchmarks gets a higher percentage of the shared savings than it would in an upside only model. However, if the ACO spends more than the payer expects, the ACO is required to pay a percentage of those losses back to the payer. More risk, but more reward.
Brooks: You were involved with CCRCs, also known as life plan communities, for quite a few years previously. What do senior housing and care operators need to know about value-based care?
Maksimow: While building out the infrastructure and employing an aligned primary care base may be the ultimate goal in taking full capitation risks through owned I-SNPs (Institutional Special Needs Plans), there are numerous steps along the journey to achieve these results which can be financially dilutive in the short to medium term. Furthermore, senior housing operators likely lack the regional scale to spread the fixed costs necessary over a sufficient number of properties/lives to make this endeavor worthwhile. Instead, it may make more sense in the beginning stages to partner with a like-minded primary care group that has capitated insurance relationships to serve as dedicated physicians in your communities.
While the senior care operator does not capture the direct benefits from reducing health care utilization, residents benefit from enhanced on-site coordinated care leading to reduced hospitalizations and ED visits. Operators ultimately benefit from reduced time and labor coordinating care and transporting residents, in addition to the added marketing benefits of being able to offer highly accessible medical care within the community which is increasingly becoming a requirement for today’s senior housing operators.
Brooks: Has there been growth in the number of Medicare Advantage plans or the number of covered lives in MA plans over the last few years?
Maksimow: There has been consistent growth in Medicare Advantage enrollment across the U.S. over the past ten years. Whereas about 30% of all Medicare participants enrolled ten years ago, this number has grown to close to 45% in 2022. Medicare Advantage plans have done a great job providing additional benefits and value in one cohesive plan as compared to traditional Medicare.
Brooks: CMS has a number of value-based programs with the stated aims of better care for individuals, better health for populations, and lower cost. Can you talk to me a little bit about the different models that fall under value-based care?
Maksimow: The Medicare Shared Savings Program (MSSP) is the nation’s largest ACO program, covering more than 11 million people with Medicare and including more than 500,000 healthcare providers, according to CMS. Participation is voluntary.
A number of other value-based programs include:
- End-Stage Renal Disease Quality Incentive Program (ESRD QIP)
- Hospital Value-Based Purchasing (VBP) Program
- Hospital Readmission Reduction Program (HRRP)
- Value Modifier (VM) Program (also called the Physician Value-Based Modifier or PVBM)
- Hospital Acquired Conditions (HAC) Reduction Program
- Skilled Nursing Facility Value-Based Purchasing (SNFVBP)
- Home Health Value-Based Purchasing (HHVBP)
Each of the above programs is mandatory by CMS and involve certain outcomes providers need to achieve in order to receive additional reimbursement.
Brooks: What is the future of value-based care and healthcare payment models?
Maksimow: Value-based care will continue to proliferate, and providers will develop new care delivery models to succeed in this reimbursement environment. Ultimately, value-based care will continue to evolve closer to full capitation whereby providers are responsible for the total cost of care in order to fully align incentives.
Brooks: Is there anything else you’d like our audience to know?
Maksimow: Moving from a fee-for-service to a value-based care system will take time, and the transition has proved more difficult than expected. As the healthcare landscape continues to evolve and providers increase their adoption of value-based care models, they may see short-term financial hits before longer-term costs decline. However, the transition from fee-for-service to fee-for-value has been embraced as a leading method for lowering healthcare costs while increasing quality care and helping people lead healthier lives.
Are you attending the 2023 NIC Spring Conference and looking to learn more about value-based care? Be sure to attend the hands-on ‘How to Take Your First Steps in Value-Based Care’ Innovation Lab where you and other attendees will identify the initial steps needed to build partnerships between housing and value-based care operators. The Innovation Lab session will take place on March 2, 2023, from 1:00-2:00 PM PT.
Paving a Path Forward for Housing & Healthcare Integration
Health and wellness need to be top of mind for those of us who provide housing and care to older adults especially as baby boomers continue to age and will demand innovative, customized solutions for how they want to live. But what does it mean to prioritize seniors’ health and wellness? Being thoughtful about integrating healthcare services into the senior living experience is key. This is already happening, but there is more investors, owners, and operators can do to seize the moment.
Healthcare for older adults is rapidly migrating out of hospitals and even some ambulatory settings and into the different places that seniors call home. This evolving healthcare experience is centered around providing residents with the services they need, right where they live, to promote overall health and well-being. This improves residents’ quality of life by increasing their comfort and convenience. A focus on health and wellness may also prevent costly hospital admissions and readmissions, offering owners and operators opportunities to reduce spending while improving health.
Success in the future requires the senior housing community to get health and wellness right, and getting it right means fruitful partnerships to support housing and healthcare integration. We’re excited to dive into how senior housing and healthcare leaders are “Partnering for the Future”—this year’s conference theme—to provide better outcomes for older adults at our upcoming 2023 NIC Spring Conference, happening March 1-3 in San Diego, California.

The Spring Conference will highlight the role of senior housing in healthcare, and how all stakeholders—from operators, to capital providers, to payers—can work together to improve the well-being of older adults. Ensure your organization is at the forefront of this important work by learning about the latest drivers of senior housing demand, new care models that bring value to older adults, and how to tap into efficiencies in healthcare to enhance the living experience for America’s older adults.
NIC has assembled a variety of program sessions to show attendees how the senior housing community can achieve the integration of healthcare and senior living. Over the course of 11 main stage sessions and five Innovation Lab workshops, participants will hear from senior housing operators, healthcare payers, equity providers, economists, and other thought leaders on a wide variety of issues affecting the transition to caring for people in home-based settings.
Here’s what’s in store for the upcoming can’t-miss Spring Conference.
The “Wellness Revolution:” Defining and Advancing Senior Care
Our day one sessions will set the stage for how we define wellness as we transition toward in-home care services, how wellness is measured, and what it means for the new operating environment for senior housing. This session will serve as a foundation for the rest of the conference and help participants understand the relationship between healthcare and senior housing.
Day one also provides ample opportunity to network with other attendees and start building relationships that will lead to strong partnerships in the future. We’ll be hosting our first of five Innovation Labs held during the conference, a set of interactive “how-to” workshops where participants can work in smaller breakout groups to learn and discuss firsthand the challenges and opportunities in healthcare and senior housing integration.
Our first Innovation Lab workshop provides a boot camp style session where attendees can learn about Active Adult properties, what investors and operators can do to start an Active Adult property, and how to position them for specific markets and target demographics.
Opportunities in Housing, Healthcare, and Capital
Day two provides valuable insight into healthcare and housing integration. A look into valuations during a dynamic capital market will provide perspectives on the real-time state of valuations and long-term expectations of price changes, allowing operators to better understand current market realities and investors to learn considerations for underwriting to be successful in today’s environment. You’ll have to be in attendance to see what fun we have in store for this session!
You won’t want to miss the conference keynote session, offering a deep dive into trends across the healthcare and housing industries. Hear where overlap exists in improving the health of residents and creating exciting new opportunities for operators and capital providers.
Value Based Care Models
Payers and providers need access to senior housing and long-term care operators to achieve scale. This session will highlight three revenue generating value-based care partnership options in senior care. These three models—primary care groups, share savings with ACO’s, and development of special need plans—can not only create higher enrollment to spread risk and increase revenue for operators but reduce unnecessary hospitalizations.
Additional Programming Opportunities
Looking for an efficient way to connect with fellow conference attendees on topics in which you have a shared interest? That’s why we brought back braindates by popular demand.
Braindate™ gives you direct access to the collective genius of your fellow participants by facilitating the sharing of specific knowledge and experiences, leading to more authentic conversations and stronger partnerships.
The braindate platform for the 2023 NIC Spring Conference will open on Monday, January 23. You can post a braindate topic about something that you’re interested in discussing in the Topic Market and schedule a one-on-one or group braindate with other participants at the event based on the topics or platforms that interest you!
For how to create a braindate, visit our site. The braindate area will be open at the Spring Conference on Wednesday, March 1 from 9:00 AM-5:00 PM, and on Thursday, March 2 from 8:00 A.M. – 5:00 P.M.
Also happening at the Spring Conference is the NIC Senior Housing Boot Camp on Wednesday March 1. The NIC Senior Housing Boot Camp: The Art of Assessing a Deal is designed to provide professionals the opportunity to learn best practices in the art of deal assessment and market analysis from industry experts.

The one-day course will analyze real-world scenarios, data, and case-study details, provide an opportunity to collaborate with fellow attendees, and conclude with a competitive bidding exercise, based on an actual case study. Afterwards stay for a networking reception with industry thought leaders. Learn more and register for the Boot Camp by visiting our website.
With curated listening sessions, participatory small-group workshops, and NIC’s best-in-class networking opportunities, the Spring Conference allows attendees to connect with other healthcare and senior housing industry stakeholders, develop long-range strategic partnerships, and innovate new models of care and housing on behalf of older adults. NIC is excited to welcome you to the 2023 Spring Conference at the Marriott Marquis San Diego Marina in San Diego, CA.

How to Leverage Customer and Employee Feedback: A Conversation with Activated Insights CEO Jacquelyn Kung
 Jacquelyn Kung believes in building a brand from the inside out. What does that mean? As CEO of Activated Insights, Kung and her organization collect experience data from thousands of customers and employees which senior living providers can leverage to improve their offerings and brands.
Activated Insights spreads the word by partnering with well recognized organizations such as Great Place to Work, U.S. News & World Report, and Fortune magazine.
NIC Chief Economist Beth Mace recently talked to Kung about her company’s solutions and the power of customer and employee feedback. Here is a recap of their conversation.
Mace: Can you tell our readership about Activated Insights as well as your role as CEO?
Kung: Activated Insights is the biggest technology company collecting experience data in the industry. We work with over 6,000 communities and centers. What that means is that we conduct resident and employee surveys. As many of the NIC readership may know, we work with nine of the 10 largest operators in the industry. We work with these senior care providers to collect feedback from employees and residents to build their brands from the inside out, through partners such as U.S. News, Great Place to Work, and Fortune.
Mace: Let’s first dig deeper into the employee surveys. How many organizations, properties, and employees participate? How are they selected? How frequently are the surveys taken?
Kung: On the employee side, we survey over 4,000 properties annually and about 250,000 unique employees. The instrument we use is the Trust Index Survey from Great Place to Work, the global authority on workplace culture. About 100 million people around the world have taken this exact same survey of 60 questions. In our industry, 250,000 employees take the Trust Index Survey every year. Many senior care employers also take pulse surveys of their workforce throughout the year. Some employers survey their employees every month.
Mace: How did Activated Insights get involved with Great Place to Work?
Kung: The workforce has been an issue since I started in this industry in 1992 as a volunteer and then as a skilled nursing caregiver. Before Activated Insights, many senior housing providers had approached Great Place to Work to try to get certified as an employer of choice. But 85% of our workforce does not have work email addresses. So, it was hard to survey employees. Activated Insights contacted Great Place to Work. As a mission-driven organization, they saw that senior living providers had tried to apply and could not get certified because of low participation. So, Great Place to Work gave us the exclusive rights to survey senior living providers using their methodology which has been studied for 30-plus years. Activated Insights is the only employee engagement organization that can use this methodology for our industry.
Mace: How do you get the staff to participate?
Kung: The survey is mobile-friendly. In senior housing and skilled care, employees usually have a 20-minute stand-up meeting. Oftentimes, employees take the survey during the last half of the stand-up meeting on their cell phones. We need 55% or more participation to achieve statistical validity. Many organizations get over 80% participation. That way, it’s not just a small number of people influencing the feedback. It’s really important to hear the voice of your employees.
Mace: How do you get more operators to participate?
Kung: Operators see their competitors participating, and they want to get a baseline to know what areas they need to work on. Many operators do well on the survey even though they think they won’t. The data suggests it’s usually because employees love working with residents and have a lot of purpose and camaraderie at work.
Mace: Can you explain the Trust Index Survey?
Kung: The Trust Index Survey includes 60 questions proprietary to Great Place to Work methodology. All the research has shown that employees everywhere want the same things. These are the 5 components of employee trust: credibility, respect, fairness, pride, and camaraderie. Credibility is that management knows what they’re doing and communicates their organization’s goals. Respect means employees feel they are treated fairly in regard to gender, pay, ethnicity, age and sexual orientation. And lastly, workers have pride in the organization and in what they do, and get along with others. Three decades of research shows that when you have high employee trust, workers feel free to try new things. That’s where innovation comes from and why the Trust Index survey data ties to profitability and revenue growth. For example, the grocery chain Wegmans is a Great Place to Work. One story from a few years ago is that an employee who did cooking demonstrations created and served cauliflower rice. Sales of this stagnant category took off. She knew she wouldn’t get fired for trying something new.
Mace: Have the questions in the Trust Index Survey been consistent over the entire 30 years?
Kung: Researchers have gone back and forth and reduced the number of questions from time to time. But now all researchers insist on the original 60 questions.
Mace: What are some of the key findings from these surveys?
Kung: Senior living and skilled care do the best on pride, because of the purpose of the work, and camaraderie. The lowest categories for the industry are fairness and respect. We have a lot of data to show that.
Mace: How can senior housing improve its ratings on fairness and respect?
Kung: It usually takes CEO commitment. The CEO needs to be involved and set measurable goals which need to be reviewed regularly and pulse checked to make improvements. That’s when you see improvements. Organizations that promote from within do much better too. Our industry promotes 15% of employees from within. Hotels and restaurants promote about 30-40% of workers from within, about the same level as the top providers in senior living. It sounds easy; however, you need resources and processes in place to grow people from within and good data systems to track who is being promoted from within.
Mace: In 2022, U.S. News & World Report published its first ever “Best Senior Living” ratings. Can you tell us about your partnership with U.S. News & World Report?
Kung: A lot of people know U.S. News & World Report from college rankings. One area that is even more popular is healthcare – such as Best Hospitals. The rankings are most popular in areas where there is not much consumer transparency, and it’s hard to find independent third-party data on quality. U.S. News & World Report had been interested in senior care for a long time, and so we discussed an alliance over the spring and summer of 2021. We felt our goals were aligned and it would be a good way for top providers to differentiate themselves. This is year two of the program, and we just completed surveys on about 1 million people from over 4,300 communities.
The U.S. News & World Report survey is not a ranking, but a rating of the best senior living operators. The best-rated operators have a badge on their profile page. Activated Insights does not make money collecting the data. We offer subscription packages to operators to use data analytics with their internal information to make operational decisions.
The mission is to get information to consumers as a decision support tool. When people are searching online for the best senior living, the top-rated communities by U.S. News & World Report come up on the first page of a Google search. Consumers click on it because U.S. News & World Report is a brand they know.
Mace: What is the effect of being selected as a “Best Place to Work” or being part of the “Best Senior Living” list?
Kung: On the employee survey side, if seven out of 10 employees say the organization is a “Best Place to Work,” it is certified for a year. Certified organizations can use the badge on their career website and have access to the marketing tool kit. The cost to the provider is $995 for less than 1,000 employees, and $1,495 for more than 1,000 employees. We also have software subscription packages for analytics and internal use.
Within a few months of being certified and promoting certification, providers average a 20% increase in job applicants. What’s more, communities certified by Great Place to Work get applicants they may not have gotten before. People notice the certifications on marketing materials and take another look.
The data from certified organizations is put in a pool and run through an algorithm for “Fortune Best Workplaces in Aging Services,” a list they created for our industry. Organizations are not only certified but ranked nationally, which generates move-ins. Families want to know that their loved ones are cared for by employees whose employers take care of them.
On the U.S. News Best Senior Living side, last summer we conducted a study, a few months after the first consumer data release. We found that instead of driving 10 minutes, people would drive 20-25 minutes to afford mom or dad residency in a best-rated community. This results in four times the number of potential leads. We also found a 10% increase in tour conversions to the next step in the sales process. People are willing to drive to afford their mom residency in a better place.
Mace: What other results of your surveys would our readers find of interest?
Kung: We collected customer experience and property performance data from 150 communities and showed that those in the top quartile produced an extra $225,000 of EBITDA. Using a 7% cap rate, this translates into $3M or more of value per building. Once you have the data, you can see where you need to improve. Happy customers significantly decrease the number of move-outs which boosts property performance.
Mace: What are some other key takeaways business leaders have applied from survey results?
Kung: Business leaders like having a number. They can tie employee satisfaction numbers to turnover, worker’s comp claims, and other measures. On the customer side, with our software subscription package, providers can analyze all types of data to use in decision making. One CEO was about to invest $100 million in new buildings. His customer surveys showed that there were complaints about noise on the upper floors of his existing buildings. Before he made the capital investment, he was able to make a change to his building plans. Smart operators watch the customer satisfaction data and make decisions based on the results.
Mace: Can surveys be customized?
Kung: Yes, with the software subscription, providers add additional questions to the standard questions, then use filters and analytics to slice and dice the information. For example, the CEO looking at $100 million investment in new communities added questions on construction finishes.
Mace: Our industry would like to know what our next group of customers, the baby boomers, want in senior living. Do you have any insights into that question?
Kung: We have not directly asked because we survey current customers. However, I have noticed what family members like and don’t like. We have hundreds of thousands of comments. A lot of people want to move in with friends and be close to things they like to do. Transportation is important so people can go where they want. They also want a place that someone else can take care of while they travel.
We can also process the language used in comments. We’re looking at the relationship between purpose, autonomy, and belonging to reduce hospitalizations and nursing home admissions.
Mace: Is there anything else you’d like to add?
Kung: I love what we do. Our industry has not stood up for itself to get the recognition we deserve. As a team, we are proud that we can help get our industry the positive visibility it deserves. We need to get the comments of customers and employees – who are generally happy – out into the mainstream to build our industry’s brand.
Deep Dive: California’s Senior Housing Market Per Data Through Third Quarter 2022
by Caroline Clapp, Senior Principal, NIC
 This commentary drills deep into recent performance and inventory composition of the Primary and Secondary Markets in California and is the first in a series of deep dive geographical analyses to be conducted by NIC Research & Analytics.
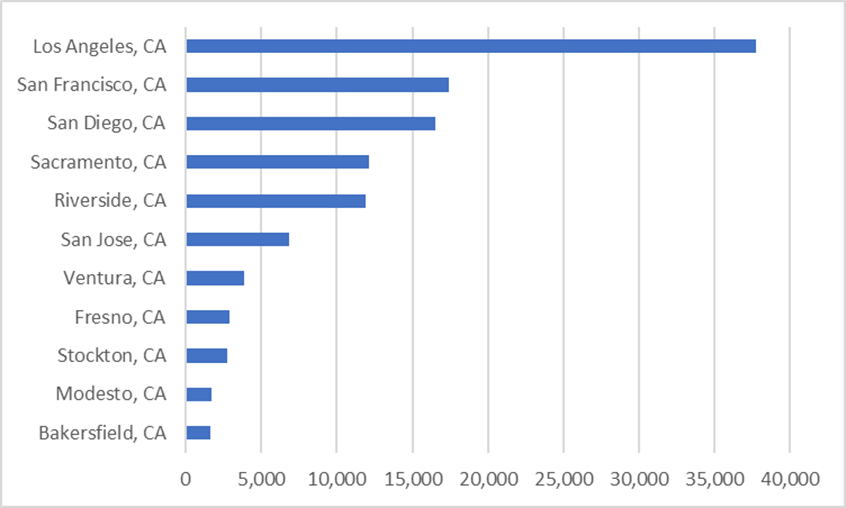
Market Size. Of the 99 Primary and Secondary Markets that NIC MAP Vision (NMV) tracks across the nation, 11 are located in California. Within these California Primary and Secondary Markets, NMV tracks 1,004 senior housing properties with 115,440 units, or 11% of the senior housing units within the U.S. This share is comparable to California’s 12% share of the total U.S. population (39.2 million people in 2021 lived in California versus 331.9 million in the U.S.).
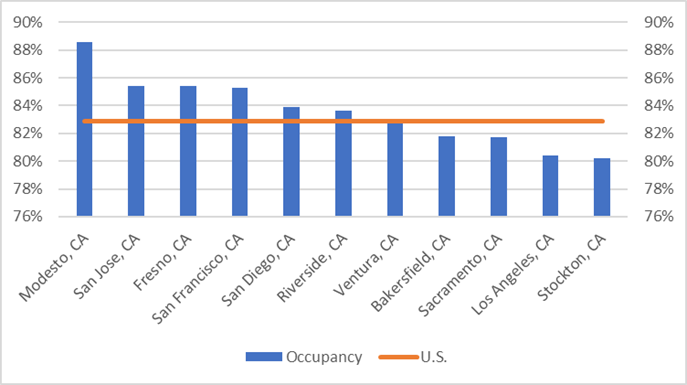
Occupancy Rates. In aggregate, the California Primary and Secondary Markets in the third quarter of 2022 had a senior housing occupancy rate of 82.7%, in line with the U.S. occupancy rate of 82.9%. Across the 11 California markets, 7 markets had senior housing occupancy rates at or above the national average of 82.9%. Interestingly, market size did not dictate occupancy rate rankings. Indeed, occupancy varied by market size with larger markets such as San Francisco (85.3%); San Diego (83.9%); and Riverside (83.6%) at above-average occupancy rates but also smaller markets like Modesto, which ranked 7th overall in the nation with an occupancy rate of 88.6%.
Senior Housing Market Size in Units | California
Primary and Secondary Markets | 3Q22
Senior Housing Occupancy | California
Primary and Secondary Markets | 3Q22
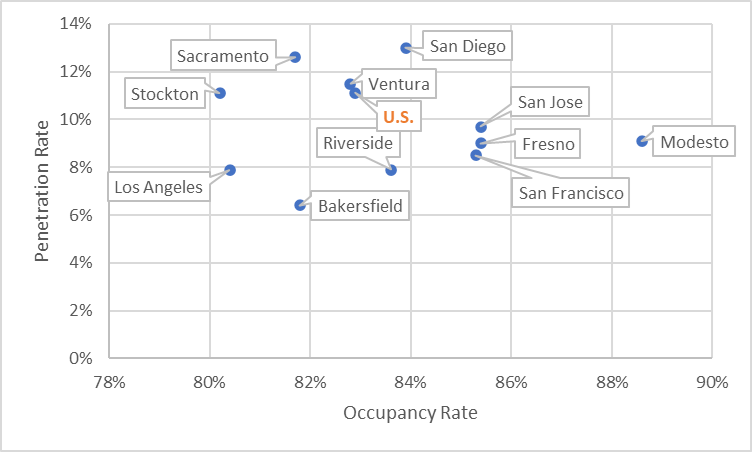
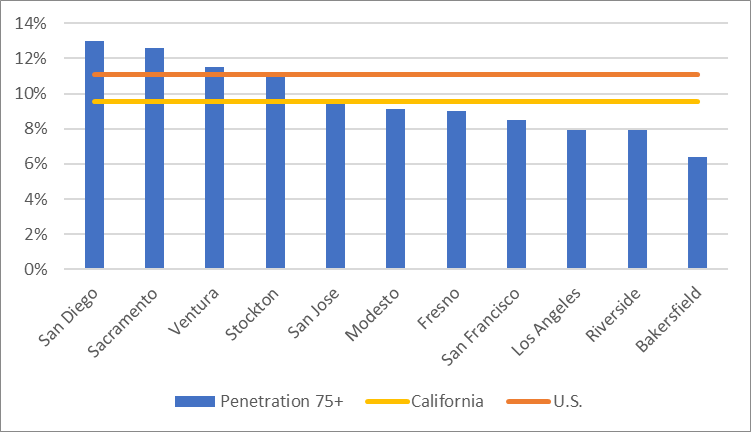
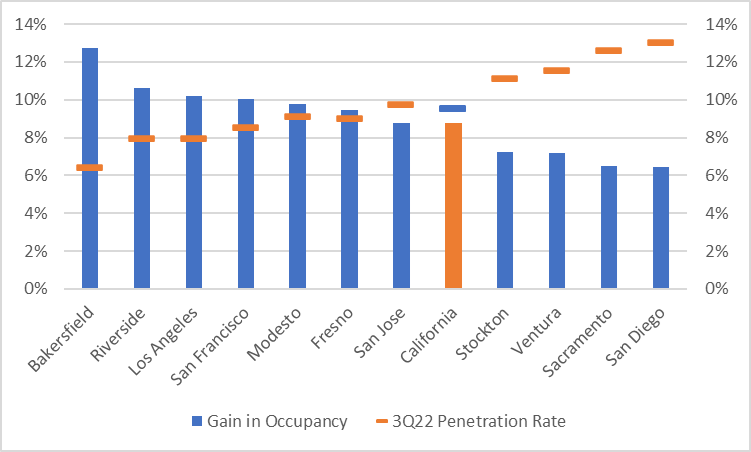
Penetration Rates. The penetration rate1 for California in the third quarter of 2022 was lower than the U.S. at 9.5% versus 11.1%, respectively. When examining occupancy and penetration rates in California, it is important to keep a few considerations in mind. First, board and care properties, which are not tracked by NMV and are not included in this analysis, may directly compete with many of the properties tracked by NMV. Also note that these properties are not included in the penetration rate. According to the California Registry, there are more than 8,100 of these properties in the state, and more than 90% provide non-medical custodial care within a single-family private residential home setting that is licensed for six or fewer residents.
Second, penetration rates vary by market size (i.e., unit count), with larger markets like San Diego (13.0%) and Sacramento (12.6%) at above-average penetration rates but San Francisco (8.5%), Los Angeles (7.9%), and Riverside (7.9%) well below. Penetration does not appear to correlate with occupancy either as only San Diego has both penetration and occupancy rates above the U.S., while Los Angeles ranks among the lowest in terms of both penetration (7.9%) and occupancy (80.4%). Reputation of the incumbent operators in a market and the length of time seniors housing has existed in a market are among the factors that can influence penetration rates.
Overall, there are four markets in California with penetration rates at or above the U.S., indicating that senior housing among households age 75-plus is well-accepted and well-established within those markets. However, a high penetration rate also indicates elevated competition for older adults within a senior housing market. Meanwhile, the remaining seven markets in California have penetration rates below 10%, indicating that additional marketing may be needed to inform the public about the benefits of senior housing, such as its care, hospitality, and socialization offerings.
Indeed, a one percentage point increase in the penetration rate for the California Primary and Secondary Markets from 9.5% to 10.5% would boost the occupancy rate from 82.7% to 91.5%. Notably, when drilling down into individual markets, the markets with the lowest penetration rates would benefit the most in terms of occupancy gains given a one percentage point increase in the market’s respective penetration rate.
Senior Housing Penetration and Occupancy Rates | California
Primary and Secondary Markets | 3Q22
Senior Housing Penetration Rates | California
Primary and Secondary Markets | 3Q22
Increase in Senior Housing Occupancy Rate Given
1 Percentage Point Increase in Penetration Rate
California Primary and Secondary Markets | 3Q22
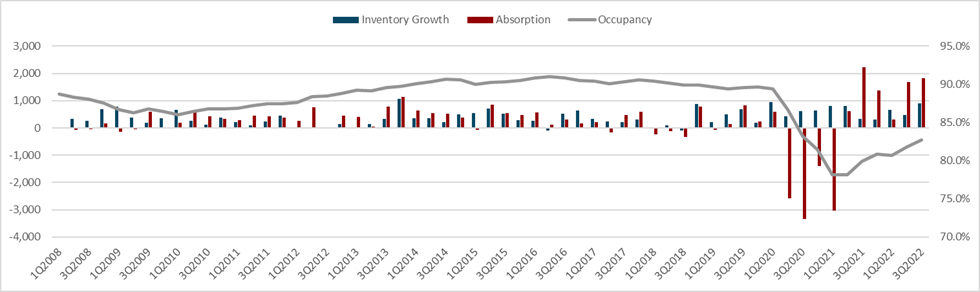
Supply, Demand, and Occupancy Rate Patterns. The chart below provides detail on the supply, demand, and occupancy rate patterns for California’s Primary and Secondary Markets. Regarding demand, as measured by net absorption, 10,343 units were put back onto the market on a net basis from the first quarter of 2020 (i.e., beginning of the pandemic) through the first quarter of 2021 (i.e., trough of the pandemic). At the same time, units that were already under construction before the onset of the pandemic continued to arrive online, creating inventory growth of 2,497 units during the same four quarters. These supply and demand fundamentals weighed on occupancy, which fell 11.2 percentage points from 89.4% to 78.2% over this period. The market began to recover thereafter, and from the first quarter of 2021 through the third quarter of 2022, 7,987 units were leased on a net basis, reabsorbing 77% of the inventory that was put back online and totaling more than double the 3,458 units of new inventory growth during that time.
This positive demand coupled with moderate new supply drove occupancy to 82.7% in the third quarter of 2022, up 4.5 percentage points from its nadir, but still 6.7 percentage points from pre-pandemic levels. This was a wider occupancy rate spread to recovery than the overall Primary and Secondary Markets spread of 4.2 percentage points after these markets reabsorbed 98% of the pandemic-driven negative demand. Despite this gap in occupancy recovery, California’s occupancy rate in the third quarter was in line with the 82.9% occupancy rate across the aggregate 99 markets because the California markets went into the pandemic with stronger or higher overall occupancy rates.
Senior Housing Fundamentals | California
Primary and Secondary Markets | 2Q08 – 3Q22
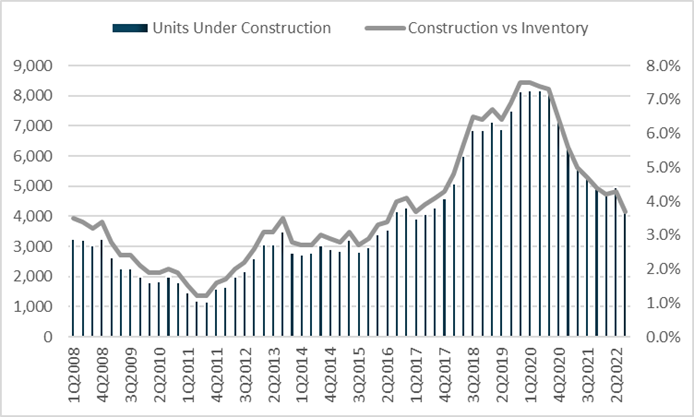
Construction. In terms of new supply, at the end of the third quarter the number of senior housing units under construction in California’s Primary and Secondary Markets stood at 4,271 (43 properties), equivalent to only 3.7% of existing inventory. This level of construction is down from a recent peak in the first quarter of 2020 of 8,174 units (71 properties) – which totaled 7.5% of existing inventory at that time – and is lower than the 4.8% of inventory under way in the U.S.
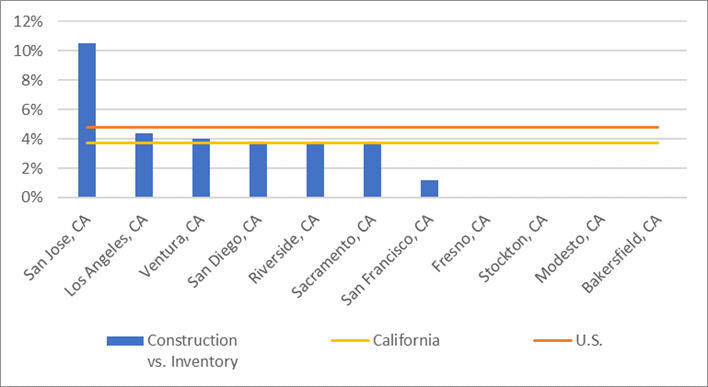
In aggregate, new supply in California’s Primary and Secondary Markets is not likely to be a headwind to occupancy in the near term. However, when drilling down into individual markets, construction activity varies. San Jose (10.5%) had the largest level of construction as a percent of inventory, distantly followed by Los Angeles (4.4%) and Ventura (4.0%). Drilling into San Jose’s existing senior housing inventory, 40% is comprised of majority assisted living units, while virtually all (96%) of construction underway is allocated to assisted living. Hence, San Jose is becoming a more need-based assisted living market than it is currently. In comparison, the four smallest senior housing markets in California – Bakersfield, Modesto, Stockton, and Fresno – had no new supply underway.
Senior Housing Units Under Construction and
Construction as a Percent of Inventory
California Primary and Secondary Markets | 1Q08 – 3Q22
Senior Housing Construction as a Percent of Inventory by Market
California Primary and Secondary Markets | 3Q22
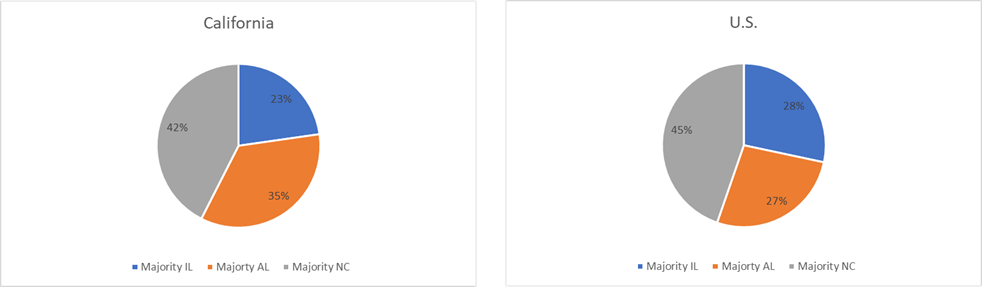
Inventory Composition. When evaluating existing inventory in the third quarter of 2022, the property type distribution of California compared to the U.S. was more heavily comprised of assisted living (35% versus 27%, respectively) than independent living (23% versus 28%, respectively). As a result, occupancy in California may be somewhat more recession- and housing market-resilient in the near term given the need-based demand for assisted living and its care services, while independent living is typically less needs driven.
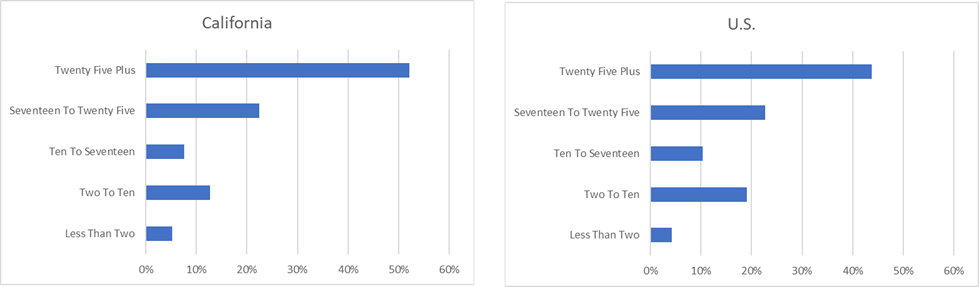
The distribution of properties by age in the third quarter was older in California than the U.S., with 52% of properties in California age 25 years or older compared to 44% of U.S. inventory. Newer properties age 2 to 10 years and 10 to 17 years comprised 20% and 29%, for California and U.S. inventory, respectively.
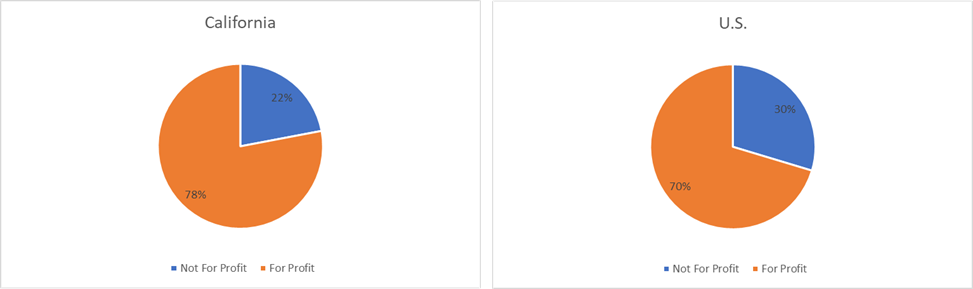
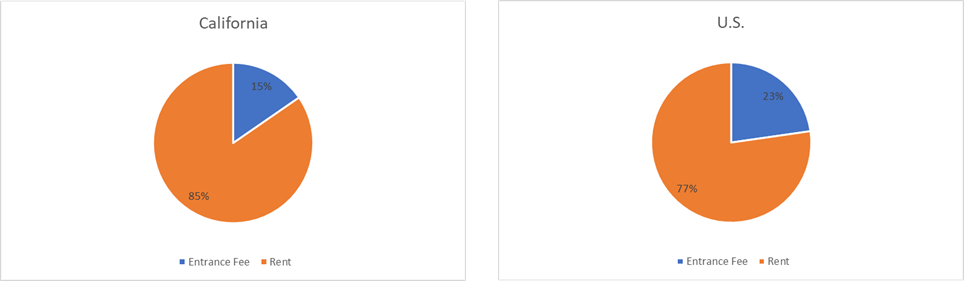
The share of for-profit inventory in the third quarter was larger in California (78%) than the U.S. (70%), while the share of rental fee properties was higher in California (85%) than the U.S. (77%). This means that entrance-fee CCRCs are somewhat less prevalent in California (15%) than the nation (23%).
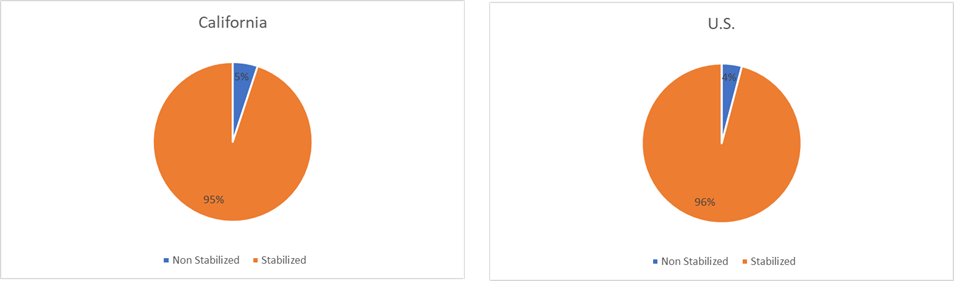
The share of non-stabilized inventory2 (a measure of how much recent inventory is not yet filled) was slightly higher for California (5%) than the U.S. (4%). This may be due to inventory growth from the first quarter of 2021 through the third quarter of 2022, which was slightly higher in California (3.1%) than the U.S. (2.3%). Additionally, the amount of pandemic-driven negative net absorption not yet recovered in California (23% versus only 2% for the U.S.) has increased the number of units competing for residents.
Overall, relative to the U.S., California has a lower share of not-for-profit inventory combined with higher shares of older, rental fee inventory. The market is somewhat more tilted to assisted living and has slightly more new inventory to fill.
Senior Housing Property Type by Percent of Units |
California vs. U.S. | 3Q22
Senior Housing Property Age in Years | Primary and
Secondary Markets | California vs. U.S. | 3Q22
Senior Housing Profit Status | Primary and Secondary
Markets | California vs. U.S. | 3Q22
Senior Housing Payment Types | Primary and
Secondary Markets | California vs. U.S. | 3Q22
Senior Housing Stabilization Status by Percent of
Units | California vs. U.S. | 3Q22
Key Influencers. When analyzing key influencers for senior housing demand in California’s Primary Markets, San Francisco has an above-average share of households age 75-plus (11.6%), while Sacramento has above-average projected annual growth in these households (3.4%), indicating positive tailwinds for senior housing demand in these two markets. All six Primary Markets in California (Los Angeles, San Francisco, San Diego, Sacramento, Riverside, and San Jose) have median home values that are higher than the U.S. Meanwhile, Los Angeles, San Francisco, San Diego, and San Jose have median incomes for older adults (households age 75-plus) and adult children (households age 45-64 who may contribute to care expenses) that are higher than the U.S., indicating good ability to finance the costs of senior housing.
Within the Secondary Markets, all five markets in California (Ventura, Fresno, Stockton, Modesto, and Bakersfield) have median home values higher than the U.S. Among adult children, Ventura and Stockton each have a larger share of households age 45-64, and these households have median incomes above the U.S. Among households age 75-plus, Ventura has a larger share than the U.S., and both Ventura and Stockton have median incomes above the U.S.
Senior Housing Key Influencers | California
Primary and Secondary Markets | 3Q2
(Green highlight indicates above U.S. average)


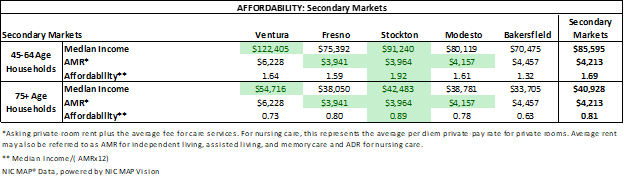
Affordability. When analyzing affordability across California’s markets, it is helpful to compare household median incomes for older adults (age 75-plus) and for adult children (age 45-64 who may contribute to care expenses) to the annual cost of senior housing, i.e., rent plus the average fee for care services (AMR) over 12 months. Using this calculation, households age 45-64 in the Primary Markets have above-average affordability in San Francisco and San Jose, while households age 75-plus have above-average affordability in San Diego and San Jose. In the Secondary Markets, households age 45-64 and 75-plus have above-average affordability only in Stockton. Note that this is one method to calculate affordability, and this analysis simply shows relative ability to pay rent and care fees from median household income. Other sources of funds are often used such as net worth, which includes savings and retirement funds, as well as the ability to sell one’s home.
Senior Housing Affordability | California
Primary and Secondary Markets | 3Q22
(Green highlight indicates above U.S. average)

Final Thoughts
While California’s senior housing occupancy recovery lags the U.S. in terms of reaching its pre-pandemic occupancy rate (a gap of 6.7 percentage points versus 4.2 for the U.S.), the occupancy rate for California in the third quarter of 2022 was on par with the U.S. average. Prior to the onset of the pandemic, from 2015 through the first quarter of 2020, occupancy rates in California trended higher than the U.S. by an average of 2.0 percentage points. It will be interesting to observe whether California can regain this lead.
Recent demand trends and demographics in California are mostly positive, with absorption turning positive and with median incomes and median home values well above the U.S. However, significant outmigration occurred in many cities across the U.S. following the onset of the pandemic, likely accelerating a trend of outmigration to more affordable parts of the country. In California, population declines3 were most significant in San Francisco (-2.6%) and San Jose (-2.4%), followed by Los Angeles (-1.5%); Ventura (-0.5%); and San Diego (-0.4%). As a result, households age 45-64 in 10 of the 11 California Primary and Secondary Markets tracked by NMV are projected to shrink by a larger amount than the U.S. over the next five years (San Jose is expected to fare slightly better at -0.9% annually versus -1.1% U.S.). On the positive side, older adult households (age 75-plus) across all 11 markets in California are expected to grow by 2.4% to 3.4% annually over the next five years, providing positive tailwinds for senior housing demand.
Inventory in the development pipeline in aggregate is relatively moderate, which should help occupancy continue to recover. Difficult zoning regulations and entitlement rules and the subsequent barriers to entry imposed on new development mean that California’s construction activity remains relatively low for many of its metropolitan markets. While these are negative factors for developers and operators vying to enter the California senior housing market, it is a positive backdrop for incumbents in those markets as well as those that currently have projects underway. California’s higher cost of living and of doing business – as well as higher home prices – contributed to its asking rents in the third quarter of 2022 in the Primary and Secondary Markets that were 19% and 8% higher on average, respectively, than the national averages.
Overall, while the pandemic created a challenging environment for senior housing fundamentals, California remains one of the most populated and wealthiest geographic regions in the U.S. and is also comprised of a large middle income older adult population and thus continues to bear monitoring for current and future trends.
1Inventory divided by the number of households, generally the number of age 75+ households, unless otherwise noted.
2Stabilized occupancy inventory are properties that are (a) at least two years old, or (b) if less than two years old, properties that have achieved occupancy of at least 95.0% since their opening.
3Cumulative Resident Population Change from April 1, 2020 to July 1, 2021. Source: Census Bureau.