All Eyes on Quality
Jeff Amann Discusses Welcov’s Approach to Quality

Demonstrating quality has become a regular headline in skilled nursing news, thanks to CMS initiatives and the push to value-based care. For Welcov Healthcare, an operator headquartered in Minnesota, measuring quality has always been a priority, even now as the focus has expanded. Welcov has more than 60 long-term care, short-term care, and assisted living facilities and home health agencies throughout Minnesota, South Dakota, Montana, Iowa, Nebraska, and Wyoming.
NIC recently spoke with Jeff Amann, Welcov’s chief operating officer, about the company’s approach to tracking quality in an evolving health care system.
NIC: How do you define quality for your organization? How do you measure changes in quality in your own organization?
Amann: There is nothing more important in our industry than having a relentless focus on quality. Welcov defines quality in many ways. There is not just one touchpoint that will be a good indicator of your quality. We look at a balanced approach that includes customer satisfaction feedback, regulatory performance, quality indicators, care outcomes, and return to hospital. While these are direct measures, we also key in on feedback through our corporate hotline, website, and anecdotal discussions with associates, referral sources, physicians, vendors, and others who touch our services every day.[expand title=”Read More” trigpos=”below” tag=”div” trigclass=”nic-read-more”]
All of these metrics are assessed in a number of ways including by our Corporate QAPI (quality assurance performance improvement) Committee, financial analysis, and daily reviews through our comprehensive dashboard, PrimeView.
NIC: How has the perception of quality changed in the industry? How has that impacted your operations and strategy?
Amann: Clearly quality has always been important in our industry. How we measure quality and what constitutes quality outcomes has definitely changed, especially with the onset of the CMS’ Five-Star Quality Rating System, preferred networks, and CMS innovation projects. Quality historically has been measured by traditional indicators, such as pressure ulcers, falls, pain, etc. Quality today is much more comprehensive with a focus on outcomes and continuous improvement. Quality can also be measured by a higher level of employee satisfaction and strong financial results.
As we experience changes in payment structures, such as value-based purchasing, bundled payments, and Medicare Advantage programs, we are seeing a higher emphasis on return to hospitals, length of stay, and other quality outcomes that will affect financial returns. This definitely impacts our operations and strategies as we focus on industry changes.
NIC: Where are your priorities for quality improvement? Where are the pressure points?
Amann: Hands down, QAPI is the highest priority in our organization. If you are an organization that is not regularly looking at key metrics at all levels and constantly seeking ways to improve performance, you will not survive. Welcov has put a robust system in place that includes: daily quality conferences at all skilled nursing properties; monthly facility, regional, and corporate QAPI committees; mock regulatory surveys; and a root cause analysis protocol that helps to mitigate risk and improve outcomes.
Probably the most difficult pressure point for our employees is the challenging regulatory environment and the inconsistency in the application of these regulations. While this is a challenge, it is a big opportunity for us to do a better job of anticipating changes in the industry and build competencies with our staff that support even better quality care. Quality is not something that you reach and say “we made it.” Quality is a fluid concept that is woven into everything we do.
NIC: What are your motivations for maintaining your reputation as a high-quality provider? What drives you to keep the bar high?
Amann: Our employees are driven by doing the best work they can do each and every day. We are motivated by providing an environment that is engaging to work in and that expects high quality services. I hear many stories from employees and our customers that talk about going above and beyond the call of duty. Hearing these stories and seeing customer outcomes motivate us to continue to strive for providing the best possible service. We are also motivated by continuing to develop high-acuity services for our acute care partners and being a solution in the markets that we serve. Seamless transitions of care at all levels is important to our customers as well as staff that is focused on complex needs.
NIC: You’ve mentioned your front-line employees quite a bit. How did Welcov come to view staff as integral to adapting to the changing regulatory landscape? How are you mitigating challenges posed by high turnover, labor scarcity, and minimum wage hikes?
Amann: Welcov has always viewed front-line staff as an integral part of all changes in our industry, whether regulatory, payment stream, or clinical needs. We view all of these situations as opportunities to educate our teams to the new realities of our business. The regulatory landscape in particular is a tough one, since it generally is more punitive with little room for consultative instruction. Most training revolves around processes and procedures that are driven by industry regulations. Supporting front-line workers through these processes is critical, as they can be overwhelming and intimidating.
Providing an environment that is open and supportive is also the way you mitigate the challenges in our industry when it comes to high turnover, labor scarcity, and limited wages. Our staff expect an environment that is transparent, collaborative, and supportive. We ask for feedback from our employees formally twice a year and expect our leadership teams to work on improving the areas identified by employees as needing attention. However, it is more than just responding to these surveys; it is creating an environment on a day-to-day basis that employees want to work in.
NIC: What specific kinds of data does your organization use to make decisions about your operations?
Amann: In addition to other financial report systems and data collection, we rely heavily on our dashboard system called PrimeView [a product of Prime Care Technologies]. This system allows us to review occupancy, cash collections, bad debt, labor hours, customer satisfaction, and key clinical metrics in real time.
The data collection is the easy part. What is critical is the analysis of the data and the ability of the organizational leaders to make operational changes based on trending and metrics that are significantly off industry benchmarks. With the volume of work each day in caring for our customers, this can be a daunting task. We want to make access to this information as easy as possible so we can spend more time on executing solutions to variances.
NIC: What are the biggest challenges to collecting, aggregating, and analyzing relevant data?
Amann: Setting up a dashboard that links our major software systems that are discipline-specific, such as our electronic health system, finance, and payroll, has been a big challenge. We have been very purposeful in making sure we are not duplicating information and that we have one depository for all key employees to access. Having the time to analyze the data and set in motion operational changes is a big challenge, but it is necessary, and we have built in processes that encourage that analysis through weekly meetings and ongoing reviews. We will always be refining the system in response to industry changes in expectations and benchmarks.
Our industry has not historically been pressured to provide per-episodic costs of care similar to the acute care setting and DRG reimbursement. As ACO relationships and new reimbursement streams such as bundled payment initiatives expand, the need for being able to identify episodic costs continues to grow. Having a system that captures this data in real time is our biggest challenge since it relies on a number of discipline specific platforms: finance, payroll, accounting, clinical, billing, and reimbursement.[/expand] [cresta-social-share]
By the Numbers: The Southeast’s Seniors Housing Market
The Southeast is a vibrant and expanding region of the country, with steady inflows of businesses and individuals that are seeking and generating employment opportunities. The region, which is defined as Florida, Georgia, Mississippi, Alabama, and Tennessee, is headquarters to many corporations. It offers a bevy of retirement destinations, business connections, cultural offerings, recreational opportunities, and broad-based growth potential. Plus, it has a climate attractive to many, snowbirds among them.
As of 2015, the Southeast had an estimated combined population of 45 million people, or 14% of the nation’s population. The Southeast’s population has historically grown at a faster pace than the nation’s and, since 2010, its population has expanded by 5.5% (2.3 million), significantly faster than the national growth rate of 4.1%. In fact, 19% of the nation’s population growth occurred in the Southeast during this five-year period, far more than its 14% share of the total population. Projections from the U.S. Census Bureau suggest that this region of the country will continue to expand at a faster pace than the nation as a whole.
Let’s take a closer look at this vibrant region and its dynamic seniors housing market.[expand title=”Read More” trigpos=”below” tag=”div” trigclass=”nic-read-more”]
Seniors Housing in the Southeast
The following table shows the 23 markets the NIC MAP® Data Service tracks in the Southeast. This region makes up 14% of NIC MAP’s entire seniors housing inventory.
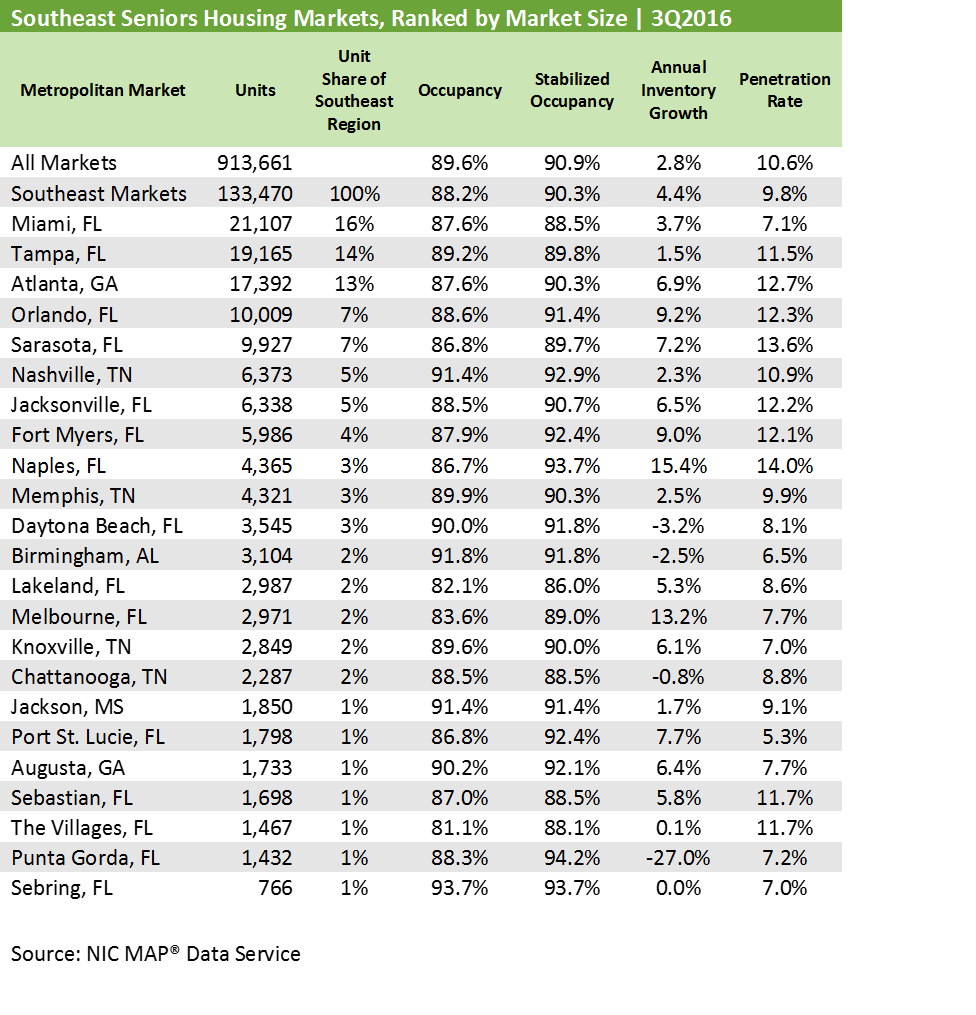
Within the 23 Southeast markets, there are 133,000 units situated in 1,086 properties that are monitored by NIC MAP. Collectively, the occupancy rate for these markets was 88.2% in the third quarter of 2016, significantly below the national average of 89.6%. The majority of the properties (94%) are stabilized, meaning that they have been opened for more than two years or have reached 95% occupancy. The stabilized occupancy rate for the aggregated 23 Southeast markets was significantly higher at 90.3% compared with the all occupancy rate (inclusive of properties stabilized and those still in lease up), and was only 60 basis points below the national stabilized occupancy rate of 90.9%. The difference between the all occupancy rate (88.2%) and the stabilized occupancy rate (90.3%) reflects the large number of properties that are not yet stabilized and still in lease up (6% of the inventory versus 4% at the national level).
Looking ahead, we’ll likely see continued pressure on the all occupancy rate because there are a number of properties currently under construction that will join the ranks of properties in lease up in the coming 24 months. Indeed, as of third-quarter 2016, there were nearly 97 properties with 10,000 units under construction in the Southeast, nearly 9% of the region’s property inventory. For perspective, this is roughly equivalent to the number of units leased on a net basis (absorbed) since mid-2013 in these markets.
Younger Stock in the Southeast
Not surprisingly, in light of the amount of non-stabilized properties in the market, the age of inventory in the Southeast is a bit younger than the national stock of seniors housing properties. Roughly 7% of the inventory in the Southeast is less than two years old versus 5% at the national level. About 16% of inventory is between two and ten years old (versus 17%). Conversely, more than 58% of both the national and regional stock was built prior to 1999.
Looking more closely at the metropolitan markets in the region, fifteen are in Florida, four in Tennessee (Chattanooga, Nashville, Memphis and Knoxville), two in Georgia (Atlanta and Augusta), one in Alabama (Birmingham) and one in Mississippi (Jackson). Despite Florida’s dominance in the region, Atlanta holds its spot on the top five list of Southeast CBSAs for its sizeable share of the region’s inventory. The top five Southeast metropolitan markets and their respective shares of the region’s inventory are:
- Miami, FL (which includes West Palm Beach and Fort Lauderdale), at 14%
- Tampa, FL, at 14%
- Atlanta, GA, at 13%
- Sarasota, FL, at 7%
- Orlando, FL, at 7%
Lower Penetration Rates in the Southeast
Despite the region’s (particularly Florida’s) reputation of being a retirement mecca, the penetration rate of seniors housing among households older than 75 is less in the region as a whole than for the nation (9.8% versus 10.6% as of third-quarter 2016). In Florida, seven of the fifteen markets—Daytona Beach, Lakeland, Melbourne, Miami, Port St. Lucie, Punta Gorda, and Sebring—have penetration rates less than the national rate of 10.6% and significantly less than the penetration rates of either Naples (14.0%) or Sarasota (13.6%). This suggests that there may be an opportunity for growth in the markets with below-average penetration rates. However, a detailed assessment of current and projected market fundamentals should be conducted before this conclusion is reached. In addition, some pundits suggest that Florida’s extensive condo market is a factor contributing to its lower penetration rate.
Market Performance Varies in the Southeast
In the third quarter of 2016, 8 of the 23 markets in the Southeast had seniors housing occupancy rates that were higher than the national average of 89.8%. The best performing markets, with occupancy rates above 91%, included Nashville, Birmingham, Jackson, and Sebring. Other markets with occupancies above the national average included Memphis, Daytona, Knoxville, and Augusta. With the exception of Nashville and Knoxville, many of these markets currently have limited amounts of construction underway.
Missing from this list of markets with high occupancy levels are actually the biggest Southeast markets: Miami, Atlanta, Tampa, Sarasota, and Orlando. Three of these—Atlanta, Orlando, and Sarasota—have seen relatively strong growth in inventory near or exceeding 7% of their existing inventories in the past year, which is well above the regional and national rates. However, demand held up reasonably well in these markets, with annual absorption rates of more than 8% in Orlando, about 6% in Sarasota, and nearly 4% in Atlanta, which prevented occupancy from falling even more sharply than it did. In Atlanta, occupancy fell from a near-cyclical high of 90.4% in the third quarter of 2015 to 87.6% in the third quarter of 2016, while the occupancy rate in Orlando fell from 89.4% to 88.6%, and Sarasota fell from 87.7% to 86.8%. Therefore, it is important to study demand trends as well as supply trends in making market assessments and investment considerations.
A Deep Dive into Naples
Naples is a mid-sized market in the Southeast that has drawn significant interest from developers and operators. The metropolitan market’s inventory has expanded by more than 15% in the past year, the most of any of the 23 markets in the region. With 11.2% of its current inventory under construction, even more new product offerings will soon come online. Stabilized occupancy in Naples was strong at 93.7% in the third quarter of 2016 (tied for second with Sebring), while market penetration was high at 14% (the best in the region) and annualized absorption was nearly 13% (second only to The Villages). The all occupancy rate, which includes properties still in lease up, was relatively, but unsurprisingly, low at 86.7% (below the regional average of 88.2% and below the national average of 89.6%). Despite these conditions, asking rent growth has been strong at 8%, the best in the region.
Behind all of these statistics and performance measurements is a broader story that merits consideration and investigation. What do these data points portend for the future? How quickly can new product can be leased, and what, if any, concessions need to be offered to grow and/or maintain market share?
On the demand side, the strong growth in rent mirrors rapid home price appreciation in the metropolitan area: the median existing single family home price in Naples has risen by 88% in the last five years and is the highest in the South at $417,800 (compared with the U.S. median price of $231,100). Relative to other Florida metropolitan markets, employment growth is also very strong in Naples, at more than twice the Florida average in the last three months, according to Moody’s Analytics. A steady stream of retirees into Naples may lay the groundwork for steady absorption levels, supported further by improving macroeconomic conditions. The higher interest rates projected by many pundits for 2017 will also potentially boost retiree income. Income from interest, dividends, and rent make up more than half of personal income in Naples versus 20% in the U.S., according to estimates by the U.S. Bureau of Labor Statistics and Moody’s.
It Is More Than Just the Numbers?
Just as Naples has nuances related to demand drivers, all metropolitan markets are influenced by factors affecting their respective market fundamentals. Entitlement procedures, availability of labor, natural and regulatory barriers to entry, and the competitive landscape are among the primary factors driving the pace and amount of development. The concentration of adult children and retirees, income levels, home ownership rates, velocity of home sales and home prices, and broad-based employment conditions affect demand.
As this article has shown, NIC MAP has important data that differentiates market performance within geographic regions and the nation. Differences in supply and demand patterns, stabilized versus all-occupancy rates, rent levels and growth rates, penetration rates, and property mix and age provide indicators that can be further analyzed to understand why some markets emerge as winners while others fall behind.[/expand] [cresta-social-share]
Forum Spotlight: Expanded Programming for a Broader Audience

The historic growth of the aging population in the U.S. and across the globe is prompting a boom in products and services designed to help seniors age better. There are significant opportunities for seniors housing and skilled nursing operators to collaborate with innovative care delivery and coordination organizations and bring in new capabilities to care for older seniors more efficiently and effectively.
These new collaborations—and the value they can create—will be a key focus area at the 2017 NIC Spring Investment Forum in San Diego this March. The Forum’s programming will feature a mix of sessions on capital and industry trends as well as strategies for unlocking value through partnerships with product and service providers outside operators’ customary, real estate-based care silos.[expand title=”Read More” trigpos=”below” tag=”div” trigclass=”nic-read-more”]
“These collaborations are providing tremendous opportunities—both for operators needing to demonstrate and deliver value, and for the new service providers who are looking to get their products and services to scale quickly,” said Brian Jurutka, NIC’s president. “Our programming is expanding to include new topic areas on strategies and case studies for collaborating and unlocking such value along with NIC’s traditional, highly popular sessions on economic, valuation, and supply and demand trends.”
In the new topic areas, conversations will focus on capturing value and creating successful partnerships. Some highlights of these sessions are provided below.
Capturing Value
These sessions will detail the operational and financial opportunities some seniors housing and care operators and their investors are exploring beyond real estate transactions, including value-based care collaboration and new technology initiatives.
- The Value-Based Care Revolution: The federal government is pushing to reduce the cost of care while improving outcomes, especially for frail seniors, by shifting away from traditional fee-for-service to value-based care delivery and payment strategies such as alternative payment models, bundled payments, and Medicare Access and CHIP Reauthorization Act (MACRA). Key to these strategies is the assumption of risk, whether for episodes of care or in a population health model. This session will explore further regulatory changes likely in 2017, and what they may mean for seniors housing and skilled nursing.
- Hot New Investments in Senior Care: The increasing focus on value has not escaped investors’ notice. Venture capital alone invested more than $200 million in home care companies in 2016, and investors who traditionally focused on biotech and pharmaceutical health care spaces have funded new primary care service enterprises that are innovating care for frail seniors. This session will explore how these companies who are targeting frail seniors use sophisticated platforms designed to increase value to payors and consumers, and why investors increasingly are paying attention.
- Managed Care: Opportunities & Challenges as a Senior Care Provider: About one-third of Medicare beneficiaries are enrolled in managed care today and nearly half of all seniors are expected to be enrolled within the next 10 years. But as more senior care organizations experiment with managed care products, strategies, and partnerships, will they add value to their operations and enhance the quality of care? This session looks at the unique business opportunities and challenges of managed care, including enabling risk management, that operating companies and providers face in the seniors housing, post-acute care, and long-term care markets.
- Using Innovative Technology to Unlock Value: Technology can potentially be the most powerful tool to unlock new value for operators/providers, stakeholders, and consumers. In this session, discover how to harness technology to facilitate communication across organizations as well as empower seniors to manage their own clinical care and enrich their personal lives.
Creating Successful Partnerships
This topic area is designed to explore partnership opportunities that create value for an attendee’s organization, care partners, payors and those assuming risk, as well as for investors and seniors.
- Building Partnerships for Clinical & Financial Success: The focus on quality and value is pressuring operators/providers to seek solutions outside their building walls. What’s key is finding partnerships not for the sake of partnering, but to collaborate on achieving shared operational and financial goals that ensure success for both organizations.
- Seniors Housing’s Role in the Home Care Evolution: The private-pay home care industry is changing rapidly. While the old contractor-agency model persists, more home care organizations are increasingly moving toward technology-enabled, employment-based models as well as online direct-to-consumer platforms. Some are even exploring retail avenues to attract consumers. As these home care organizations—and the capital providers who invest in them—experiment with different distribution channels, how can seniors housing partner with them?
Registration Opens
Secure your spot at the 2017 Forum—register today. Early birds save, so act by January 25, 2017, at 11:59 PM ET.[/expand] [cresta-social-share]
Labor Continues to Dominate Long-Term Care Conversations
Judging from the headlines in long-term care and post-acute care media, skilled nursing cannot escape the impact of labor. Nursing homes and other provider types operating in this space are juggling significant staffing challenges. Labor already makes up the largest share of expenses for these operators. Yet at the same time, some advocates are calling for higher wages for low-level staff and higher staffing ratios, as discussed in the October issue of the NIC Insider Newsletter.
This month, we’ll look at the most recent developments in skilled nursing labor, including an investigation into over-reporting of nurse hours worked, data indicating that workplace injury remains common in nursing homes, and regulatory changes enacted due to a nationwide nurse shortage.[expand title=”Read More” trigpos=”below” tag=”div” trigclass=”nic-read-more”]
Alleged Over-Reporting of Nursing Hours
PennLive, a Pennsylvania publication, recently published a series of articles on the nursing home industry, including an investigation into discrepancies among nursing home staff levels as reported to different government outlets.
The issue of discrepancies in self-reporting is not new. A 2007 study by Texas A&M found that staffing levels reported in two different government platforms resulted in divergent overall reported levels. A separate study in 2014 from the Center for Public Integrity found similar results.
In its investigation, PennLive evaluated Nursing Home Compare data against reimbursement report data. Nursing Home Compare is the public website run by the Centers for Medicare & Medicaid Services (CMS) and is used by consumers searching for nursing homes. The website displays property staffing levels that are derived from an annual survey in which nursing homes self-report their staff levels for the previous two weeks.
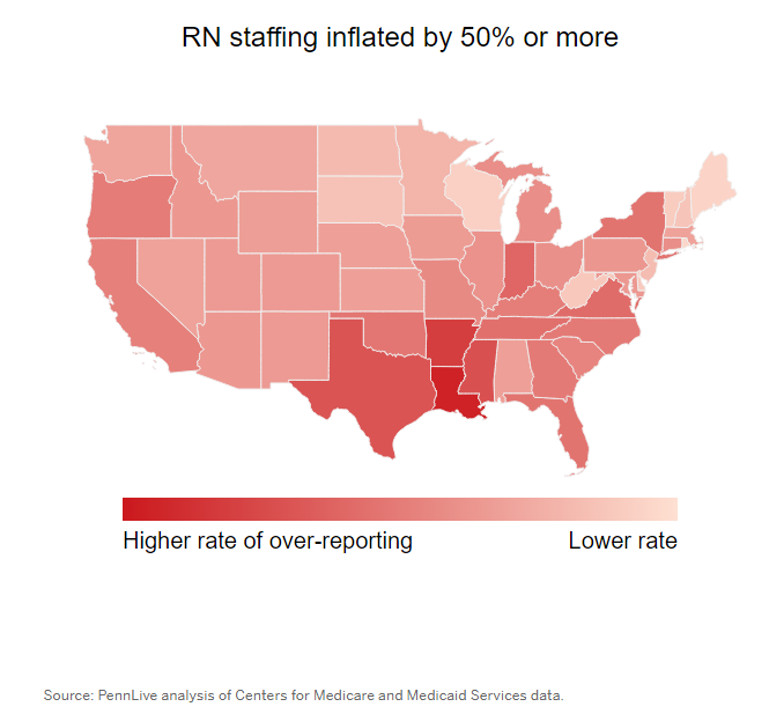
Nursing Home Care reported that the national average of minutes worked per patient day was 44 minutes in 2014, according to the investigation. In the reimbursement reports, the national average was only 32 minutes of staff hours worked per patient per day. In the PennLive study, the Nursing Home Compare data was inflated by 50% compared to the reimbursement report data for almost half of the properties in the 11,000 property study. This inflation appears to be worse in southern states and for registered nurse hours.
PennLive accuses Nursing Home Compare of providing “wildly inaccurate staffing information to the public.” The investigation hypothesizes that the inflated numbers are the result of a lack of data audits. Another hypothesis is that some nursing homes may “staff up” during the times they expect an inspection, thereby creating an illusion of higher staffing levels year-round. Conversely, in reimbursement reports, nursing homes divulge to CMS how much they actually spent on labor.
The PennLive investigation prompted many responses. Dr. Gifford of the American Health Care Association cautioned that the two-week snapshot of staffing used to report to Nursing Home Compare cannot be perfectly extrapolated to the total annual work hours. Charlene Harrington, a labor advocate, argues that the comparison of the two data reports holds, because the pattern is consistent and the difference between the two sets of data is significant.
In the end, some of the discrepancies found by PennLive’s investigation could be corrected as Nursing Home Compare moves to a system of payroll-based journaling (PBJ) for recording staffing levels. Providers began giving CMS this data in July, although the agency has not disclosed when Nursing Home Compare will begin displaying the data to the public.
Nursing Shortage Leads to “Extraordinary Circumstances”
The availability of appropriate labor is another issue creating staffing complications. The Bureau of Labor Statistics (BLS) recently reported that nationwide nursing shortages are predicted to continue until 2024, according to a memo from CMS. In the memo, CMS announced that because of this predicted shortage, hospice providers will be allowed to continue using contracted labor in circumstances where regulations would normally require providers to employ direct-hire nurses.
To use CMS’ words, the “extraordinary circumstances” created by the nursing shortage spurred the agency to extend the allowance of contract labor through 2018. Hospices and nursing homes usually employ the same types of labor, so if the hospice sector experiences this labor shortage crisis, skilled nursing providers could as well.
High Workplace Injury Persists in Nursing Home Setting
Yet another factor putting pressure on skilled nursing staffing is workplace injury. BLS data released on October 27, 2016, showed that nursing home employees consistently experience higher incidences of workplace injury, compared with employees in other sectors.
For private nursing home and residential care providers, there were 6.8 events for every 100 full-time workers. The only job categories with higher incidences of workplace injury in the private sector were animal production and couriers and messengers, with 6.9 events per 100 full-time workers. For context, the rate for mining was only 2.6, and the rate for heavy and civil engineering construction was 2.8. Such high rates of injury in nursing homes can act as a deterrent for eligible workers to enter this field. At the very least, they may discourage certain workers from choosing employment in nursing homes and residential facilities when they can do the same or similar work in a relatively safer environment, such as a physician’s office or hospital.
One bright spot is that the rates of workplace injury in this sector actually decreased from 2014 to 2015, according to McKnight’s. In 2014, the rate was 7.1, so the sector saw a modest decrease. However, McKnight’s also noted that the only employment sector with double-digit workplace injury in 2015 was state-run nursing homes and residential care properties. Not only does workplace injury discourage employees from working in this sector, but it can lower productivity, result in higher turnover, and cost the operator in terms of work hours lost and compensation paid. Workplace safety could continue to be a pressure point that the industry will need to consider in addressing labor and workforce issues.
High-Skilled Nursing Home Employees Seeing Pay Bumps
The sector is making investments in labor. Data reported by the Hospital and Healthcare Compensation Service released in September found that physical therapists working in long-term care settings earned the highest pay increase of all physical therapist employment settings. The bump for long-term care physical therapists was 3.78% from 2015 to 2016, compared to only 0.48% for physical therapists working in home health agencies, according to McKnight’s. This increase in wages for physical therapists, as well as for other rehabilitation therapists, according to McKnight’s, may hint at operators’ increased focus on post-acute care.
Massachusetts Gives Nursing Home Workers a Bonus—Or Not?
While operators appear to be investing in labor for higher-acuity patients, such as physical therapists, at least one state has made a similar investment in nursing home wages.
In Massachusetts, nursing homes will earn an average $90,000 add-on payment from the state for increasing wages. However, an editorial in the Boston Globe argues that the amount was not significant enough for workers to see a dramatic pay increase, especially considering that the state will not regulate how nursing homes spend the add-on payment. Nursing homes must report the spending, but the figures will be made public only after the fact, which the Globe warns is a risky proposition.
Bottom Line: Labor Issues Will Persist without Action
Massachusetts’ bonus payment may or may not be sufficient to make a huge impact for employees in the state’s nursing homes, but the gesture is still a significant example of action being taken to address skilled nursing’s labor issue. Wage rates and workplace safety are contributing to understaffing that can affect quality of care, create unpleasant work environments, and further exacerbate labor issues operators face. Staffing issues will likely continue unless the industry, its government partners, and all relevant stakeholders make thoughtful strides to make the sector more attractive to employees.[/expand] [cresta-social-share]
Seniors Housing & Care Industry Calendar
January/February 2017:
30-1 AHSA 2017 Annual Meeting, Palm Springs, CA
March 2017:
22-24 2017 NIC Spring Investment Forum, San Diego, CA

Be sure to save the dates for both 2017 NIC conferences!
Also note the change in days for the NIC Fall Conference, which will begin on Tuesday rather than Wednesday, and will end on Thursday.
NIC Partners
We gratefully acknowledge our following partners: