Making Connections and Transforming Lives: A Conversation with Benchmark’s Tom Grape
 Rarely does a resident or family member write a letter to Tom Grape thanking him for Benchmark Senior Living’s clean, well-appointed buildings, beautiful grounds, and great food. That’s what people expect. Delighted customers instead write to him about their wonderful experience at Benchmark communities because of the connections they’ve made with the staff who become like members of their own family.
Transforming Lives Through Human Connections is, in fact, Benchmark’s purpose and has been since it was founded 25 years ago. NIC Chief Economist Beth Mace recently had the chance to discuss the success and future plans of Waltham, Massachusetts-based Benchmark with its Founder, Chairman and CEO, Tom Grape.
Here is a recap of their conversation.
Mace: Tom, you and I have known each other for more than 20 years; first when I worked at AEW Capital Management when they were a capital partner for Benchmark in the late 1990s, and for the past many years in my role at NIC. You have been on many panels for NIC and have provided your insights, wisdom, and experience to many. Thank you for taking time over the many years to share your thoughts with NIC’s stakeholders. Thank you once again as you share your thoughts now in NIC’s monthly NIC Insider newsletter. Can you tell our readership more about Benchmark?
Grape: We currently own and operate 63 communities in seven states: Connecticut, Maine, Massachusetts, New Hampshire, New York, Rhode Island, and Vermont. We offer independent living, assisted living, memory care, and continuing care.
Mace: Tell us more about Benchmark’s mission statement.
Grape: Our purpose is to “Transform Lives Through Human Connection.” That statement not only describes our purpose with residents, but also with families and associates. That one phrase captures the experience we are trying to provide to our different constituencies. It’s something we talk about a lot. We want to take people from being satisfied to being delighted. It’s not just about great care or a beautiful building. It’s about the connections people make so they enjoy the people and passions that make life so special. Anything we can do to support the relationships among our staff, residents, and families helps foster the human connection. That is how we delight the people we touch.
Mace: Labor is a big issue. How does the labor shortage factor into your approach?
Grape: We must pay competitively and offer good benefits, as well as help our associates grow professionally and offer clear career paths. That said, a lot of what keeps people working in this field and attracted to it is the purpose of their work. People are called to this work because of its meaning and how it impacts the lives of others. They also need to be recognized for their work and have good relationships with their colleagues and supervisors. We have to be competitive but also keep the purpose of the work in front of them without getting bogged down in too much red tape. I strongly believe that is why Benchmark has been named among the Boston Globe newspaper’s top places to work for each of the 14 years they’ve had the award. We’ve been recognized by other groups as a top employer as well. We work hard on this. Providing purposeful work is what ultimately will prevail in this labor market.
Mace: Now, let’s dig a little bit into operations and the pandemic. How did you fare during the worst of the pandemic? And how is the Omicron variant affecting your residents, staff, and overall census today?
Grape: We got hit hard by the pandemic in May to June 2020 like the entire senior living industry and healthcare, for that matter. We made the important decision to close our community to new move-ins early in the pandemic, as safety was our paramount concern. We were closed for five months to move-ins, and that had a tremendous impact on us. However, once the vaccines became available at the end of first quarter of 2021, occupancy has been on straight line up. Three of our highest net move-in occupancy months have been in 2021. We picked up 11.5 points of occupancy in 2021. We’ve had a phenomenal rebound of occupancy in the last nine months. We attribute it to a combination of things, including our credibility related to how we managed the crisis. We were proactive and transparent in communications with families and regulators. We put together a first-class advisory council with a former U.S. Surgeon General and other topflight people who advised us. We required our associates to be vaccinated last spring before a lot of other providers. We worked hard to maintain our inventory of personal protective equipment. The Omicron variant has been challenging but not as significant a disruption as previous waves of the pandemic. Most importantly, because of the vaccines, including boosters, most cases have shown no symptoms or less severe symptoms.
Mace: Have you had to slow move-ins or use outside agencies to fill staffing gaps?
Grape: We’ve brought in some agency workers. But we have not had to halt new move-ins. We’re seeing a decline in cases. We expect a couple months of some added expenses, but we are managing through the situation.
Mace: Expenses across many line items are going up—insurance, labor and staffing, material costs, and more. All of these factors are squeezing margins. How are you withstanding these pressures?
Grape: All expenses are going up. Everyone understands the current economic environment, including extreme inflation and the cost of labor, so families and residents were not surprised when we implemented reasonable price increases recently. These increases helped offset the costs of implementing a minimum wage increase to all associates of $15 an hour and $17 for frontline caregivers. Of course, rates are higher in some markets. But announcing these wage floors was well received by the staff and residents. It helped soften the rate increase for residents. We had also been charging the last month’s rent at move-in, and we stopped that. We refunded the last month’s rent at the same time we announced the wage and rate increases. It helps take the sting away.
Mace: What is your development pipeline today? How do you choose markets? How was development affected by COVID-19?
Grape: We are active in development. We opened four projects last year. One is under construction now and three more will start this year. We have an active pipeline for the next several years. We are committed to development.
Mace: Where do you see development opportunities?
Grape: We have always seen our footprint as the area from Boston to the Washington, D.C. corridor. There is still unmet demand in select Northeast markets. We are concentrated in the northern portion of our footprint. But we are about to start a development in the Washington, D.C. market. We are focusing more on filling out our portfolio in the southern half of our footprint.
Mace: Over the years, Benchmark has had more than one capital partnership. What do you look for in a good capital partner?
Grape: Over our history, we’ve probably had 15 different joint-venture partners. Some of our current capital partners are repeat partners. They have different investment objectives. Some want stable properties, some like development, some prefer CCRCs. Right now, KKR is by far our largest capital partner for 50 of our 63 communities.
Mace: With the oldest baby boomers now 75, is Benchmark looking at investing in the active adult segment?
Grape: We are not. Our view is that we add value as an operator. Active adult is more of a straight real estate play. The value we add would make less difference in active adult than the property types we are in today.
Mace: How are you integrating healthcare into your communities?
Grape: We have some close relationships with local hospitals and several medical healthcare institutions. McLean Hospital is working with us on our memory care communities. Further healthcare integration is part of our strategy going forward. We are not yet participating in Medicare Advantage plans but, clearly, they are inevitable in our future as is work with Institutional Special Needs Plans.
Mace: Are you looking to address the care and housing needs of what NIC calls the “Forgotten Middle”?
Grape: We’ve opened three communities branded as The Branches. These are smaller buildings with more companion units. Two of the communities opened right before COVID-19 hit. Move-ins were stalled, but the buildings have filled up nicely since the vaccines were introduced. We plan to build more of these communities. The Branches is not a true middle market product, but the rents are lower than those at our market rate communities. We are trying to figure out if we can do something tailored for the real middle market. We don’t think we have cracked that code yet.
Mace: As senior housing products diversify, are you planning to expand your portfolio to target the ultra-wealthy?
Grape: We’re exploring other parts of the market. High-end urban properties are an experiment still to play out. We are open to other segments of the market.
Mace: In wrapping up, what’s next, and how are you positioning yourself for growth in the 2020s?
Grape: We are focused on resident experience as we improve our offerings. In terms of staffing, we want to continue to be an employer of choice. Our minimum wage announcement was significant. We continue to add mental health offerings for our associates during this difficult time. We are focused now on getting occupancy back to where it was pre-pandemic and growing our core business. We’ve taken a big step forward on the occupancy front, and growth will continue. Clarifying and diversifying our product offerings and preparing for further integration with the healthcare system is front and center. We’ve had a great 2021, and we’re bullish about 2022.
To learn more about Benchmark Senior Living, its branding, and Tom’s leadership of the organization, you can view his NIC Talks video.

Executive Survey Insights Wave 36: December 6, 2021 to January 9, 2022
by Lana Peck, Senior Principal, NIC
NIC’s Executive Survey of operators in seniors housing and skilled nursing is designed to deliver transparency into the market fundamentals as conditions continue to change. Since March 2020, at the beginning of the pandemic, NIC Analytics has received more than 3,200 completed questionnaires. These survey responses have allowed NIC to provide real-time insights into the impact of the pandemic, the delta variant, the pace of recovery, and now the Omicron variant.
The “ESI” is the longest-running industry survey offering time-series data on specific market fundamentals and trends influencing our sector. This Wave 36 survey report for the NIC Insider includes responses from December 6, 2021, to January 9, 2022, from owners and executives of 66 small, medium, and large seniors housing and skilled nursing operators from across the nation, representing hundreds of buildings and thousands of units across respondents’ portfolios of properties. More detailed reports for each “wave” of the survey and a PDF of the report charts can be found on the NIC COVID-19 Resource Center web page under Executive Survey Insights.
Move-Ins Accelerated for Assisted Living and Memory Care in Wave 36. The pace of move-ins in independent living declined over the past four waves of survey data. In contrast, the pace picked up in assisted living and memory care, suggesting a slight slowdown for choice-based seniors housing and an increase in needs-based moves. (The slowdown in independent living may be due to typical seasonality patterns.) Roughly one-half of organizations with assisted living and/or memory care units reported an acceleration in the pace of move-ins (51% and 49%), compared to just over one-third with independent living units (37%). Fewer organizations with nursing care beds reported an acceleration in the pace of move-ins since the previous survey (33% vs. 44%). Considering the pace of move-outs in the past 30-days, no change was reported by the majority of organizations across care segments (65% to 68%). However, roughly one-quarter of organizations with nursing care beds and/or memory care units reported an acceleration in the pace of move-outs.

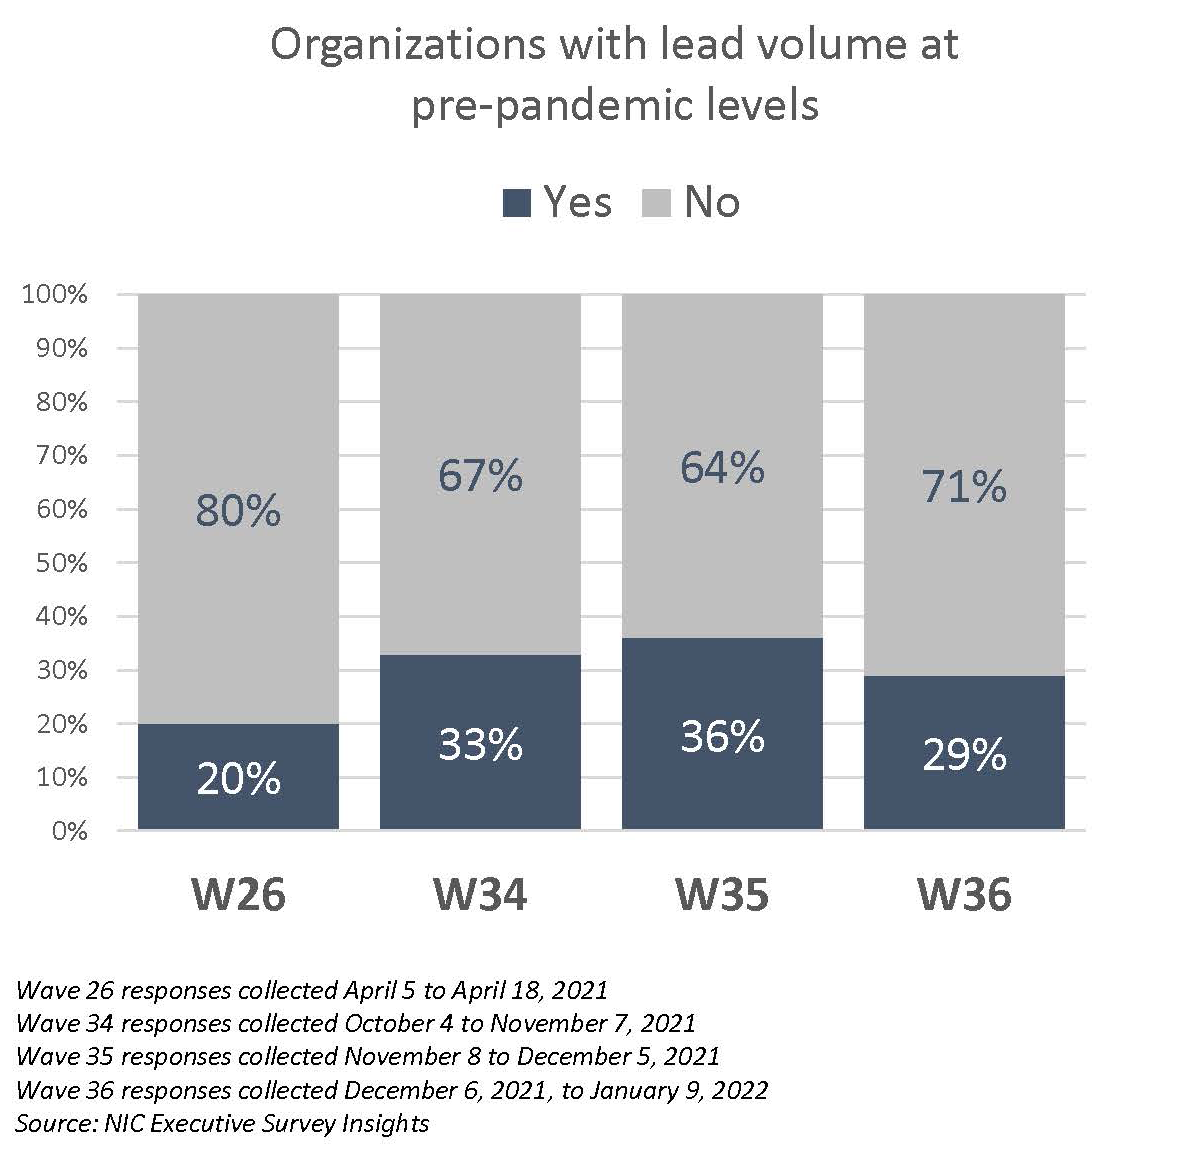
Few Organizations Have Pre-Pandemic Lead Volumes. Given pent-up demand coming out of the pandemic and questions about the sustainability of historical and near historical absorption rates during the third and fourth quarters of 2021 per NIC MAP Vision data, this measure in the ESI may be a leading indicator to watch with regards to occupancy recovery. As shown in the chart, lead volume was benchmarked in Wave 26, with data collected at the beginning of the second quarter of 2021. Although the pace of move-ins across care segments was brisk during the past two quarters, and occupancy rates as reported by NIC MAP Vision improved, just under one-third of organizations (29%) indicated that their leads volume is currently at pre-pandemic levels in Wave 36–down from 36% in the prior survey, but higher than 20% in the early April 2021 benchmark.
Occupancy Recovery Timing Expectations Lengthening. In Wave 36, one-half of respondents expect their organization’s occupancy to return to pre-pandemic levels this year (52% down from 73% in Wave 33), and just over one-third now believe it will recover some time next year (38% up from 8% in Wave 33).

Use of Agency/Temp Staff Increasing. Nearly all operators (98% – 100%) responding to NIC’s Executive Survey Insights conducted since July reported staff shortages. In the Wave 36 survey, four out of five organizations with multiple sites (83%) reported staff shortages in more than half of their properties—up from roughly one-half (46%) in the Wave 24 survey conducted mid-March. Attracting community/caregiving staff and employee turnover remain significant challenges for survey respondents. When asked how they are backfilling staffing shortages, 97% – 100% of respondents cited overtime hours since Wave 25 (data collected between March 22, 2021 and January 9, 2022). Currently, 89% of organizations are tapping agency or temp staff—up from 77% in the prior survey.
Fewer Respondents Expect Operating Margins to Decrease. One-half of respondents (52%) in Wave 36 anticipate their organization’s operating margins will improve in the next six months. One-third (32%) expect a 1% to 5% increase, and an increasing share (16%) anticipates growth between 6% and 10%. While rising wages, insurance premiums, and maintaining infection control measures will continue to be mitigating factors, other factors supporting NOI growth going forward are predicated on anecdotal reports of operators beginning to implement rate increases to counterbalance pandemic and recovery-related cost pressures.

Owners and C-suite executives of seniors housing and care properties, please help us tell an accurate story about our industry’s performance. The ESI 2022 questionnaire has been shortened from prior surveys. Some standard questions will remain for tracking purposes, such as the pace of move-ins, rent concessions, and staffing. Every month, with each new survey “wave,” a new question or two will be added as per respondents’ suggestions.
Wave 37 of the Executive Insights Survey is available until Sunday, February 6 at midnight and takes five minutes to complete. If you are an owner or C-suite executive of seniors housing and care and have not received an email invitation to take the survey, please get in touch with Lana Peck at lpeck@nic.org to be added to the list of recipients.
NIC wishes to thank survey respondents for their valuable input and continuing support for this effort to provide the broader market with a sense of the evolving landscape as we recover from the pandemic.

Senior Housing Demand – Deep Dive and Outlook
by Beth Mace, Chief Economist & Director of Research & Analytics, NIC and Omar Zahraoui, Data Analyst, NIC
The second half of 2021 will be remembered as a time of rebounding demand for senior housing as it registered the strongest unit improvement of net positive absorption, as measured by the change in occupied stock, since NIC MAP began reporting the data back in 2005. Not surprisingly, however, the pace of recovery varies by market and by property type.
In this NIC Insider article, we review how individual senior housing markets and properties are faring after three consecutive quarters of positive demand growth or net absorption since 1Q 2021. Further, we provide a demand outlook of when occupied units for the NIC MAP Primary Markets aggregate could return to pre-pandemic 1Q 2020 levels. Note that this analysis looks at demand only and does not take into account inventory growth and properties under development.
Exhibit 1 below depicts the 4Q 2021 NIC Analytics Demand Pulse Metric (DPM), a measure that examines senior housing demand (occupied units) for the NIC MAP 31 Primary Markets and provides a window into the strength of a market based on occupied stock trends. The demand pulse metric pinpoints when 4Q 2021 demand levels were last seen before the pandemic began to influence the senior housing sector in 1Q 2020 and tracks demand growth and progress across the 31 Primary Markets.
Aggregate Market Demand Pulse. 4Q 2021 NIC MAP Data, powered by NIC MAP Vision, showed that positive demand momentum continued for the 31 NIC MAP Primary Markets, with over 9,000 units absorbed on a net basis, a 1.7% increase from the prior quarter. This second largest gain on record in a single quarter grew occupied units back to their pre-pandemic 1Q 2019 level (or 2Q 2020 level after the pandemic began to influence the senior housing sector). In other words, it was the level of one year (4 quarters) prior – counting back from pre-pandemic 1Q 2020 levels – that occupied units equaled the level achieved in 4Q 2021. Although senior housing demand for the NIC MAP Primary Markets have had three consecutive quarters of real momentum and consistency, the 4Q 2021 occupied stock was still 3.1% below pre-pandemic 1Q 2020 levels, equivalent to 17,700 units.
To provide additional context for the remarkable demand momentum in the last three quarters, 1Q 2021 marked the lowest level of occupied units since NIC began to report data in 2005, as about 42,100 units were “vacated” in the immediate aftermath of the pandemic (1Q 2020 to 1Q 2021). Back then, the senior housing occupied units fell to its 1Q 2017 level, however, demand growth in the last three quarters equaled the positive gains of two years prior to the onset of the pandemic. Further, over the period from 1Q 2021 to 4Q 2021, occupied units grew by 4.6%, equivalent to over 24,400 units absorbed on a net basis.
Market-Specific Demand Pulse. In 4Q 2021, the level of occupied units across five of the 31 NIC MAP Primary Markets had fully recovered and exceeded pre-pandemic 1Q 2020 levels. These markets include Washington, DC, Atlanta, Minneapolis, New York, and Kansas City. Notably, 4Q 2021 occupied units in Washington, DC and Atlanta exceeded pre-pandemic 1Q 2020 levels by 2.8% and 1.5%, respectively, the largest improvements across the 31 Primary Markets.
Additionally, occupied units across 7 of the 31 NIC MAP Primary Markets followed a relatively fast path recovery. This includes Boston and Phoenix (same as 4Q 2019); Dallas, Cleveland, Detroit, and Houston (same as 3Q 2019); and Sacramento (same as 2Q 2019). Note that this demand analysis does not take into account inventory growth and suggests that, without additional supply being added in these markets, their recovery would be quick due to strong demand characteristics.
However, the recovery timelines continued to be uneven and relatively slow across several markets. This is the case for Pittsburgh, where the number of occupied units remains far below levels reported since at least 2005, when NIC began reporting data. Similarly, the number of occupied units in Los Angeles remains below 1Q 2020 levels by almost eight years and is now at levels seen in 1Q 2012, and San Jose remains seven years below 1Q 2020 levels and is now at levels seen in 1Q 2013. Notably, 4Q 2021 occupied units relative to 1Q 2020 levels in Los Angeles stood at negative 8.5%, the lowest rate of change across the 31 Primary Markets, while 4Q 2021 demand in Pittsburgh remains 3.3% below 1Q 2020 levels. Although not the lowest rate of demand, demand patterns in Pittsburgh have been relatively slow historically.
Exhibit 1 – 4Q 2021 NIC Analytics Demand Pulse Metric (DPM) for Senior Housing

Operator Size Demand Pulse. Exhibit 2 below depicts the level of senior housing occupied units for the NIC MAP Primary Markets in 4Q 2021 relative to 1Q 2020 by operator chain size. Interestingly, medium operators (those with 5 to 9 properties), large operators (10 to 24 properties), and very large operators (25+ properties) outperformed small operators (2 to 4 properties) and single-property operators. Medium and large operators are doing reasonably well. In fact, the level of occupied units in 4Q 2021 exceeded the pre-pandemic 1Q 2020 level by 1.3% for medium operators and was nearly the same as the level seen in 1Q 2020 for large operators at negative 0.3%. Occupied units for very large operators remained 1.6% below the pre-pandemic 1Q 2020 level but 1.5 percentage points ahead of all senior housing operators (negative 3.1%).
Conversely, the level of senior housing occupied units for single-property operators and small operators (2 to 4 properties) within the NIC MAP Primary Markets remained far below their pre-pandemic levels with negative 9.0% and negative 4.9%, respectively.
The course of demand growth and the noteworthy disparity in recovery across operators with respect to size is likely to be linked to a number of factors, including but not limited to the depth of the demand contraction earlier in the pandemic, consumer confidence, labor supply, inventory growth (newly opened properties), and the overall economy. But part of what has helped some operators outperform others has been captured in other NIC data sources, such as the Executive Survey Insights (ESI).
Wave 36 of the ESI (from December 6, 2021 to January 9, 2022) showed that offering rent concessions and free rent for a specific period of time to new residents often helped drive increases in occupancy, thus demand. Notably, only 14% of single-property operators were offering rent concessions, the lowest share reported among operators. While large and medium operators reported the largest shares at 75% and 50%, respectively, followed by very large operators with 44%.
The Executive Survey Insights is a bi-weekly survey of senior living operators, providing real-time insights on hundreds of buildings and thousands of units across the country every two weeks since near the beginning of the pandemic. If you are an owner or C-suite executive of seniors housing and care and have not received an email invitation to take the survey, please contact Lana Peck at lpeck@nic.org to be added to the list of recipients.
Exhibit 2 – 4Q 2021 Occupied Units Relative to Pre-Pandemic 1Q 2020 Levels – By Operator Size

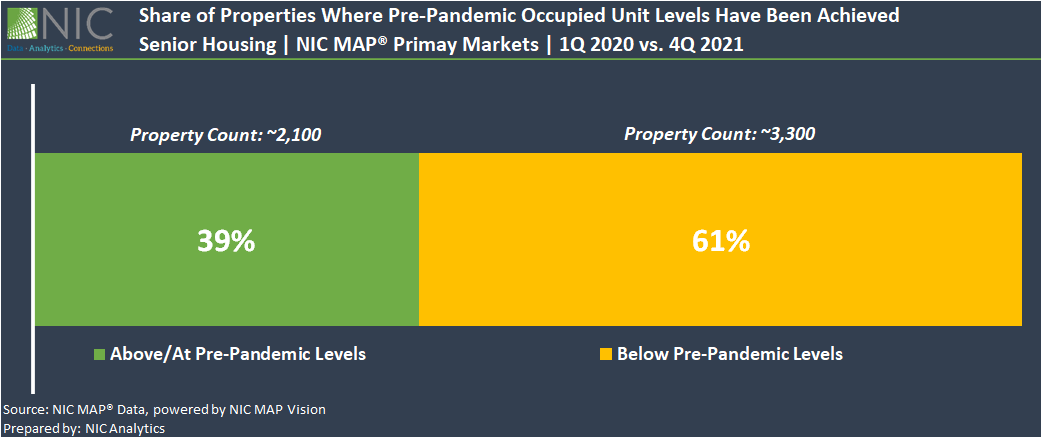
Property Level Demand Pulse. Exhibit 3 below shows that pre-pandemic 1Q 2020 occupied unit levels have been achieved or surpassed across 39% (equivalent to roughly 2,100 properties) of senior housing properties within the NIC MAP Primary Markets aggregate, up 3 percentage points from the share recorded during the prior quarter in 3Q 2021 of 36%. By contrast, the number of occupied units within 61% (about 3,300 properties) of senior housing properties in 4Q 2021 remained below pre-pandemic 1Q 2020 levels, also an improvement of 3 percentage points compared with 3Q 2021 (64%).
These demand statistics indicate once again that the recovery differs across markets and properties. COVID-19, access to capital, low margins due to low occupancy rates, and staffing challenges compounded this issue of uneven recovery, which will likely persist in 2022. However, as demand fully recovers and returns to pre-pandemic levels, the market should begin to balance out.
Exhibit 3 – Share of Properties Where Pre-Pandemic Occupied Unit Levels Have Been Achieved
Senior Housing Demand Outlook. Exhibit 4 below provides two different scenarios of demand outlook to gauge when senior housing occupied units for the NIC MAP Primary Markets Aggregate will likely return to pre-pandemic 1Q 2020 levels.
- Scenario 1 – Over the period from 1Q 2021 to 4Q 2021, the past three quarters of positive net absorption, the quarterly growth in occupied units for the 31 Primary Markets averaged 1.5% (quarter-to-quarter). Assuming on this quarterly demand growth measure, occupied units would likely recover and return to 1Q2020 levels by Midyear 2022 (2Q 2022). Scenario 1 could be considered as the optimistic scenario, where the shape of the demand downturn and recovery are more symmetrical.
- Scenario 2 – Another way to assess senior housing demand outlook for the NIC MAP Primary Markets Aggregate is to look at historical patterns (pre-pandemic). For the sake of this analysis, we chose a five-year period. Over the period from 1Q 2015 to 1Q 2020, the five years leading up to the pandemic, quarterly growth in occupied units for the 31 Primary Markets averaged 0.6% (quarter-to-quarter). Based on this more “conservative” scenario, occupied units would likely recover and return to pre-pandemic 1Q 2020 levels by 1Q 2023.
Note that is only a demand analysis and does not take into account new supply and properties under development.
Exhibit 4 – Senior Housing Demand (Occupied Units) Outlook

This deep dive into recent trends and the near-term outlook is based solely on senior housing demand patterns. The concept of aggregate demand or the number of occupied units is critically important to evaluate senior housing markets’ recoveries.
Interested in learning more about NIC MAP data? To learn more about NIC MAP data, powered by NIC MAP Vision, and about accessing the data featured in this article, schedule a meeting with a product expert today.

NIC Skilled Nursing Boot Camp: Evaluating the Investment Landscape
New to NIC’s professional development offerings, the Skilled Nursing Boot Camp: Evaluating the Investment Landscape will offer participants an in-depth perspective on how value is created in skilled nursing. The course is designed for those new to the industry as well as those who wish to stay current in underwriting skilled nursing properties. It will orient participants to the nuances of skilled nursing. Participants will be able to understand the unique risks associated with skilled nursing and how they may be mitigated.
NIC will host the NIC Skilled Nursing Boot Camp: Evaluating the Investment Landscape course, on Wednesday, March 23 from 8:00 AM to 12:00 PM CST at the Omni Dallas in Dallas, TX and adjacent to the 2022 NIC Spring Conference.
Developed in conjunction with the NIC Future Leaders Council, the event is structured around a case study grounded in today’s reality that will expound on options from a property owner’s perspective. Participants will hear mock offers and pitches for consideration to determine if they should sell the property, hold the property, and/or retain a new operator.

Prior to and during the course, participants will receive an overview outlining skilled nursing industry trends, from both operators and investors, who will outline key factors for consideration. During the engaging 4-hour course itself, experts will detail approaches on how to analyze the decision. Topics include:
- Industry Overview
- Skilled Nursing Historical Trends
- Investment Considerations
- Operational Considerations
- Capital Market Structure
The courses’ participants will work together in small groups to discuss their prospective options and then collectively decide whether to sell, hold, and/or retain a new operator. Before the course concludes, the small groups will share their respective decisions and rationale with the other groups to gain additional perspectives. The day concludes with a networking reception taking place that evening starting at 5:30 PM CST.
The Skilled Nursing Boot Camp is currently open for registration.
