Filling an Underserved Niche: A Conversation with Sevy Petras, CEO, Priority Life Care
 Sevy Petras has foresight. She recognized more than a decade ago, and long before many others, that affordability would be a big issue in senior living. So after a career in banking, she set out to create affordable assisted living properties. She also had the insight to fill market gaps where demand for certain products was not being met. Today, her company, Priority Life Care, operates 44 communities in 13 states.
NIC Chief Economist Beth Mace recently talked with Petras about her successful approach and where she sees new opportunities. What follows is a recap of their conversation.
Mace: Priority Life Care is a family-owned business for which you are the CEO. Can you tell our readers about Priority Life Care (PLC), its roots, and its mission?
Petras: We launched PLC about 13 years ago. But I started in the industry supporting senior housing operators from the banking and bond side. I got laid off during the Great Recession and took a break. My mom was an administrator at a private pay senior living building in West Virginia and would tell me about residents who ran out of money and had to go to a nursing home. Most people assumed there was a program that would pick up the cost so they could remain in place. They didn’t understand that only certain states, such as Illinois, offered a Medicaid waiver program to remain in private pay assisted living. Most people would end up without a choice. PLC evolved from watching my mom’s discouragement from not being able to help her residents and families and from understanding the statistics of the wave of seniors that was coming who would need care and it was going to be expensive. I thought there must be other states besides Illinois with Medicaid waiver programs. With my banking background, I reverse engineered the numbers. Ohio and Indiana launched some programs in 2009 to pilot Medicaid waivers, and the rates were fairly good. PLC evolved and grew from finding a need that no one was serving and understanding revenue sources and expenses.
Mace: How did your family get involved?
Petras: I needed a team. My mom was an administrator, my sister-in-law was a social worker, and my brother was a turnaround guy in the cell phone business. My family joined me with no salaries but the promise of getting paid later. We put together a business plan. I knew the cost of labor and other expenses like food. The only cost that we could control was the cost of the real estate. We needed to find buildings that made economic sense. I went to a former client who had a couple communities in Illinois looking to expand. We identified properties that met our criteria for lower mortgage payments. We got our first buildings in 2010. We were opportunistic to buy at the right price. As a family and team, we had no room for failure.
Mace: How did you pick the name Priority Life Care?
Petras: When we sat around the Thanksgiving table and I convinced my family to work with me for free to create an affordable product, the name was a big deal. Our mission originally was to light the way in affordable senior housing. Our mission eventually morphed to include turnarounds and finding solutions for underperforming communities to meet market demand. Our priority has been to support the independence of residents and the financial independence of our communities. We did not want to use the word “senior” in our name because that says “age.” What we are really doing is taking care of someone’s life. The priority is finding purpose, and independence.
Mace: What else is a priority?
Petras: My priority is to our associates to make sure they have the tools they need to perform their duties to take care of residents and follow regulations. When I visit communities, I like to tell the staff how important their jobs are. The dishwasher who provides a clean plate is important because he is allowing the resident to have a healthy and safe meal. That’s such an important job to give that to somebody. The same holds true in the back office. Paying the bills ensures that residents will have light, heat, and cooling, and that their TV and phones work. The staff is supporting the independence of seniors. We are all doing our part to support one another in this ecosystem.
Mace: How many buildings do you operate?
Petras: We operate 44 communities, and we are adding a few more soon. We are in 13 states. We started with a Medicaid waiver model and private pay affordable model in secondary and tertiary markets. In some markets, we have market rate projects.
Mace: Do your affordable buildings have a lower cost basis?
Petras: We cut our teeth in the business by identifying the highest and best use of a product in a market. A 25-year-old building can’t compete with the amenities in a new building. But we have dependable care. A competitor may offer a one-bedroom unit for $3,500 a month. But we are a value at $3,000 a month. We’re not always the lowest priced option, but the best value comparing square footage, care level, and amenities. We’re good at helping investors identify the best and highest use of a community while understanding how much money they’re willing to put into it.
Mace: Does the consumer get the same services?
Petras: It depends. If no one in a market is offering high acuity assisted living, we might create a specialized neighborhood that allows residents to remain in place but with appropriate dining and programming. Or we might want to offer assisted living light. Our main job is to figure out how we can provide the best value proposition. We want to fill an unserved niche rather than straight out compete.
Mace: How do you find new market niches?
Petras: It’s all about boots on the ground. You have to physically walk the building and evaluate the competitive landscape to figure out where the gaps are. That’s especially true in places that are overbuilt like Atlanta. You have to find out why the property lost a potential resident. Where did they go? Was the potential resident’s acuity too high? Or a wander risk? Maybe it’s an easy fix to add a high acuity or memory care wing. You have to understand whether there’s a better use for the building and whether services can be added to address market demand.
Mace: Given current market realities, will there be more turnaround opportunities?
Petras: Over the next 18 to 24 months, it will be necessary for banks and capital partners to look at their inventory and try something different. The important factors are the team on site, leadership, and programming. Post-COVID, family and residents are ready to move on. They are really attuned to why they are coming to us. Care is a big aspect. But we must have engaging programming and offer something beyond three meals and bingo. We have had to get more creative to prove that we’re doing everything we can to engage residents from a life perspective.
Mace: What differentiates PLC from other senior living companies?
Petras: We are a family business, and, as an underdog primarily focused on Medicaid reimbursement, we have never believed that we know it all. We have always had a collaborative approach with other people. We learn from other operators and share best practices. We collaborate with our vendors. We respect people. There are times to be stern, but never a time where it’s ok to be ill-mannered. It’s part of our mantra.
Mace: You’re passionate about a lot of things! One is trying to create an affordable senior housing offering. How do you approach affordability?
Petras: I’m excited that NIC is taking an interest in affordability and trying to figure this out. A Medicaid waiver program is needed in every state. The Low-Income Housing Tax Credit program should allow for new buildings that take the Medicaid waiver. Every project has to make sense financially. Even nonprofits have to support themselves. Also, the affordable product has a stigma that it is a lesser product. Lenders and capital providers need to move away from that thinking. Care is now a big part of what we provide post-COVID. We need care to be supplemented by Medicare or government help. There should be a solution somewhere in the middle between private pay senior living and facilities reimbursed by Medicaid.
Mace: Are you able to maintain a margin in your affordable product despite rising costs for virtually everything?
Petras: Yes, 100%. We maintain margins from four perspectives. We close our books and make the financials available to the team on first day of every month. It’s important to provide those numbers to our regional leaders and executive directors so they can make real time adjustments for that month. If they get reports on the 15th, that month is gone. We’re able to make adjustments based on occupancy, profit and loss, and balance sheet statements on a real time basis. Secondly, every department manages expenses. When we put our pro forma together, we include every department to get their buy in otherwise we cannot execute on the plan which also includes our profit margin goals. Thirdly, we incentivize our team to execute on our plan. And lastly, we work with our vendors as partners. We manage all kinds of buildings. We explain to vendors our price points and the type of product we are offering. Vendors will work with you. We can’t do everything ourselves.
Mace: PLC has been able to re-invigorate properties that have fallen into stress, or properties in a workout mode. Have you had a lender come to you and ask you to bring a property out of distress?
Petras: We did have an instance where we managed a couple communities, and the owner didn’t pay the bills. The lender agency said it would take back the building and underlying debt. A capital partner with some equity in the building said the buildings were performing better than they had and asked if we would stay on and manage the buildings if the equity partner bought them. We stayed and managed the properties. That happened fast. But what I have seen historically is that receivership can take a long time. My job as a receiver is to execute the bank’s goals. And usually that means to lose the least amount of money. They are not in the business of owning licensed assisted living properties. There’s a limited number of resources when the bank is the owner. Resident safety comes first. We have to make sure the staff is coming to work. But the bank is not looking to hold the property. They know they will have to take a discount at sale time. It’s a matter of how much capital they have to put in and how much they can get out.
Mace: Our readership includes younger professionals starting off in their careers. What advice can you provide to them, especially to young women?
Petras: I rely on collaboration from my colleagues. Some of my friends are CEOs, CFOs, or executives who are a little bit older. I’ve learned that we need to give ourselves permission to say that what we are doing is important and, when your kids are older, they will have a bigger respect for you. It’s important to show your son that women can hold executive positions. Girls see that they can do that too. It’s okay to show your team at work that you’re human and not a super woman. There was this idea that working women had be emotionless. But we are not wired that way. We need to collaborate. If I stay in my own silo and talked only to people in my organization, I would miss out on support that makes our industry stronger and helps me as a leader. Also, younger professionals should understand the history of industry. We are a relatively young industry. I believe we are in the enlightenment period of senior housing. Information is coming to us, and we don’t know quite how to process it all yet. We have to work through this period. The golden age will be when we can harness research and science for the best and highest purpose.
Mace: What role does mentoring play?
Petras: I always make time for people who want to learn about the industry, especially women. That’s part of the Senior Living Women’s Initiative. We’re trying to create places within conferences where women can get together and collaborate. All young people in the business can learn a lot from the industry veterans who pioneered the senior living sector.
![]()
2023 NIC Spring Conference Breaks Attendance Record
Premiere industry event inspires attendees to connect and collaborate.
Building on the theme, “Partnering for the Future,” the 2023 NIC Spring Conference drew a record attendance of nearly 2,000 participants for three days of discussions and networking opportunities with the goal to provide better housing and care options for older adults.

The Conference was held March 1 to 3 at the Marriott Marquis San Diego Marina. The focus of the Conference was how to achieve more effective integration of healthcare services and senior housing with an emphasis on forming long-range strategic partnerships. Highlights included:
- Keynote speakers on the intersection of housing and healthcare
- Fifteen educational sessions
- Multiple daily, formal, and informal networking opportunities
- Unique educational formats: five “Innovation Lab” sessions and a “Data Town Hall”
- New research on the safety of senior housing during the pandemic
- Deep discussions on the latest drivers of senior housing demand, new revenue sources, and untapped operational efficiencies
- A first-time attendee gathering and a women’s networking meetup
Notably, more than 70% of attendees were C-level executives, vice presidents, or managing directors. Healthcare payers or providers accounted for 120 attendees, almost a 20% increase over registrants in that category last year.
In welcome remarks, NIC President & CEO Ray Braun said, “As older adults live longer and manage a range of chronic conditions, this is a time of change and challenge for the senior housing and healthcare sectors.”
In response to these challenges, Braun noted that NIC has developed a new strategic plan to proactively serve as a catalyst for the evolution of the industry. He highlighted the plan’s five focus areas: partnering for health; serving the middle market; the emerging active adult segment; capital for operations; and “age-tech” –-technology solutions to meet the needs of older adults.
Each focus area will have a three-year plan that includes conference sessions, research, data and analytics, training and publications. Braun emphasized that NIC’s mission remains unchanged: to enable access and choice for older adults by providing thought leadership, analytics and high-quality conferences.
Addressing attendees during the welcome session, NIC Chief Economist Beth Mace put the current state of the industry in context. As the sector matures, she noted, product segmentation is underway with projects differentiated by price and service offerings. Examples include communities targeting middle income seniors and active adult properties for younger seniors. Mace also emphasized that senior housing is part of the continuum of care and that operators play a role to keep residents healthy and out of the hospital.
Despite concerns about the broader economic outlook, Mace listed reasons to be optimistic. “The number of occupied units in senior housing has never been as high as it is today,” she said. Labor conditions are improving, and the number of workers in assisted living is back to pre-pandemic levels. “We’re very excited about the industry’s growth and partnership opportunities,” she said.
A special brainstorming roundtable was held to jumpstart middle-market concepts. The discussion included experts and operators who have successfully entered the space. They noted that the middle market is not monolithic and different solutions will be needed to meet demand. Ideas generated during the session will be used to develop middle market programming for the 2023 NIC Fall Conference, October 23-25, in Chicago.
Actionable Insights
The Conference featured two keynote sessions with renowned experts on healthcare trends and opportunities.
In the keynote session titled, “The Future of Health and Healthcare: How Will Senior Living Operators Differentiate Themselves?” Dr. Nirav Shah challenged the audience to embrace innovation and the shift to value-based healthcare models. “We as a nation are redefining what counts as care,” said Shah, senior scholar at the Stanford University Department of Medicine. “Healthcare systems are desperate to keep people home and senior housing is home.”

Expensive hospitals stays are being replaced by preventative care and treatments at the older person’s home wherever that may be. The nursing home of today is the hospital ward of yesterday, Shah observed. “People want to be at home.” He emphasized the opportunity to partner with healthcare systems because senior housing and care operators know the functional, cognitive and environmental status of their residents 365 days a year. “That is gold,” said Shah.
Shah advised attendees to collect healthcare data to understand and integrate the services needed by residents. “Why not see the upside and create an ecosystem for your residents?” he asked.
In a second keynote address, two experts detailed how senior housing providers can tap into Medicare payment models by partnering with Medicare Advantage plans. “A big challenge operators have is getting started,” said Sachin Jain, M.D., president and CEO at SCAN Group and Health Plan. “Start to build partnerships, rather than looking for the perfect opportunity,” advised Jain. “Partner with a medical group and see how it works.”
Joining Jain on stage was Kelsey Mellard, CEO at Sitka, which provides a virtual specialty physician network for primary care doctors. The platform helps avoid unnecessary doctor visits and trips to the emergency room. “We deliver care in place,” said Mellard.

Both speakers agreed that the goal is to partner with a medical team to help older adults age in place, deliver a higher degree of service, and extend length of stay. “We are looking for a win-win relationship where everyone benefits,” said Jain.
New research was presented at the Conference on the effect of senior housing on excess mortality during the pandemic. A study by NORC at the University of Chicago, commissioned by NIC, showed that, with vaccines in place, continuing care communities were safer than residing in the community at large, and independent living, assisted living and memory care properties were as safe or nearly as safe. Older adults living in senior hosing properties had fewer excess deaths than those in nursing homes before and after vaccine distribution.
New Meeting Formats Boost Participation
A “Data Town Hall” offered attendees the opportunity learn about the latest metrics for informed decision-making from a panel of NIC leaders. For example, NIC MAP Vision is rolling out a new transaction interactive data set. Other product enhancements include consumer psychographics, healthcare provider data, and operational performance metrics.
Attendees shared their thoughts on what other types of data would be useful. The panel also announced the first ever NIC Data & Analytics Conference to be held September 27 to 28 in Minneapolis.
Five sessions featured a unique “Innovation Lab” format. A panel of speakers on a topic was followed by breakout discussion groups. Topics included: active adult tools for success; how to improve margins; value-based healthcare strategies; and what capital sources need to know about operators.
Other main stage educational sessions focused on the Conference theme, “Partnering for the Future.” Sessions included a discussion on the wellness revolution; what to look for in a capital partner; extending services into the wider community; and opportunities in behavioral health. Sessions also covered the capital markets; how to deploy capital in an uneven recovery; and the case for pursuing both mission and margin.
Echoing discussions at the Conference about the future of senior housing and care, panelist Colin Milner, CEO at the International Council on Active Aging, said: “Three words will shape the industry: living better longer.”
![]()
Thoughts from NIC’s Chief Economist— Another Shoe Drops: Rising Rates and Shrinking Capital Availability
By Beth Mace, Chief Economist
 It’s now been a year since the Federal Reserve began to increase interest rates to slow the economy. The increase in rates has been large, and it has been fast. Short-term interest rates have gone from virtually 0% in March 2022 to 4.75% today, the most significant tightening in monetary policy since the 1980s, when then-Fed Chair Paul Volcker also increased rates in order to cut inflation and slow economic growth. Meanwhile, longer-term interest rates have also risen, with the yield on the 10-year Treasury bill having gone from 1.7% in early March 2022 to 3.6% recently as the markets respond to the Fed’s abrupt shift in monetary policy. As a result of these movements, the yield curve has been inverted since July 2022. An inverted yield curve always precedes a recession, although it is not the case that an inverted yield curve always predicts a forthcoming recession.
Let’s take a moment to review the effects of higher interest rates to date.
Jobs Continue to be Generated. Somewhat oddly, job growth has continued to be relatively strong despite higher interest rates. This is likely simply a lagged response, but it is noteworthy, nevertheless. The standard measurements of employment remain robust. This includes a near 50-year low in the unemployment rate, although the jobless rate did tick up in February 2023 to 3.6% from 3.4% in January, which had been the lowest rate since 1969. Monthly growth in payrolls also remains strong, with a gain of 311,000 in February, slower than January’s revised increase of 504,000, but still quite strong. Total jobs in the economy are now 1% above pre-COVID March 2020 levels. Notably, jobs in the assisted living industry are also now above their pre-pandemic levels, as well. In addition, initial claims for unemployment insurance continued to decline and fell by 1,000 to 191,000 in the week ending March 18. This marked the ninth time in the prior 10 weeks that claims were below 200,000.
WARNings Ahead. There are a few indicators that do show that the employment engine is starting to run out of steam, however. First, the January JOLTS report showed job openings falling, but it also showed that there continues to be a significant amount of excess demand in the labor pool. Second, job cut announcements are becoming more frequent, and are up by more than 300% from year-earlier levels, according to Moody’s Analytics. Third, advance layoff notices filed under the Worker Adjustment and Retraining Notification Act (WARN) are rising at the fastest clip since the 2008-2009 Great Recession, excluding the period of the COVID-19 pandemic. The WARN Act stipulates that employers with at least 100 employees must give their workers a minimum of 60 days written notice prior to layoff, barring “unforeseeable business circumstances.” A WARN event is typically either the shutdown of an employment site or simply a significant reduction in the employer’s workforce. Research from the Cleveland Fed has shown that WARN layoffs lead state-level unemployment insurance claims and changes in the unemployment rate.
Homes Not for Sale. Outside of the job market, other parts of the economy have negatively responded to the reset in interest rates. This includes the residential sales market, which has seen the pace of existing home sales fall 23% from year-earlier levels to an annual rate of 4.6 million as mortgage interest rates have soared from 3% in late 2021 to more than 7% today. Further, the number of homes for sale has dwindled as homeowners are reluctant to put their homes on the market if their next move requires a significantly higher cost of debt and out-of-pocket monthly mortgage payments. Combined, slower sales and higher interest rates have led to softer home prices with high-priced markets such as San Francisco seeing home prices fall by 17% or more since May 2022 as of March 2023.
Consumer confidence has also been shaken by both inflation and higher interest rates. The University of Michigan consumer sentiment survey results remain deeply in recessionary territory and fell for the first time in four months in March as consumers worried increasingly that a recession is coming.
The manufacturing sector has also slowed from a combination of supply-side bottle necks, inflationary cost pressures, and weakening demand. One offset to this is the trend toward reshoring—relocating operations of U.S. companies that are in other countries back to the U.S.
Banking Woes? The failures of Silicon Valley Bank (SVB) and Signature Bank sent a shock wave through the financial community a few weeks ago as fears of contagion and a broader break in the banking system spread. However, at this point in late March, it appears that the combined efforts of the FDIC, Federal Reserve, and Treasury Department to guarantee all deposits for SVB and Signature depositors prevented a systemic run on banks from occurring.
Deposit Outflows. The movement of interest rates away from historic lows to rates above 4% has triggered a rapid shift of deposits away from regional bank savings accounts to higher interest-bearing instruments including US Treasury bills, money market funds, and time-bearing deposits such as certificates of deposits (CDs). This poses a risk to regional banks because their deposit levels have fallen precipitously in the past few weeks. And without deposits, these banks will have a harder time lending and issuing debt. Even if the danger of more deposit outflows lessens, regional banks are likely to exert greater caution with their lending and may experience more regulatory scrutiny.
This is particularly concerning for senior housing borrowers since an estimated one-third of real estate lending stems from regional banks. Even before recent weeks, there were both credit and capacity issues in lending. Most loans today require recourse, face lower loan-to-value ratios (50 to 60%), stricter loan covenants, and higher all-in rates.
Many permanent loan lenders prefer to lend to borrowers with stabilized assets. And for those with non-stabilized properties, bridge financing is significantly more scarce because the recycling of bank capital has diminished as deals are no longer quickly coming off of lenders’ books. Construction finance is very difficult to source for all but the best sponsors with a history of relationships with their lenders. For those in the transactions markets, deals are increasingly all cash with the expectation that borrowing costs will be less formidable in the future.
Debt Service Obligations. Limited cash flows due to rising labor, food, energy, and insurance costs are making it difficult for operators to meet their debt service obligations. Further, many senior housing borrowers took advantage of floating-rate loans prior to 2022 when rates were extremely low. For those borrowers that used adjustable-rate mortgages, the surge in interest rates from 2% to 7% in some instances is more than they can bear. In addition, debt servicing costs have been exacerbated by requirements of large escrows to cover interest rate caps.
This all comes at a particularly challenging time for existing businesses that need to refinance properties. An estimated $10 billion of senior housing loans are maturing this year and next. While small in comparison with the multifamily sector, where an estimated $250 billion of loans are maturing, it is nevertheless a formidable challenge for those operators of senior housing properties who are trying to replace maturing loans with new loans. All-in costs are higher, LTVs are lower, and loan proceeds are smaller. Cash may be needed to right-size the loan. This has the potential to create a wave of defaults from borrowers who can no longer afford to service their debt.
Wrap Up. Taken as a whole, it is likely that we will see additional stress on operators, lenders, and equity providers in 2023, especially for those involved with lower occupied properties in tertiary markets. Many pundits think further increases in the fed funds rate by the Federal Reserve are less likely, but the broader credit tightening in the banking system will effectively act as though rates are moving higher. And while market fundamentals continue to improve in aggregate with occupancy rates edging higher, fewer new groundbreakings and relatively strong demand (the number of units occupied in the senior housing has never been higher), capital market conditions are taking a toll.
For senior housing operators and capital providers, there are near-term challenges, uncertainties, and risks ahead, but the medium- and longer-term prospects are promising and robust. Health care coordination stands out as one compelling opportunity with revenue enhancing possibilities and promises of cost-efficiencies and savings. Partnerships with other service providers, the use of technology and the overall agility and creativity of operators seen during the worst days of the pandemic are also reasons to be bullish on the future of senior housing. And of course, there are the demographics, with larger and growing numbers of older adults finding the value proposition of senior housing increasingly compelling and desirable.
As always, I appreciate and welcome your comments, thoughts, and feedback.

![]()
Active Adult Inventory and Penetration Rates
By Caroline Clapp, Senior Principal, NIC
Active adult rental properties serve older Americans who wish to live in a multifamily setting with other residents who generally are more independent and active than the residents in today’s senior housing offerings. NIC MAP Vision recently released inventory data for active adult for the fourth quarter of 2022. The analysis presented in this blog post aggregates the inventory and demographics of these active adult communities by market; calculates penetration rates within each market; and identifies where the largest concentration of inventory is located. Note that this analysis simply evaluates the supply side of the active adult market given the availability of inventory data. NIC MAP Vision is scheduled to release performance data such as occupancy and rents later in 2023, which should provide further insight into active adult demand.
How Much Inventory Exists?
NIC MAP Vision tracked 625 active adult rental properties totaling 87,763 units as of the fourth quarter of 2022. By geographic location, 345 properties (55% of inventory) comprised of 53,396 units (61% of inventory) are located within the 31 Primary Markets tracked by NIC MAP Vision; 182 properties (29%) comprised of 23,706 units (27%) are located within the Secondary Markets (68 metropolitan markets); while the remaining 98 properties (16%) comprised of 10,661 units (12%) are located in other markets.
Active Adult Inventory by Number of Properties and Units | All Markets | 4Q 2022
 Source: NIC MAP® Data, powered by NIC MAP Vision

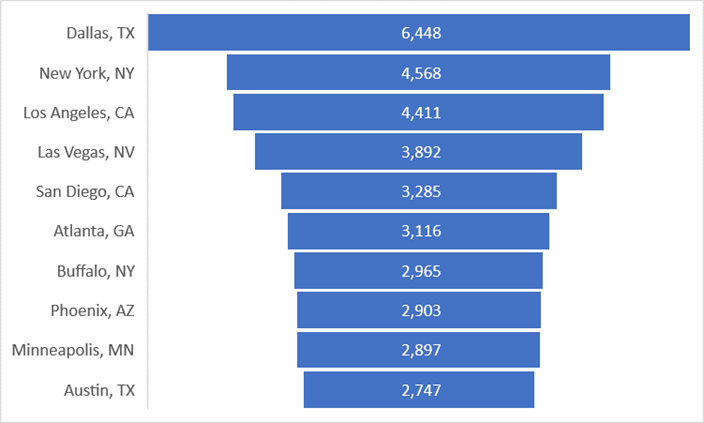
Looking at individual markets, Dallas is the largest market by unit count (6,448), followed by New York (4,568) and Los Angeles (4,411). Eight of the ten largest active adult markets are within the 31 Primary Markets tracked by NIC MAP Vision, while Buffalo, NY (2,965 units) and Austin, TX (2,747 units) are Secondary Markets.
Largest 10 Active Adult Markets by Number of Units | All Markets | 4Q 2022
Source: National Investment Center for Seniors Housing and Care (NIC) and NIC MAP® Data, powered by NIC MAP Vision
Largest 10 Active Adult Markets by Percent of U.S. Inventory | All Markets | 4Q 2022
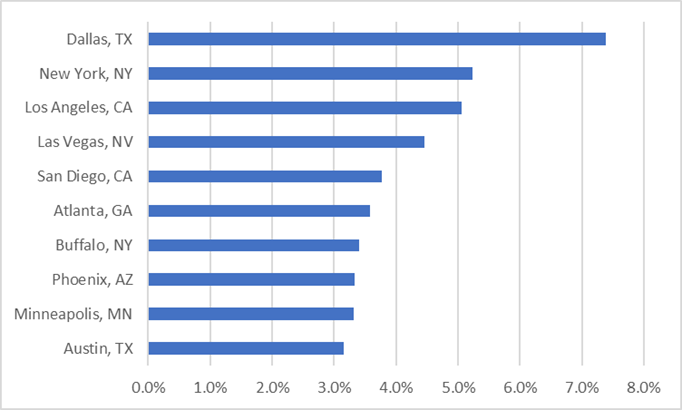
Source: National Investment Center for Seniors Housing and Care (NIC) and NIC MAP® Data, powered by NIC MAP Vision
Penetration Rates
Penetration rates provide a comparison of housing inventory for older adults within a market to that market’s cohort of older adults. High penetration rates can signal positive indicators of product acceptance and operator success and/or negative indicators of elevated competition. This rate can be calculated in a few ways. For senior housing, which is comprised of majority independent living and majority assisted living properties, NIC traditionally has used total inventory as the numerator and households age 75 and older as the denominator.
For this analysis, we use active adult inventory in units as the numerator. An alternative method is to use occupied units as the numerator as opposed to total inventory, but as noted above, occupancy data is not yet available. This alternative calculation may prove useful once available, and likely no single method is perfect. For the denominator:
- First, we use households age 65 and older (rather than 75 and older) to better capture the demographic make-up of active adult communities in which residents are age-eligible beginning at, for example, 55+, 62+, or 65+ years old, with an average resident age of 72-74 years old.
- Second, we calculate an additional penetration rate using population age 65 and older (rather than households), which results in a larger denominator and, thus, a smaller penetration rate.
Utilizing these two methods, penetration rates appear quite small for the active adult market, ranging from 0.1% to 0.4%. This compares to the 10.9% to 11.7% range for senior housing penetration rates across market classes.
Penetration Rates by Property Type and Market Class | 4Q 2022

Source: National Investment Center for Seniors Housing and Care (NIC) and NIC MAP® Data, powered by NIC MAP Vision
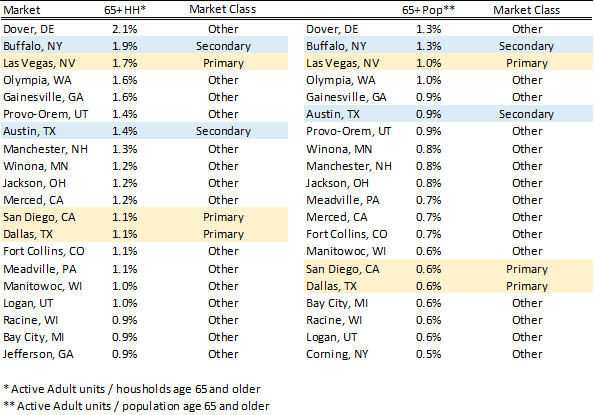
When ranking individual markets, the highest 20 markets have penetration rates that range from 0.5% in Corning, NY to 2.1% in Dover, DE. Within these markets that comprise the 20 highest penetration rates:
- Primary Markets include Las Vegas, NV; San Diego, CA; and Dallas, TX
- Secondary Markets include Buffalo, NY and Austin, TX
20 Highest Active Adult Penetration Rates | All Markets | 4Q 2022
Source: National Investment Center for Seniors Housing and Care (NIC) and NIC MAP® Data, powered by NIC MAP Vision
Conclusion
The active adult property type is garnering increased interest from developers, operators, investors, and older adults due to the unique preferences of the baby boomer generation. While some markets contain active adult rental inventory in the thousands of units, the very low penetration rate relative to traditional senior housing indicates that the active adult product type is still in its nascent stages. Overall, the large number of households and population age 65 and older is significant and growing, and when compared to existing inventory, penetration rates also likely indicate that there is room for new active adult rental supply from those vying to enter the space.
![]()
CCRC Performance 4Q 2022: Lessons for Success
By Omar Zahraoui, Principal, Research & Analytics – NIC
 The following analysis examines occupancy and year-over-year changes in inventory, and same-store asking rent growth—by care segment—within not-for-profit CCRCs and for-profit CCRCs in the 99 combined NIC MAP Primary and Secondary Markets. The analysis also explores occupancy by payment type (entrance fee CCRCs vs. rental CCRCs) as well as regional occupancy rates by profit status (not-for-profit CCRCs vs. for-profit CCRCs) during the fourth quarter of 2022.
NIC MAP®, powered by NIC MAP Vision, collects primary data on occupancy, asking rents, demand, inventory, and construction for more than 16,000 independent living, assisted living, memory care, skilled nursing, and continuing care retirement communities (CCRCs—also referred to as life plan communities) across 140 U.S. metropolitan markets. The dataset includes 1,160 not-for-profit and for-profit entrance fee and rental CCRCs in these 140 combined markets, including 1,084 in the 99 combined Primary and Secondary Markets.
CCRCs Outperform Non-CCRCs in Occupancy Rates, Maintaining Consistently High Levels.
The exhibit below shows that CCRC occupancy increased to 87.2% in the fourth quarter of 2022 for the 99 NIC MAP Primary and Secondary Markets aggregate, up 0.6 percentage points (pps) from the prior quarter. From its pandemic-record low, CCRC occupancy increased by 3.1pps but remained 4.3pps below its pre-pandemic level of 91.5% in the first quarter of 2020.
In comparison to CCRCs, occupancy for non-CCRCs stood at 80.9% in the fourth quarter of 2022, 6.3pps below that of CCRCs. Notably, during the height of the pandemic, non-CCRCs experienced a larger decline in occupancy rates. Specifically, the decline in occupancy rates for non-CCRCs (11.3pps) was nearly 4.0pps more than that of CCRCs (7.4pps).
The recently released COVID-19 study conducted by NORC at the University of Chicago, through a grant from NIC, found that CCRC residents were significantly safer from dying of COVID-19 than older adults living in skilled nursing properties and both non-CCRCs and non-congregate residential housing in the community at large.
By Profit Status – Occupancy for Not-For-Profit CCRCs Continued to Outpace That of For-Profit CCRCs.
Among the 1,084 CCRCs spread across the 99 Primary and Secondary Markets tracked by NIC MAP Vision, approximately 75% are operated as not-for-profit, and 25% are operated as for-profit.
In the fourth quarter of 2022, not-for-profit CCRC occupancy (88.2%) was 3.9pps higher than for-profit CCRCs (84.3%). Compared with the first quarter of 2020, not-for-profit CCRCs were 4.4pps lower, while for-profit CCRCs remained 4.1pps below pre-pandemic occupancy levels.
Notably, for-profit CCRCs are recovering relatively quickly from their pandemic record low but experienced the largest occupancy drop at the peak of the pandemic. On the other hand, not-for-profit CCRCs had relatively smaller occupancy declines and maintained higher occupancy rates.
By Payment Type – Occupancy for Entrance Fee CCRCs Continued to Outpace That of Rental CCRCs.
Among the 1,084 CCRCs spread across the 99 Primary and Secondary Markets tracked by NIC MAP Vision, 64% are operated as entrance fee, and 36% are operated as rentals.
In the fourth quarter 2022, entrance fee CCRC occupancy (89.2%) was 5.4 percentage points higher than rental CCRCs (83.8%). Rental CCRCs are currently 5.2 percentage points below their pre-pandemic occupancy levels, while entrance fee CCRCs are 3.8 percentage points lower. Similar to the pattern based on profit status, rental CCRCs saw steeper drops in occupancy rates, but are rebounding more quickly – compared with entrance fee CCRCs.
A consistent pattern emerges from all these comparisons – CCRCs vs. non-CCRCs, not-for-profit CCRCs vs. for-profit CCRCs, and entrance fee CCRCs vs. rental CCRCs – properties where demand and occupancy contracted more severely during the height of the pandemic are rebounding more quickly. Interestingly, one of the findings from recently released research by NIC Analytics, exploring the interplay between inflation, in-place rate growth, demand, and occupancy in senior housing, was that the lowest occupied properties/segments were able to generate new demand and grow occupancy faster, but this occurred largely because of lower in-place rates and minimal or even negative rate growth. The fact that these properties/segments had minimal/negative rate growth also suggests that their demand and occupancy may have contracted more severely during the height of the pandemic, and to accelerate the recovery of occupancy, one potential option was likely to lower rates in an attempt to buy occupancy.

By Region – Not-for-Profit and Entrance Fee CCRCs Outperform For-Profit and Rental CCRCs Across All Regions
Regional Occupancy Rates – By Profit Status
The exhibit below shows that in the fourth quarter of 2022, not-for-profit CCRCs had higher occupancy rates than for-profit CCRCs across all regions except in the Pacific. The largest differences in fourth quarter occupancy between not-for-profit CCRCs and for-profit CCRCs were in the Southwest (6.4pps), followed by the West North Central (5.8pps), then the Mid-Atlantic and Northeast (4.8pps and 4.7pps, respectively).
Not-For-Profit CCRCs. The Mid-Atlantic (91.1%), Northeast (90.6%), and Pacific (88.2%) regions had the strongest occupancy rates in the fourth quarter of 2022. The Southeast region had the lowest occupancy at 85.3%.
For-Profit CCRCs. The Pacific (90.8%), Mid-Atlantic (86.3%), and Northeast (85.9%) regions had the strongest occupancy rates in the fourth quarter of 2022. The Southwest and West North Central regions had the lowest occupancy at 80.2%.
Regional Occupancy Rates – By Payment Type
In the fourth quarter of 2022, entrance fee CCRCs had higher occupancy rates than rental CCRCs across all regions. The most significant difference between entrance fee and rental occupancy was reported for the Southeast region, where entrance fee CCRC occupancy was 7.6pps higher than rental, followed by the West North Central (6.2pps), and the Mountain (5.3pps).
Entrance Fee CCRCs. The Northeast, Pacific, and Mid-Atlantic regions had the strongest entrance fee CCRC occupancy rates – all above 90%. The smallest CCRC occupancy was in the Southwest region at 86.1%.
Rental CCRCs. The Mid-Atlantic, Northeast, and Pacific regions had the highest occupancy rates, ranging from 86.1% to 87.8%, whereas the Southeast region had the lowest occupancy rate of 79.8%, the only region with an average occupancy rate below 80%.

4Q 2022 Not-For-Profit vs. For-Profit CCRCs – Market Fundamentals by Care Segment
The exhibit below illustrates the relative market performance of not-for-profit CCRCs compared with for-profit CCRCs by care segment in the fourth quarter of 2022 and includes year-over-year changes in occupancy, inventory, and asking rent growth.
Occupancy. Overall, the occupancy rate for not-for-profit CCRCs continued to outpace that of for-profit CCRCs across all care segments. The difference in fourth quarter occupancy rates between not-for-profit CCRCs and for profit CCRCs was largest for the assisted living segment (4.5pps), and smallest for the nursing care segment (1.7pps).
The not-for-profit CCRC independent living care segment had the highest occupancy (90.8%) in the fourth quarter of 2022, followed by not-for-profit CCRC assisted living and memory care segments (87.5% and 86.5%, respectively). Although in terms of occupancy improvements from one year ago, the independent living segment had the smallest gain across all care segments for both not-for-profit CCRCs and for-profit CCRCs. The largest occupancy gains from one year ago were seen across all care segments within for-profit CCRCs.
Asking Rent. The monthly average asking rent for not-for-profit CCRCs across all care segments remained higher than for-profit CCRCs except in the independent living care segment. The highest year-over-year asking rent growth for both not-for-profit and for-profit CCRCs was noted in the independent living segment (4.2% and 4.5%, respectively).
Note, these figures are for asking rates and do not consider any discounting that may be occurring. To learn more about actual in-place rates, i.e., the effective rates or the rates that are “actually being paid” to live in senior housing. Visit nic.org
Inventory. From year-earlier levels, inventory across for-profit CCRCs decreased (or shifted) across all care segments, while not-for-profit CCRCs saw increased/relatively stable inventory in all but nursing care. Nursing care inventory for both for-profit and not-for-profit CCRCs experienced the largest declines from year-earlier levels (negative 5.2% and 2.6%, respectively). The highest year-over-year inventory growth was reported for the not-for-profit CCRC memory care segments and independent living segments (1.4% and 0.4%, respectively).
Negative inventory growth can occur when units/beds are temporarily or permanently taken offline or converted to another care segment, outweighing added inventory.

In conclusion, the senior housing industry can benefit from the occupancy success lessons of CCRCs. Collaboration and shared knowledge can be the key to achieving this goal. By learning from each other’s best practices, the industry can better serve its residents and prepare for any future challenges that may arise.
Look for future blog posts from NIC to delve deep into the performance of CCRCs.
Are you interested in learning more?
To learn more about NIC MAP Vision data, and about accessing the data featured in this article, schedule a meeting with a product expert today.
This article originally appeared in Ziegler’s Senior Living Finance Z-News and the NIC Notes Blog.
![]()