NIC MAP’s New Employment and Wage Data Report

Beth Mace
With roughly 60% of a typical operator’s expenses associated with its workforce, labor is a critical component of operating a seniors housing and care property. And, today with the U.S. experiencing tight labor markets across broad-based industry sectors and geographic locations, more attention than ever is being paid to labor availability and wage rates. Seniors housing and care operators and their capital partners are increasingly aware of the effect of a strained workforce on their operations and practices. Market feasibility studies currently consider the characteristics of not only the senior and adult child-influencer demographic cohorts of a primary market area, but also its labor market characteristics. These characteristics include the availability and type of worker that can be offered a job, and the competition from other industries that exists for that same potential employee. Competition for employees to fill positions ranging from housekeeping and maintenance managers to CNAs and LPNs increasingly extends beyond seniors housing and care operators to other industry sectors as well. Anecdotal stories of decision makers aborting or postponing development or expansion plans or choosing one market over another due to a lack of skilled labor are ever more common. Moreover, tightening labor markets and rising wage rates are directly affecting the bottom line. [expand title=”Read More” trigpos=”below” tag=”div” trigclass=”nic-read-more”]
To help provide data on the depth of local labor pools and wage levels, the NIC MAP® Data Service (NIC MAP) recently launched a new resource tool for clients on the NIC MAP web platform. The NIC MAP Bureau of Labor Statistics Employment and Wage Report is a new report that provides metropolitan area, state and national level employment and wage data for occupational job categories associated with the seniors housing and care sector. This report provides operators, developers, and capital providers the ability to benchmark the occupation-specific wage rates being used in business plans and pro forma models against national and state-level figures, in addition to offering users the means to compare metropolitan area wage rates within states for relevant occupations. Among the benefits of this new report are simplifying the task of acquiring and downloading data from the Bureau of Labor Statistics (BLS) into property level P&L statements and modeling specific wage rates for each of the labor groupings within an organization.
Under the federal government’s industry classification system (NAICS*), NIC has accumulated data from five separate BLS data files, collected from the BLS Occupational Employment Statistics (OES) surveys, to facilitate easy access to occupational-level wage data for the two seniors housing and care industry categories tracked by the BLS. Specifically, the report provides state and national employment data and corresponding annual/hourly wages across occupations for the skilled nursing and CCRC/assisted living sectors. In addition, the report provides state-wide metropolitan area comparisons of key occupational job titles and displays employment levels along with corresponding annual/hourly wages across these occupations.
An in-depth user guide available in the Document Library of the NIC MAP Client Portal makes available descriptions of specific applications for the report. Two examples of applications of the data included in the report are offered below.
First Example: Assessment
Within each State Report are thirteen occupation-specific worksheets that compare occupation wage rates across all metropolitan areas within a state, as well as a comparison of occupation-specific wage rates for the three relevant seniors housing and care NAICS codes tracked by the BLS OES survey at the state-level:
- Skilled Nursing sector—NAICS Code 623100
- CCRC/Assisted Living sectors—NAICS Code 623300
- Health Care and Social Assistance–NAICS Code 62 (a broad category that includes the two prior industry groupings)
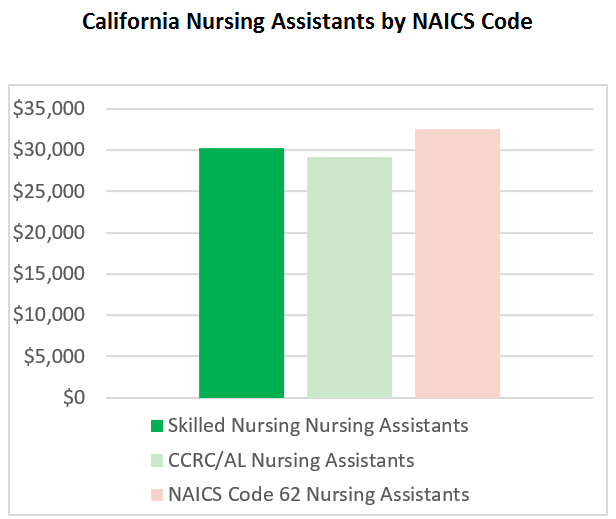
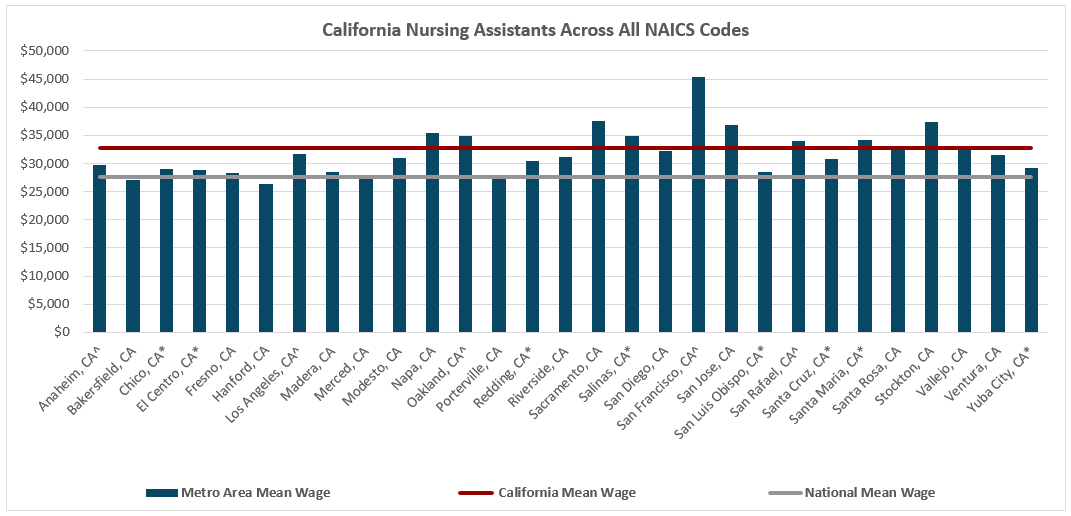
The two charts below (1) Nursing Assistants by NAICS Code and (2) Nursing Assistants Across All NAICS Codes can be found in one of these occupation-specific worksheets (in this instance, California nursing assistants.)
- The three-bar bar chart on the worksheet displays wages at the state level for nursing assistants by these three NAICS industry codes, and shows that the average wage rate for nursing assistants in California is lower for skilled nursing and CCRC/AL industry sectors than for health care and social assistance in aggregate.
- The multi-bar bar chart on the worksheet displays wage rates for all nursing assistants within the state of California by metropolitan area, and shows that the highest wages are paid in San Francisco, followed by Stockton, Sacramento, and San Jose. The lowest wages are paid to Hanford (Kings County), Porterville (also known as the Visalia metropolitan area), and San Luis Obispo. Apart from Hanford, Merced, and Bakersfield; average nursing assistant wage rates across all metropolitan areas are higher in California than the nation.
- Combined, the two charts show relative wage rates across metropolitan areas for a specific occupation, while also providing comparison data for NAICS-specific occupation wage rates at the state-level. Looking specifically at Anaheim, for example, the combined two charts on this worksheet indicate that nursing assistants are paid slightly higher in the Anaheim metropolitan area than at the state-level, but lower than in San Francisco, and that wage rates tend to be lower in the two industry classifications related to seniors housing.
- Other occupation-specific worksheets in the California report show, for example, that physical therapists tend to be better paid in the CCRC sector than in other industry sectors, and that wages for physical therapists in the Anaheim-area are higher than the national average.
Second Example: Benchmarking
The first worksheet in the report provides employment and wage details for seventeen separate occupations relevant to the seniors housing and care sector. Specifically, the report provides state and national employment levels (number of employees) and corresponding annual/hourly wages across industry-specific occupation estimates for:
- Skilled Nursing sector—NAICs Code 623100
- CCRC/Assisted Living sectors—NAICs Code 623300
- Health Care and Social Assistance NAICs Code 62 (a broad category that includes the Skilled Nursing and CCRC/AL groupings)
The report, which is based on the most up-to-date data from the U.S. Bureau of Labor Statistics (2016) and released in April 2017 is compiled by NIC MAP to help operators, developers, and capital providers benchmark the occupation-specific wage rates often included in business plans and pro forma models against national and state-level figures and indices.
For example, 9 of the 17 reported occupation groups for the state of California are shown in the excerpted table above. A quick glance at the table reveals that there were nearly 90,000 workers employed in the CCRC and assisted living NAICS industry classification grouping in 2016 with an average wage of $32,000 per year (4% above the national average). Furthermore, greater than one-third of these workers were employed in the personal care and service occupations (OES code 39-000), where wages averaged $25,000 per year (3% above the national average).
While not detailed in the table, there are many specific occupations below these main categories. Within the personal care and service occupations category for example, there are seven more specific categories which include recreation workers, personal care aides, and first-line supervisors of personal service workers among others. This level of detail can be used by operators and investors to compare their wage rates with those at the state and national-level. The data could also be easily downloaded into property level P&L statements and be used to define and model specific wage rates for each of the labor groupings within an organization.
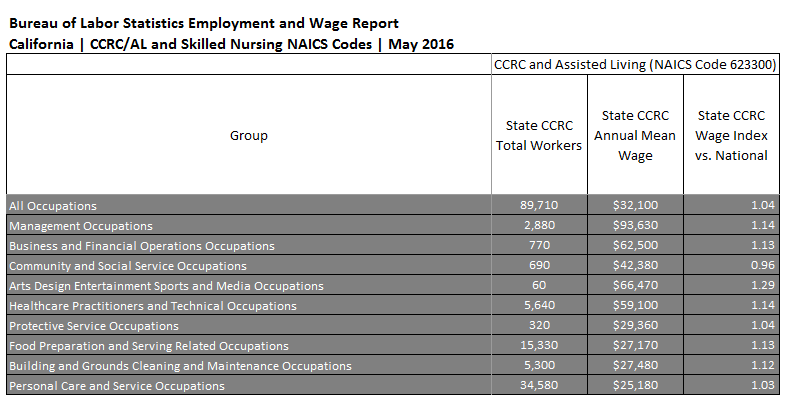
Another example, not shown in the table, is that wage rates for nursing assistants in both the CCRC/AL and skilled nursing sectors in California are 13% higher than at the national level, while personal care and service occupations are 2% lower for the skilled nursing sector.
Among other applications, the report also allows users to compare wage levels across and between job types and occupations for sector-specific NAICS codes at the state and national level, including the numbers of workers employed by occupation for both the skilled nursing and CCRC/AL sectors. For example, most healthcare support occupations in California are nursing assistants with average annual salary of approximately $30,000. Comparatively, medical and health services managers, which comprise the majority among managerial occupations, are paid on average more than $100,000 per year.
The NIC MAP Bureau of Labor Statistics Employment and Wage Report is designed to offer valuable insights into labor market conditions at the metropolitan area, state, and national level by providing comprehensive data on employment levels and wage rates by occupation. The data can be used to plan, compare, and benchmark business plan and pro forma models by both operators and capital providers.
Note that the data provided in the NIC MAP Bureau of Labor Statistics Employment and Wage Report is directly from the BLS, and NIC has not altered nor reviewed it for accuracy. As with all data derived from sample surveys, OES research estimates are subject to sampling and non-sampling error. [/expand] [cresta-social-share]
Skilled Nursing Trends Update

Bill Kauffman
Takeaways from Our First Quarter Data Report
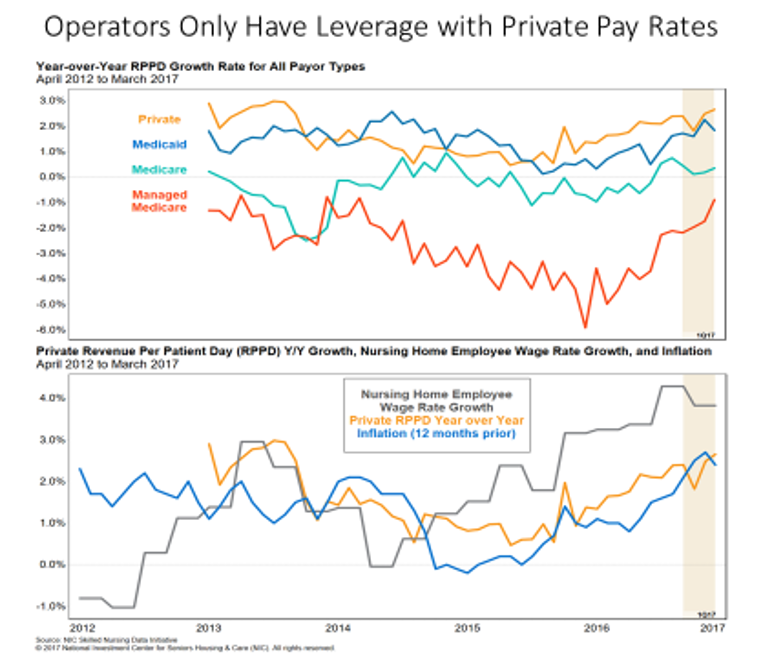
NIC released its latest Skilled Nursing Data Report in June, providing key monthly data points from April 2012 through March 2017. Here are the main takeaways:
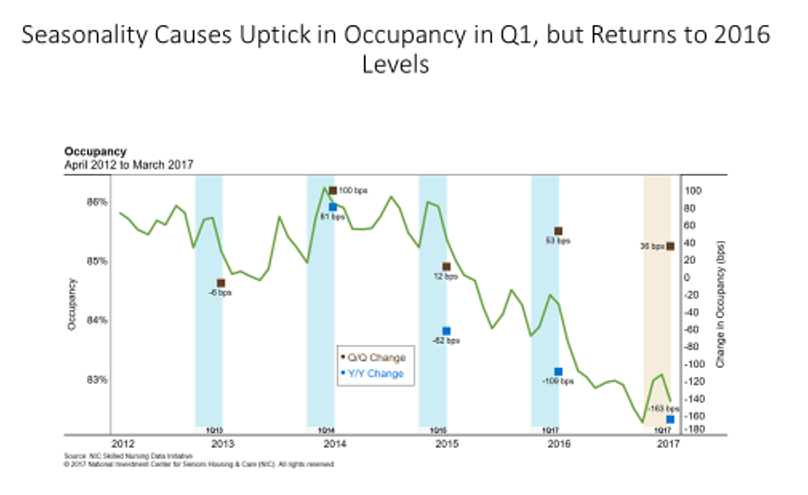
- Occupancy increased 36 basis points from last quarter to 82.6%, demonstrating the expected seasonality as the first quarter usually sees an uptick from the fourth quarter.
- Private revenue per patient day (RPPD) rose 1.5% quarter-over-quarter and by 2.7% on a year-over-year basis.
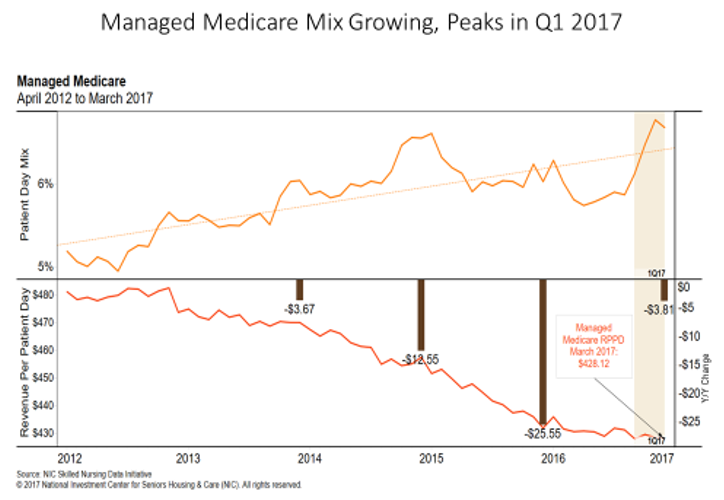
- Managed Medicare patient day mix reached its highest point within this time-series during the first quarter in the month of February.
- Managed Medicare RPPD increased quarter over quarter, marking the first time in two years that managed Medicare RPPD increased quarter over quarter.
- The uptick in Medicare and managed Medicare patient day mix were the drivers behind increased quality and skilled mix in the first quarter.
[expand title=”Read More” trigpos=”below” tag=”div” trigclass=”nic-read-more”]
The report is based on data that is collected monthly but reported quarterly, on a national aggregate level, from approximately 20 operators and 1,500 properties. The plan is to grow the data set to include more operators and properties in order to allow NIC to report at the state level. Operators around the country are welcome to participate and will receive a free benchmark report every month for their participation.
Occupancy Up Quarter Over Quarter
Occupancy increased 36 basis points from last quarter to 82.6%, demonstrating the expected seasonality as the first quarter usually sees an uptick from the fourth quarter. However, occupancy decreased from the month of February after exceeding 83% for the first time in eight months. Occupancy has not exceeded 84% since March of last year and hasn’t reached 85% since April 2015. The average occupancy for the last 12 months was 82.9%, compared to 84.3% for the prior 12 months, and 85.7% for the 12 months before that. If occupancy continues at this rate of decline year-over-year, a new low will be expected later in 2017.
Year-over-year occupancy dipped 163 basis points from 84.3%, continuing the downtrend over the past couple years. See the Exhibit 1 below for more occupancy details over the last five years, which includes year-over-year and quarter-over-quarter changes.
Over the past couple years, in both 2015 and 2016, the first quarter represented the high point for occupancy in each year, as first quarter data typically shows an uptick in occupancy due to seasonal factors, such as the flu as admissions to skilled nursing properties can increase during that time of year. We did see a monthly occupancy rate decline in March after increases in January and February, and considering the current environment in post-acute care, competition for Medicare patient days is higher than at any time in recent memory for skilled nursing property operators. Many factors, such as sending patients directly home from the hospital, are contributing to occupancy challenges. Therefore, occupancy could feel additional pressure until the supply and demand equation comes into better balance.
(Exhibit 1)
Private RPPD Increased
Private revenue per patient day (RPPD) rose 1.5% quarter over quarter and by 2.7% on a year over year basis. In March 2016, the RPPD was $251.85, and it rose to $258.53 as of the first-quarter 2017. The yearly increase may not be enough to offset the decline in private patient day mix, which has fallen year over year by 62 basis points, although most of the decline in private day mix occurred in the last quarter. Private revenue is one way operators can mitigate revenue loss from decreased occupancy and skilled mix, which may help to explain why the private RPPD has increased in recent quarters.
The private reimbursement rate has grown at a healthy clip and has grown faster than the overall CPI at 2.4% as of the first-quarter 2017. However, it has not kept pace with the latest nursing home wage growth of 3.8%. Exhibit 2 below shows the trend in comparison to wage growth and inflation (overall CPI).
(Exhibit 2)
Managed Medicare Patient Day Mix Trending Up
Managed Medicare patient day mix reached its highest point within this time-series of 6.8% during the first-quarter in the month of February. Managed Medicare patient day mix increased quarter over quarter and on a year-over-year basis, mirroring the trend in managed Medicare seen in first-quarter of 2015, which also experienced a relatively significant flu season. Quarter over quarter, it increased to 6.7% from 6.1% in December 2016. Last March in 2016, this patient day mix was 6.0%.
As this patient day mix is trending upward, reaching the highest point in the data set in the month of February, it reflects the growing importance of managed Medicare within the skilled nursing sector. Paying attention to managed Medicare trends will become ever more important as nearly half of all seniors may be enrolled in managed care over the next 10 years.
Quarter over quarter, managed Medicare RPPD increased, marking the first time in two years that managed Medicare RPPD increased quarter over quarter. The increase, while subtle, reinforces earlier NIC analysis suggesting a trend away from what had been a rapid decline in the managed Medicare RPPD. Quarter over quarter, it increased .01% from $428.07 to $428.12. Year over year, the measure was still down, as it decreased 0.9% from $431.93 to $428.12.
(Exhibit 3)
Skilled Mix and Quality Mix Increased Quarter-Over-Quarter
The uptick in Medicare and managed Medicare patient day mix were the drivers behind increased quality and skilled mix in the first quarter, which is not unexpected in terms of seasonality and which may have been heightened by a relatively more significant flu season.
Quality mix increased quarter over quarter from 33.9% to 34.8%. However, it decreased year over year from 35.7%. Skilled mix followed the same trend, as it was up quarter over quarter from 24.2% to 25.7%, but down year over year from 25.9%.
Medicare mix increased 89 basis points quarter over quarter from 12.9% to 13.7%. Despite this recent increase, it decreased year over year by 82 basis points from 14.6%. In addition, the average Medicare mix for the last 12 months decreased by 116 basis points compared to the average for the previous 12-month period (April 2015 to March 2016). Also, the average Medicare mix for the previous 12-month period decreased by 99 basis points from the average for the 2014-2015 period, following the same trend as overall occupancy.
Looking Forward
The skilled nursing sector is challenged and begs the question: When will occupancy hit bottom? Another way to frame the question is to ask: When does the supply and demand equation come into better balance in terms of Medicare patient days? The timing, of course, is certainly a wild card, but as the move to value-based purchasing is likely to continue due to budget constraints, there could continue to be pressure on the economics of the business until more consolidation occurs and/or the weaker operators go out of business. The operators that are most likely to win are the ones that are nimble, able to navigate this environment by providing the best outcomes, and avoid rehospitalizations when caring for complex patients.
Want more information on the evolving SNF sector? Join us in Chicago at the NIC Fall Conference session:
Wednesday, September 27, 11:15 am – 12:15 pm CDT
The Evolving SNF World: Where Are the Investment Opportunities?
Disruption brings opportunity. Constant regulatory changes, pressures on CMS to contain costs, evolving health care policy, a rapidly aging population are just some of the factors causing the business constructs of skilled nursing investments to change. Come to this session to learn how operators are adjusting to this evolving environment and how their capital needs are changing. Find out how investors view their investments in the sector and how their expectations have changed. What do they look for in assessing their next skilled nursing deal? Are they investing in the operations or the real estate? Is there a “right” balance between post-acute care service provision and custodial care? Is that the same for all operators? Is scale good or bad? How can operators best situate themselves to be a winner in a world of ACOs and Medicare Advantage? Join us for this provocative session as we hear how leading industry participants are looking at the market today.
Takeaways:
- identify core market factors that capital providers consider when assessing a skilled nursing deal
- analyze what creates a good balance between post-acute care and custodial care services
- hear about the role of Medicare Advantage plans and population health models in driving payments
[/expand] [cresta-social-share]
NIC Funds Research for Program to Certify Executive Directors
In an effort to boost professionalism, a new credentialing program for assisted living executive directors has been launched by the industry.
Eligible executive directors who pass a certification exam can earn the designation of Certified Director of Assisted Living (CDAL).
The CDAL designation was created to demonstrate to residents and family members that the executive director of a facility is a knowledgeable professional. The credential also provides industry recognition for the role of the executive director, and highlights best practices.[expand title=”Read More” trigpos=”below” tag=”div” trigclass=”nic-read-more”]
The first CDAL certification exam was held in September 2016. More than 250 professionals have already earned the CDAL designation. Participating executives have come from a wide variety of companies, including Atria Senior Living, Belmont Village, and Silverado among many others.
The program was created by the Senior Living Certification Commission (SLCC), a nonprofit organization based in Alexandria, Virginia. NIC provided a $250,000 grant to fund the research needed to develop the testing protocols for the certification. The research and test preparation was conducted by Castle Worldwide, a certification and licensure testing company.
“The CDAL credential helps professionalize the industry,” said Brian Jurutka, president at NIC. “This is another step in our mission to ensure America’s elders have choice in seniors housing and care options.”
“NIC is known for its role in connecting senior and care providers and investors, and the CDAL credential supports and builds on NIC’s mission as a nonprofit organization serving America’s elders by encouraging professionalization and best practices within seniors housing and care”, said Jurutka, an SLCC board observer.
Separately, in another example of its mission to enable access and choice for America’s elders, NIC recently awarded a $125,000 grant to independent social science research organization NORC at the University of Chicago to study the demand for middle-market seniors housing. The 18-24 month study is part of a larger, multi-year commitment by NIC to define the potential middle-market for seniors housing from the standpoint of size, wealth, and health. The study is focused on quantifying the middle market demand for seniors housing and will facilitate dialogue on potential seniors housing and care solutions to address the needs of this growing segment of America’s elders, who may struggle with the affordability of existing long-term care solutions but make too much to qualify for government subsidies.
Certification combines knowledge and experience
Originally, the CDAL program grew out of a vision by the board of directors at Argentum, the professional association that represents the assisted living industry. The board created the SLCC in 2015 as a vehicle to provide professional certification for executive directors.
- Applicants for the CDAL designation must have industry experience and pass a certification examination.
- Eligible applicants must possess a bachelor’s degree and have at least three years work experience as an executive director of a licensed assisted living community, or five years experience in a management capacity in one or more licensed assisted living communities.
- Those without a college degree must have at least five years of work experience as an executive director of a licensed assisted living community, or seven years of experience in a management capacity.
The certification exam is administered in all 50 states and includes 150 multiple-choice questions covering eight primary domains. These include resident care and services, principles and philosophy of assisted living, customer experience, leadership,
operations management, regulatory compliance, financial management, and sales and marketing.
The eight question domains were developed by experienced executive directors, company managers and regulators based on the competencies needed to run a successful community. Questions focus on practical on-the-job experience.
No specific coursework is required in advance of the test. Requirements to maintain certification through continuing education classes are currently under review by the SLCC.
It’s important to note that the certification does not replace internal company training programs, said Paul Williams, executive director of the SLCC. “The CDAL program offers validation of certain skills from a third-party organization.”
Williams added that the CDAL designation is voluntary. Also, the CDAL designation does not replace a license required by the state which is usually granted based on knowledge of state rules and regulations.
Registration for the CDAL certification exams is open now. The next testing window is September 15 to December 15.
The exams are monitored and taken at a testing center. Tests are scored by an impartial company.
“Until now, the industry hasn’t had a way to recognize the executive directors who have reached this level of accomplishment,” said Tim Buchanan, CEO at Legend Senior Living. Buchanan is Argentum board vice chairman and heads the organization’s credentialing committee. He has also been instrumental in the development of the CDAL program.
“Building owners and operators should encourage executive directors to seek certification,” said Buchanan. “The operators who hold themselves to a high standard of quality will see the CDAL designation as a way to celebrate their brand in the public marketplace and show their commitment to professionalism.”
He noted that Argentum board members have pledged to have all of their eligible executive directors earn the CDAL designation over the next three years. “It raises industry standards,” said Buchanan.
Commenting on NIC’s contribution, Buchanan recognized the importance of the research underpinning the CDAL program. “This research will live on and raise the tide of professionalism in the industry for decades,” he said. [/expand] [cresta-social-share]
Registration Opens for 2017 NIC Fall Conference
Theme highlights current markets and future trends
Quickly changing conditions are creating new market realities for the seniors housing and care industry. Operators and investors face a growing list of concerns from increased competition and ongoing construction to labor challenges and uncertainty related to policy and regulatory changes. At the same time, stakeholders must consider the emerging innovations and drivers that will shape the senior living industry in the years ahead.[expand title=”Read More” trigpos=”below” tag=”div” trigclass=”nic-read-more”]
To address this challenging environment, the theme of the 2017 NIC Fall Conference is Navigating the Present Market and Anticipating the Future.
Registration is now open for the Conference which is being held September 26-28 at the Sheraton Grand Chicago, located in downtown Chicago.
The Conference will include a variety of networking opportunities for attendees to connect with industry participants and thought leaders. Educational programming will provide insights into seniors housing and care trends, and help attendees assess strategies for growth.
Here are a few program highlights:
- NIC Boot Camp. A highly interactive pre-conference workshop designed for seniors housing capital providers, analysts, and developers in the industry 1-3 years, use an actual case study to analyze key decision points for property acquisition or development. (Advance registration required).
- NIC Talks. The popular and provocative speaker forum returns with a look at cutting-edge aging issues, such as how artificial intelligence will transform health care. Hear what influencers will have the most dramatic impact on the future of America’s rapidly aging population.
- The Upside of Aging. Longer life expectancies are influencing everything from health care policies to seniors housing and care practices. America’s aging demographics will be the theme of the general opening session led by Paul Irving, chairman of the Milken Institute Center for the Future of Aging. Irving’s remarks will set the stage for subsequent sessions on navigating the current market and anticipating the future.
- Economic Growth: A Debate. Perspectives on the impact of the new Administration’s policies on economic growth will be discussed at the general luncheon session by two influential speakers: Lawrence H. Summers, former Treasury Secretary under President Clinton; and Newt Gingrich, former Speaker of the U.S. House of Representatives. Hear their perspectives on tax reform, regulations, immigration, health care, and other crucial issues.
- Future Demand for Alzheimer’s Care. A NIC special session panel will explore current research findings on Alzheimer’s disease, and the innovative care protocols being used successfully today. Speakers include Maria Carrillo, chief science officer at the Alzheimer’s Association, Pinchas Cohen, M.D., dean of the USC Davis School of Gerontology, and Jean Makesh, chief executive officer for Lantern Group.
- New Supply and Market Share. The results of comprehensive analytics on hundreds of recent seniors housing construction opening will be reviewed during this session to help investors and developers spot the factors that make or take market share.
- Innovations Around the Globe. The United States isn’t the only country with an aging population, and a number of other countries are pacing ahead of the U.S. This session brings together investors and operators of seniors housing from abroad to discuss their innovative ideas.
- The Evolution of Skilled Nursing. Leading industry participants will explore how operators and investors are adjusting to new market realities. Where are the best investment opportunities? How do stakeholders assess the next skilled nursing deal?
- Scaling up for Success. A panel of seniors housing experts who have grown their operations platform will discuss the pros and cons of scale, as well as the key drivers and challenges of growth.
Join us in Chicago. Save your spot at the 2017 NIC Fall Conference. Register here. [/expand] [cresta-social-share]
Trend Spotter: A Conversation with Veteran Lender Kathryn Burton Gray

Kathryn Burton Gray
After recently spending three days at an industry conference, Kathryn Burton Gray was eager to share her insights about the sector. She noted that the dramatic changes now reshaping the American health care system will have a significant impact on operators, real estate owners, bankers and other industry stakeholders for years to come. Options for housing will change amid the reality of longer life spans and the rise of chronic diseases.[expand title=”Read More” trigpos=”below” tag=”div” trigclass=”nic-read-more”]
Those are the kind of big picture insights that inform Gray’s daily decision-making process as senior managing director and head of Seniors Housing & Health Care for RED Capital Group, LLC (RED), Columbus, Ohio.NIC chief economist Beth Burnham Mace recently caught up with Gray to get her take on seniors housing and care trends as she traveled back to her office in Dana Point, Calif. Here are some of her comments.
Mace: How would you characterize the current seniors housing and care landscape?
Gray: There are dramatic changes happening in the industry. Technological advances and changes in health care delivery systems are creating new housing and home care models for America’s elders. The rising cost of skilled nursing care and the increased capacity of more economical assisted living, short-term rehab and home care providers to deliver services to higher acuity seniors are contributing to a decline in skilled nursing utilization. Cuts to Medicare and Medicaid reimbursement rates are accelerating this shift.
Moreover, the rise of technology is clearly enhancing the seniors housing and care industry, with potentially revolutionary implications. The availability of home computer systems and the growing ability to track data in real time means providers don’t need a nurse present to document every activity. Nor is this capability limited to in-unit care. Wireless networks now can provide mobile support for ambulatory residents of seniors housing. In the future, we can expect and must prepare for companies like Google and Tesla to develop new, innovative products that will disrupt traditional care delivery models while fundamentally improving the senior living experience.
Mace: What types of communities are poised for success?
Gray: I think we’ll see more multi-generational housing options that will appeal to more active seniors, perhaps joint ventures between seniors and student housing providers. Seniors want to live in places where there are more entertainment and cultural activities that are closer to the city center or a commercial district in a suburban setting. Increasingly, community planners are striving to make their towns more senior-friendly, walkable and social. At the same time, we see the emergence of niche communities that cater to special groups, such as LGBT seniors, and seniors with cultural and activity affinities, as well as communities that focus on sustainability and “green” practices. I’m also watching offshoot products, such as transitional care properties which concentrate on the short-stay rehab business.
Mace: What other important industry changes do you see?
Gray: Assisted living is adjusting to accommodate residents with higher needs, providing some of the same services as a skilled nursing facility. By the same token, the demographics of independent living are now more like assisted living was 10 years ago. Independent living residents can bring in home health care services and don’t need to relocate and downsize living space as they may have before.
Mace: How would you characterize the lending market?
Gray: Banks are pulling back because of regulatory limits on commercial real estate lending associated with Basel III and capital tier ratios. They’re providing lower leverage deals with recourse requirements. I’ve found a niche by offering higher leverage and non-recourse loans. RED is primarily an agency lender for Fannie Mae and FHA/ HUD. We have a proprietary balance sheet that drives our agency business. We’ve made our name doing bridge deals from construction or mini-perm loans to permanent agency financing.
Insurance companies are more active in the lending market, but they don’t like projects meant for high-acuity residents. The REITs have spun off their skilled nursing properties, and they’re lending again. But I see more owners and operators who don’t want to sell their real estate and are seeking more traditional mortgage financing options.
Mace: How do you make lending decisions?
Gray: We look at the landscape and try to figure out who we should be lending to. Do we avoid certain markets? Absolutely. I rely on NIC resources such as NIC MAP to tell me which markets pose risks that we can’t readily mitigate. I’m particularly concerned about the overbuilding of memory care.
We want the interests of all the property stakeholders to be aligned—both the owner and operator. We also want a borrower that has financial liquidity and experience in a particular market and product type. I also look for owner/operators with vision. I seek out unique opportunities to finance people who are committed to changing the industry in a fundamental way.
Mace: What product types do you like?
Gray: We prefer assisted living, memory care and skilled nursing facilities. We don’t finance CCRCs. I like private pay assisted living, but I also have to consider the residents’ ability to pay. Since the recession, many homeowners don’t have the equity in their homes they once did to use to finance long-term care costs. More than ever, we need an affordable seniors housing product. Right now we are only providing housing for the most affluent Americans. That’s not sustainable.
Mace: Do you have a size limit on loans?
Gray: No, although anything over $50 million is reviewed by our parent ORIX Corp., in Japan.
Mace: There are a lot of newcomers to the industry. What financing challenges do they face?
Gray: Developers new to the industry who bring in third-party operators with a lease agreement may not have properly aligned interests and may make decisions that don’t benefit their own long-term success. For example, an undercapitalized owner may try to use a mezzanine loan to raise project equity that doesn’t leave enough money to make capital improvements or position the property to compete against other communities. Mace: With interest rates rising and the yield curve flattening, where are we in the economic cycle? Have your strategies changed in the last 12 months?
Mace: With interest rates rising and the yield curve flattening, where are we in the economic cycle? Have your strategies changed in the last 12 months?
Gray: There’s a lot going on outside the industry that’s impacting our sector, including the new administration in Washington, D.C., the unraveling of regulations, and the situation overseas. Markets are reacting to sound bites and perceptions. Interest rates are not as dependent on the economy as they once were. I think we could see a business correction in the next couple of years. That means there’ll be a desire among borrowers to put long-term permanent financing in place because they’ll want to ease their worries.
Mace: Any other thoughts?
Gray: I’d like to recommend a book, “Homo Deus: A Brief History of Tomorrow,” by Yuval Noah Harari. For the first time ever, more people die from eating too much than from eating too little; more people die from old age than from infectious diseases. The book explores the trends that will shape the 21st Century. It’s good to look outside our industry for new perspectives to help map the changes needed to successfully navigate our future. I often reflect on Fran Lebowitz’ phrase:“Think before you speak. Read before you think.” [/expand] [cresta-social-share]