Thoughts from NIC’s Chief Economist
Setting the Economic Stage for 2017

With a new year in swing, a new Administration forming, a number of campaign promises to be considered, and a new team of economists advising President Trump on fiscal policy, the economic outlook is a bit murky. In December’s Federal Open Market Committee (FOMC) minutes, the Federal Reserve wrote:
“In their discussion of their economic forecasts, participants (of the FOMC) emphasized their considerable uncertainty about the timing, size and composition of any future fiscal and other economic policy initiatives.”
The FOMC quote points out the myriad unknowns facing the Federal Reserve—and business decision makers—as the Trump administration potentially implements sizable tax cuts and greater government spending. Nevertheless, despite these and other unknowns, market sentiment has generally been positive, with the Dow Jones Industrial Average closing in on a record-achieving 20,000 watershed mark, measures of consumer confidence clocking in near 13-year highs, and strong hiring practices being recorded.[expand title=”Read More” trigpos=”below” tag=”div” trigclass=”nic-read-more”]
This commentary provides a brief review of several key macroeconomic indicators that influence and shape the environment for seniors housing and care operators, investors, and capital providers. These indicators provide the economic landscape, so to speak, as we head further into 2017 and serve as a backdrop for our sector’s decision makers for this coming year or two. The measurements that will be discussed include the overall strength of the economy as measured by inflation-adjusted gross domestic product (GDP), the job market, the housing sector, consumer confidence, household net worth, the stock market, wage growth and inflation, Fed policy, and interest rates.
The Labor Market
With 5.5 million unfilled job openings, an average of 180,000 jobs being created every month, and an unemployment rate of 4.7% as of December 2016, the labor market is close to full employment—the point in the economic cycle where everyone who wants work has work. This pace of overall growth is more than enough to keep up with growth in the working age population while putting downward pressure on the jobless rate. (Job growth generally needs to average just 100,000 per month to keep up with growth in the working age population, according to estimates by Moody’s Analytics.)
Since the low point of recession in 2010, more than 15 million jobs have been created in the U.S. economy, and the jobless rate is half its peak of 10% in October 2009. Over the past 12 months, healthcare alone has generated 407,000 jobs. While generally perceived as a good thing, strong job growth has resulted in both job and skilled labor shortages in some parts of the economy; in our sector, care providers and management team positions are increasingly hard to fill.
Wage Growth and Inflation
Despite a tightening of the labor market, wage growth has been relatively weak. Average hourly earnings grew by only 2.1% in 2014 and by 2.3% in 2015. December 2016 showed signs of acceleration with annual growth of 2.9%—the strongest growth in this expansion. Increases in minimum wage rates in many states and tightening labor markets may start to put further upward pressure on this measure of earnings. Anecdotally, operators of seniors housing and care properties are reporting upward pressures on wage rates, particularly on the two coasts. This is a growing concern among many operators because labor expenses can account for up to two-thirds of an operator’s aggregate expenses.
Inflation in general has been rather benign, with core consumer inflation averaging less than 2%. However, the stage is set for inflation to accelerate due to tightening labor market conditions, higher oil and energy prices, and rising home prices and apartment rents. Additionally, the new administration’s fiscal spending policies could put upward pressure on prices, largely because the economy is already near full employment. Further appreciation of the dollar could offset this to some degree.
Housing
It is generally believed that the state of the residential for-sale housing market affects move-in velocity for seniors housing properties. This is because the equity from the sale of a resident’s home is often used to pay monthly fees or, in the case of continuing care retirement communities (CCRCs), entrance fees. Both the listing time on the market and the price level achieved are important considerations for residents as they make life-style choices on where to live.
The recovery of the housing market has generally been slow since the Great Financial Crisis (GFC) but it does continue to improve. While it took 10 years, the median price of an existing home in November 2016 ($235,000) was 2% higher than the 2006 pre-recession peak. Additionally, existing home sales in November rose to their highest level since February 2007, while single-family housing starts are projected to total 1.04 million annualized units this year, the most since 2007, according to estimates by Moody’s Analytics. That said, a shortage of buildable lots and skilled labor, as well as a lack of available capital for smaller builders and higher mortgage rates, could be limiting factors.
Confidence, Stocks, and Net Worth
Consumer confidence is strong. Indeed, according to the University of Michigan’s index, consumer confidence remains close to its highest level in 13 years. Relatively low gas prices, growing job prospects, rising incomes, and a bull market have been contributing factors.
In recent weeks, the stock market has established new highs. And largely as a result of gains in the value of real estate and in equities, household net worth rose by more than $1 trillion in the second quarter of 2016 to a record peak of $89 trillion. For seniors housing, the combination of strong confidence and rising household net worth are positive precursors for strong demand.
While a lot of household net worth gains have gone to higher-end households, incomes have risen for all households, as well. Indeed, inflation-adjusted median household income rose by 5.2% in 2015, the largest increase since at least 1968, while the poverty rate fell to a post-recession low (although it remains uncomfortably high at 13.5% compared with 11% in 2000).
For households headed by someone 65 and older, inflation-adjusted median household income rose by 4.3% in 2016, less than the 7% gain achieved by those households headed by someone aged 34-45, but better than the decline of 1.2% seen by the older cohort in 2014. Moreover, household debt service burdens are as low as they have been in the nearly 50 years since the data has been collected, and households have locked in the record-low interest rates after repeated opportunities to refinance their mortgages.
GDP and Potential Growth
On the less bright side are broad measures of economic growth. These include inflation-adjusted GDP, which has grown at just a bit more than 2% since the economy emerged from recession in mid-2009. (The most recent report painted a better showing, with a 3.5% gain in the third quarter of 2016.) The subpar growth reflects weak productivity growth, which has averaged less than 1% over the past five years, and a low rate of labor force participation that remains at levels last seen in the 1970s. The retirement of baby boomers partly explains the low participation rate.
Looking ahead, some pundits suggest that the new presidential administration’s fiscal policies may be able to stimulate GDP growth in excess of 3.5%. This may be difficult to achieve. Economic growth is the result of labor force growth and demographic trends, productivity advances, and capital formation (the availability of capital per worker). Demographics patterns in the U.S. today do not support strong gains in the working age population and labor force without changes in immigration rates, while productivity growth has been stubbornly weak.
The Congressional Budget Office (CBO) estimates that during the 1950–1973 period, the labor force grew 1.6% per year, while labor productivity grew at a strong 2.4% rate, resulting in overall potential growth of 4% annually. Recent CBO estimates of labor force growth are now 0.5%, and the CBO puts productivity growth at 1.4%, creating potential GDP growth of 1.9% for the 2016–2026 period. To achieve 3.5% growth, productivity would have to grow at 3.0%—significantly faster than its record-setting 1950–1973 rate. While this is not impossible, it is not readily possible either.
Monetary Policy and Interest Rates
Financing costs are rising, although they still remain low by historical standards. The 10-year Treasury bond fell to a record low of 1.3% in the immediate aftermath of Brexit last June, and as of January 17, 2017, it stood at 2.4%. Looking ahead, it is very likely that rates will move higher in 2017.
Fed watchers are predicting three or four increases of 25 basis points in the federal funds rate during 2017, bringing the short-term benchmark interest rate to between 1.25% and 1.5% by year-end 2017. One supporting argument for this point of view is that the new administration’s call for sizable tax cuts and greater government spending will pressure the Federal Reserve to normalize interest rates more quickly than it would ordinarily due to heightened inflationary pressures and concerns that the labor market could become too tight. Likewise, the long end of the yield curve will move up 75 to 100 basis points, pushing the 10-year Treasury yield above 3.0%.
That said, many interest rate prognosticators have been predicting higher interest rates for many years. Today, even greater uncertainty about fiscal and monetary policies exists, making predictions that more challenging, as evidenced by the FOMC’s December minutes quoted previously.
Length of Expansion
As we enter 2017 and mark the eighth year of economic expansion, the economy is fundamentally sound. Only one post-wartime expansion has been longer: the 10-year, internet-fueled 1990s era. Nevertheless, an expansion does not die from old age, and the odds of a recession occurring in the next 12 months are low, according to most prognosticators.
Typically, the yield curve inverts when a recession is imminent. This is when short-term rates rise above long term rates. That is not the case today. With the three-month Treasury bill rate of 0.5% and the 10-year Treasury bond of 2.4%, a positive differential of 190 basis points exists. Yield curve inversions have accurately predicted every recession since World War II, with a lead time of between 12 and 24 months, according to analysis conducted by Moody’s Analytics. Another condition typically necessary for recession is an overheating economy—that is, an economy operating beyond full employment, with accelerating inflation and quickly rising interest rates. This is also not the case at this time. Finally, an exogenous shock to the economy, such as an oil price surge or a global war, can tip an economy into the recession. While no one is predicting such an event at this time, rising political and economic tensions around the world are palpable.
As always, I welcome your feedback, thoughts, and comments.
Beth
Focus on the Forum: Economic, Capital, and Policy Trends
Political and policy changes have left seniors housing and care with a lot of uncertainty—and emerging opportunities. Get the most recent economic, valuation, and supply and demand trends at the 2017 NIC Spring Investment Forum, March 22–24 in San Diego.
Sessions include:
- The Economy in 2017 and Its Impact on Seniors Housing and Care: Get the 2017 economic outlook and latest NIC data on seniors housing and skilled nursing, as Beth Mace and expert panelists discuss market conditions, supply and demand trends, and the new administration’s policies and priorities.
- Redefining Valuations in Collaborative Business Models: Find out how the evolving health care delivery landscape will influence valuation methodologies and metrics in this informative how-to session on the relationship between appraisers, investors, and operators, how they assess the true value of a potential acquisition, and the impact of value-based payment models on pro forma calculations.
- Responding to Slow Seniors Housing Lease-Ups & Increased Competition: Discover how seniors housing property types, including memory care, are performing across the country, and learn practical strategies for succeeding in a competitive landscape.
View the full schedule of sessions, or register for the Forum now.[/expand] [cresta-social-share]
Seniors Housing Occupancy Stable, While Demand for Independent Living Grows Rapidly
The Five Takeaways from NIC MAP’s Fourth-Quarter Seniors Housing Data Release
NIC MAP® Data Service clients attended a webinar earlier this month on the key seniors housing data trends during the fourth quarter of 2016. Five key takeaways emerged:
- Seniors housing occupancy remained relatively stable at 89.6% in the fourth quarter, while assisted living occupancy fell to its lowest level since early 2010, and independent living occupancy remained close to its seven-year high.
- The quarter’s seniors housing inventory growth and unit absorption were each the highest recorded to date within one quarter.
- Construction starts continued to ease.
- Same-store rent growth remained strong.
- The sales transaction volume across seniors housing and skilled nursing properties eased to $14 billion overall for 2016, as fewer large deals closed. (See Bill Kauffman’s blog post for more information on transactions volume in the fourth quarter.)
Let’s take a closer look at some of these trends.[expand title=”Read More” trigpos=”below” tag=”div” trigclass=”nic-read-more”]
Seniors Housing Occupancy Continues to Oscillate
The all occupancy rate for seniors housing, which includes properties still in lease up, was 89.6% in the fourth quarter, down 10 basis points from the third quarter and down 50 basis points from year-earlier levels. During the past four years, occupancy has averaged just slightly higher at 89.7%. As of the fourth quarter of 2016, occupancy was 270 basis points above its cyclical low of 86.9% during the first quarter of 2010 and 70 basis points below its most recent high of 90.3% in the fourth quarter of 2014.
The quarterly decrease in occupancy stemmed from a record increase in inventory of more than 5,900 units. However, it is notable that net absorption also reached a record high of nearly 4,700 units during the quarter. In other words, demand was very strong—just not strong enough.
For the full year, there were more than 17,000 units added to inventory, the most since at least 2006, when NIC started to report this time series of data. Net absorption totaled nearly 13,000 units for the full year, also the most in a single calendar year.
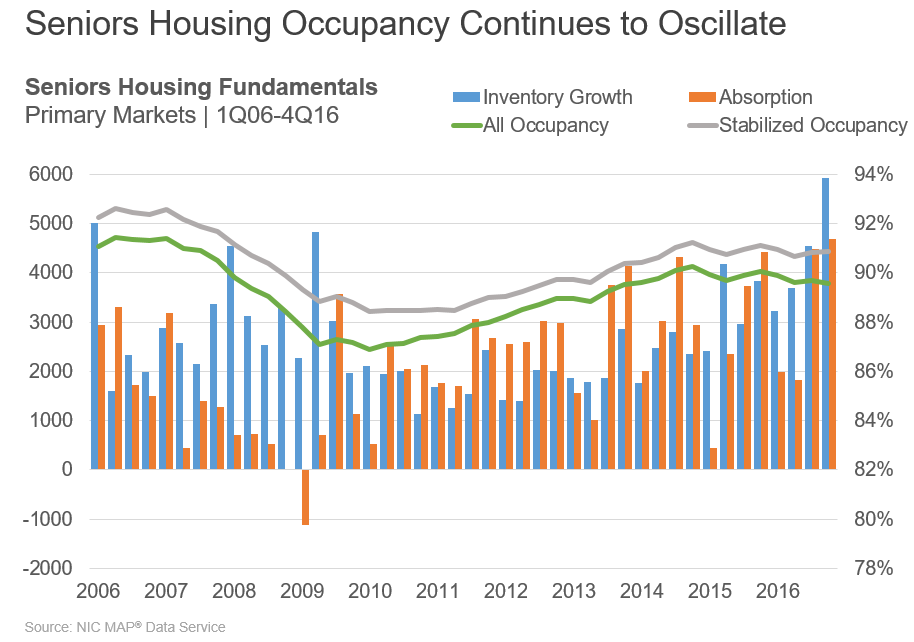
The surge in inventory was dominated by majority assisted living properties, which accounted for two of every three units that came online. During the quarter, more than 4,000 assisted living units were added to inventory. The rate of inventory growth isn’t really surprising, however, because it reflects the jump in starts that we saw 18 to 24 months ago. Demand for assisted living was also quite strong in the fourth quarter, but again, it was not quite strong enough. In fact, since 2006 when NIC began reporting this data, there has not been a single quarter of stronger net absorption of assisted living units.
And for independent living, overall occupancy stayed close to a seven-year high as demand and supply largely matched one another. Demand remained strong, but not as strong as in the third quarter, when it reached a near-record peak.
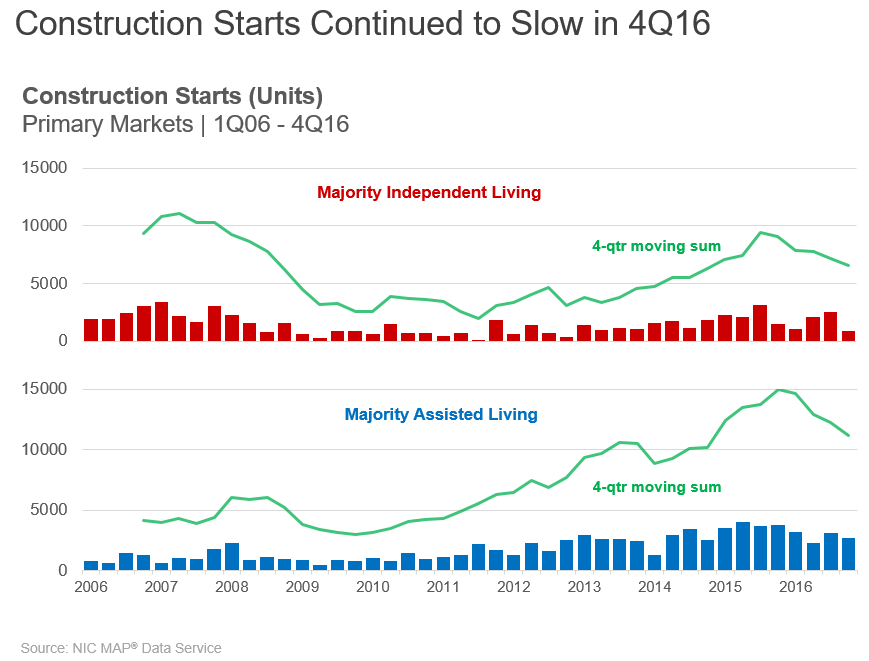
Construction Starts Slowing
For independent living, starts totaled 882 units in the fourth quarter, the slowest pace since late 2012. On a four-quarter aggregate basis, starts totaled 6,551 units, the weakest pace since late 2014.
For assisted living, starts slowed in the fourth quarter to 2,672 units, and on a full-year basis, they totaled 11,168 units, the weakest pace also since late 2014.
Anecdotally, NIC’s data collection team has observed that a number of projects in planning stages have been on hold due to lack of funding. Some had changes in ownership, which have caused plans and delivery dates to change or delays to occur because the proper paperwork was not submitted or permissions not granted from Planning Boards. It also may be that greater awareness of supply and tightening credit for development are beginning to slow starts. Banks are being more cautious in their lending and appear to be guarded in their loans for all but the well-known and trusted sponsors. Nevertheless, operators still need to work through the current cycle of development and the heightened competitive position they may find themselves in.
Starts data are also often reported with a lag, so revisions are not unusual, and the figures initially reported may be revised upward later. For the four quarters ending in the third quarter, assisted living starts were initially reported at 11,285 units as of September. Data revisions now show that assisted living starts tallied in at 12,262 units, a difference of 977 units or 9% more than initially estimated. For independent living starts, this revision was 939 units, or 15%.
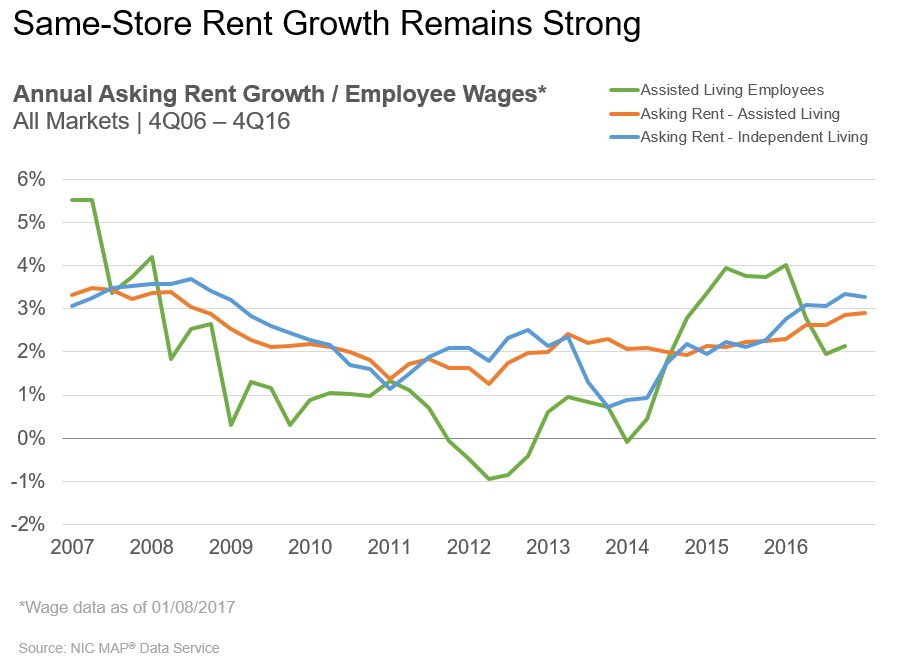
Asking Rent Growth Strong
Same-store asking rent growth for seniors housing remained strong in the fourth quarter, closing the year at a 3.7% annual pace, the same as in the third quarter and the highest level since 2007. Asking rent growth for assisted living (the orange line in the chart that follows) was 3.1% for the fourth quarter, also the same as in the third quarter and the strongest since early 2008. For independent living (the blue line), rent growth decelerated a bit to 4.0% from 4.2% in the third quarter, when rent growth reached its highest pace since NIC began reporting this data.
There is wide variation in rent growth, however. San Antonio experienced gains of 1.2% in seniors housing asking rents from year-earlier levels, while San Jose saw gains of nearly 6%. Other metro areas with gains greater than 5% include Philadelphia and Sacramento.
Within the following exhibit, we’ve compared asking rent growth to the changes in average hourly earnings for assisted living workers, figures that are tracked and monitored by the U.S. Bureau of Labor Statistics. Average hourly earnings were up 2.9% for assisted living employees.
Looking Ahead
Our forecast projects that the occupancy rate for assisted living will stay close to today’s levels at between 87% and 88%. Since late 2010, occupancy has maintained a rate in the 87%–89% range, and our expectation is that this will remain the case for the next four quarters. For independent living, we are forecasting another several quarters of occupancy hovering near 91%. We expect that inventory growth will pick up in early 2017 based on starts activity from mid-to-late 2015. Demand continues to hold up nicely, and our expectation is that this will continue to be the case.
Focus on the Forum: Investing in Seniors Housing & Care
New opportunities for collaboration in senior care are changing the way investors look at the industry. Hear the latest seniors housing and skilled nursing data from NIC and discover how these new collaborations are influencing investments at the 2017 NIC Spring Investment Forum, March 22–24 in San Diego.
Session highlights include:
- A Deep Dive into Seniors Housing Local Market Conditions: Take a detailed look into seniors housing conditions at the local market level. NIC Chief Economist Beth Mace will reveal 2016 local market conditions and share insight into factors that influence performance through a comparison of California’s generally healthy markets with those in Texas struggling with oversupply.
- Hot New Investments in Senior Care: Examine new business models that are innovating care for frail seniors and fueling investors’ interest, and gain insight into how they can enhance operational capabilities and increase value to payors and consumers.
- Real Estate Investment in a Coordinated Healthcare World: Discover the practical realities of investing in a world where senior living and its associated care is blended with home care as well as other programs and services in order to complete a coordinated continuum.
View the full schedule of sessions, or register for the Forum now.[/expand] [cresta-social-share]
Skilled Nursing Data Update
Takeaways from Our Third-Quarter Report

NIC released its latest Skilled Nursing Data Report in December, providing key monthly data points from October 2011 through September 2016. The key takeaways from this latest quarterly report are as follows:
- Despite seasonality expectations, occupancy recovered only slightly from the July low.
- The decline of managed Medicare revenue per patient day (RPPD) was stable for the second consecutive quarter.
- Private-pay RPPD grew at a faster rate, exceeding inflation.
- The downward trend in skilled mix persists. The drop in Medicare patient days is a possible explanation.
The current report is based on data that is collected on a monthly basis and reported quarterly, on a national aggregate level, from approximately 20 operators and 1,500 properties. The plan is to grow the data set with more operators and properties in order to allow NIC to report at the state level. Operators around the country are welcome to participate in contributing data and will receive a free benchmark report every month for their participation.
The following is a closer look at the latest trends, including some of the latest data.[expand title=”Read More” trigpos=”below” tag=”div” trigclass=”nic-read-more”]
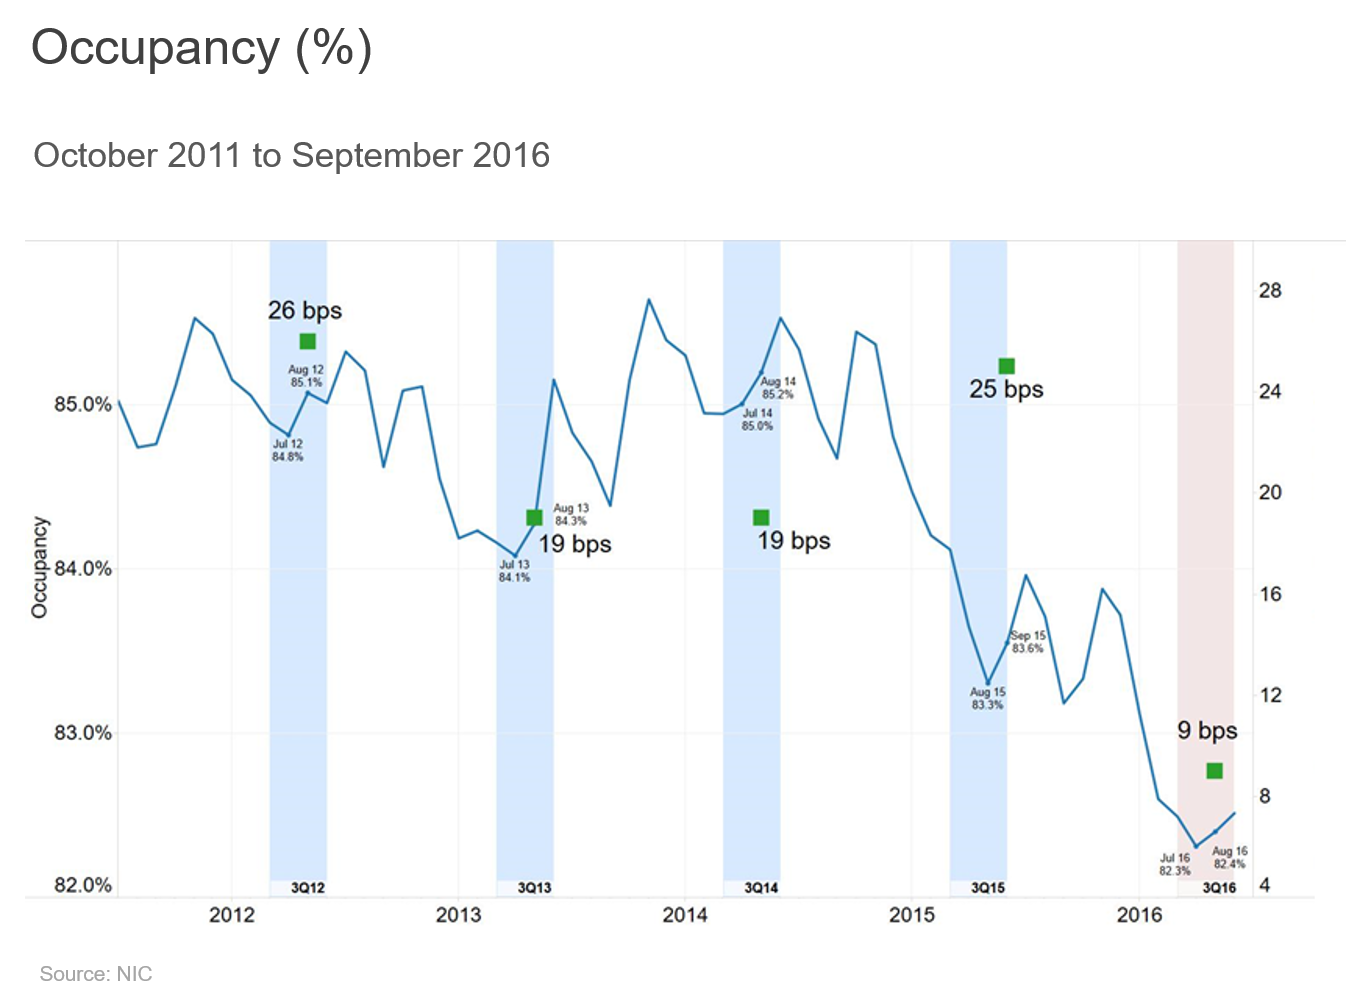
Occupancy Flat Quarter-Over-Quarter
Occupancy ended at 82.5% in the third quarter, the same rate as in the second quarter. (The September monthly rate serves as the third-quarter rate.) It recovered slightly from the five-year low occupancy rate of 82.3% in July, but still remained relatively weak. Historically, the month with lowest occupancy is in the third or fourth quarter, and the month with the highest occupancy is in the first quarter, when seasonality factors, such as flu, drive demand.
The highlighted bars in the following chart show the typical degree of recovery in occupancy from the lowest month in the quarter to the following month. Historically, this bounce back has been 16 to 19 basis points, higher than the third-quarter 2016 change of 9 basis points. Therefore, occupancy most likely reached its 2016 peak in the third quarter unless an early flu season or other factor changed the trend in the fourth quarter.
Year-over-year occupancy was down 100 basis points from 83.5% a year earlier in September 2015. NIC will be monitoring the fourth-quarter 2016 data to see if the occupancy bounce from its July low means that occupancy has stabilized.
When looking at occupancy, one should be careful about drawing a complete conclusion as far as the total economics of the business. Occupancy historically has been an important metric to follow, and it still is, but understanding the relationship between occupancy and the current economics of the operating business is just as important. With some operators transitioning into higher acuity patient care, it is possible that an operating business captures lower patient days because of the lower length of stay for a greater number of Medicare rehab patients, for example. That will cause occupancy to decline. However, it is also possible that, all else being equal, the higher reimbursement rates for higher acuity patients will mitigate some of the pressure on cash flow from lower occupancy, as long as the volume of patient admissions is strong and expenses (e.g., labor expenses) do not increase more than the incremental revenue. In stating that, the large drop in occupancy in the second quarter does seem significant for the operating businesses, especially as skilled mix has decreased.
Skilled Mix Remains a Challenge
Skilled mix continued its downward trend in the third quarter, declining from 24.4% in June 2016 to 23.8%. (Skilled mix is the percentage of a nursing home’s occupancy that is attributed to Medicare and managed Medicare as opposed to Medicaid or private pay.) This was driven by the low third-quarter Medicare mix, which was most likely attributable to fewer Medicare patient days. Medicare patient day mix dropped from 13.4% to 12.7% quarter-over-quarter. Since higher reimbursement rates are associated with skilled mix, the downward pressure on that mix can play a significant role in profitability.
As the Medicare mix declines, it increases Medicaid’s relevance and significance as a steady payor source. Medicaid patient day mix increased from 66%.0 to 66.5% quarter-over-quarter, with a larger increase year-over-year from 65.0% in September of 2015. Although Medicaid reimburses at a lower rate than Medicare or managed Medicare, it still represents a relatively reliable revenue stream for operators. However, any increases in Medicaid mix most likely will not offset the revenue loss from the declining skilled mix, even with the combination of gradually increasing Medicaid revenue per patient day.

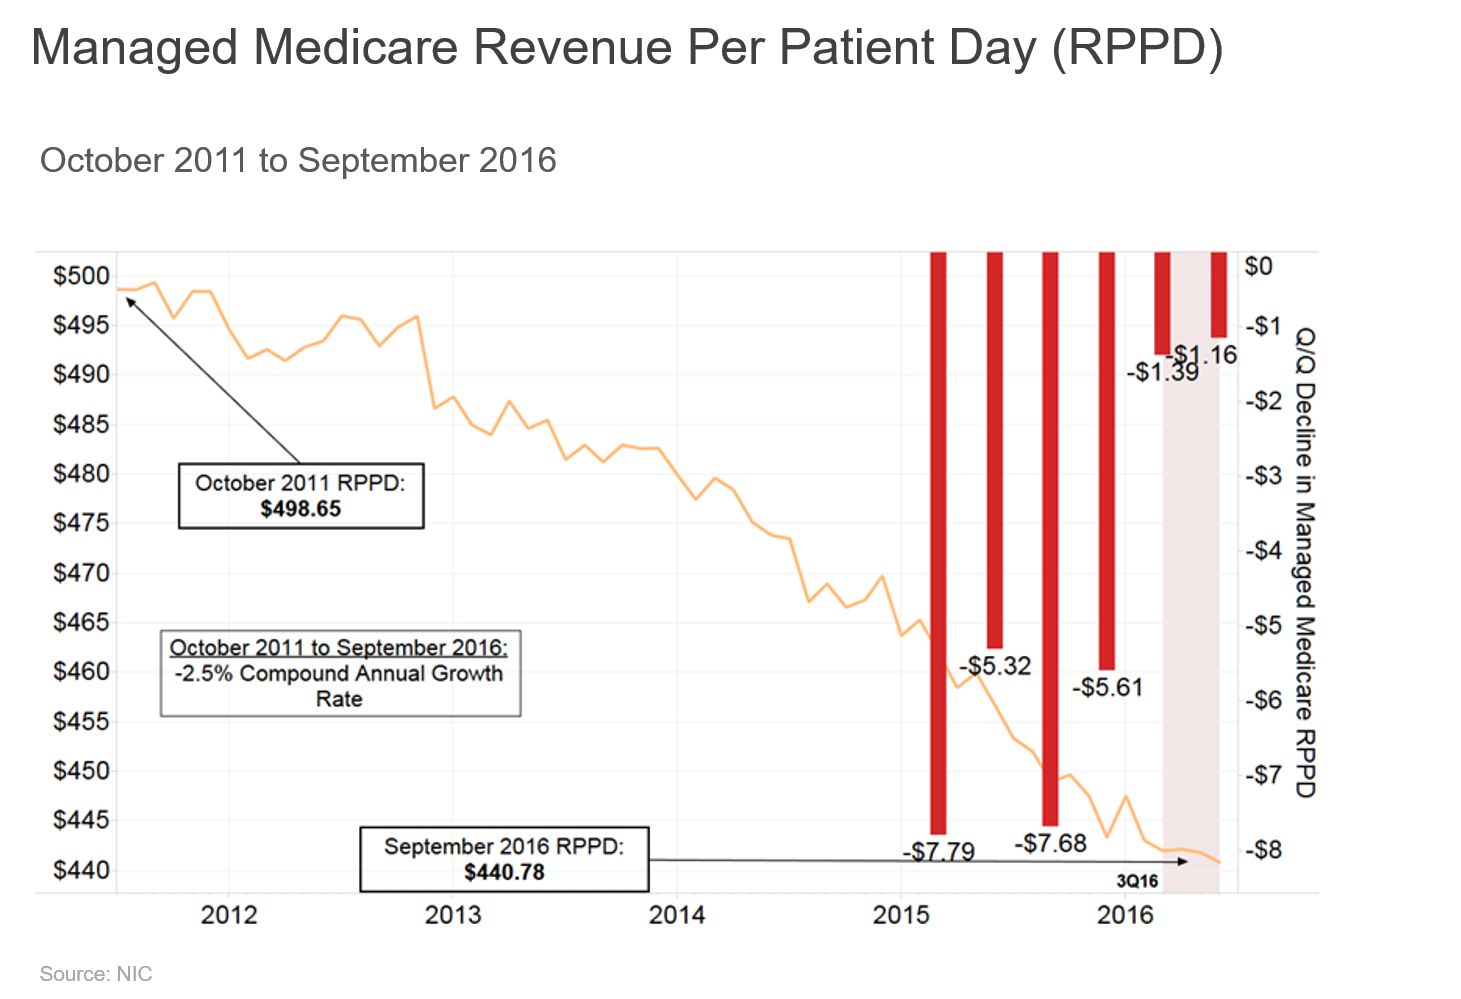
Decline in Managed Medicare Revenue Per Patient Day Stabilizing?
After years of declining managed Medicare reimbursement rates, the second and third quarters of 2016 show the rate of decline abating. This indicates that revenue per patient day (RPPD) appears to be stabilizing. The quarter-over-quarter rate of decline was 0.3% in the third quarter, which was slightly slower than in the second quarter.
Prior to that, the four quarters that preceded second-quarter 2016 experienced an average quarter-over-quarter growth rate of -1.4%. The year-over-year decline as of September 2015 was steep at 3.5%, but we saw a slight improvement from the year-over-year change of 3.6% as of September 2014. This yearly trend will begin to flatten if quarterly rate declines continue to slow or stabilize.
Managed Medicare revenue has been a hot topic since penetration began increasing rapidly over the last few years. The increased enrollment in managed Medicare plans has given more pricing power to insurance companies, who have been able to negotiate reimbursement rates with providers. This is one reason why we have seen a decrease of 11.6% in RPPD from $498.65 in October 2011 to $440.78 in September 2016.
Private-Pay RPPD Growth Rate Increased
Private-pay RPPD grew year-over-year at 2.1%, marking the highest increase since the third and fourth quarters of 2013. In September 2015, the RPPD was $246.14, and it rose to $251.32 as of the third-quarter 2016. Private RPPD increases have consistently outperformed inflation since February 2016 and have outperformed or matched inflation since fourth-quarter 2014. The latest quarter-over-quarter increase was 0.10%. Preliminary research indicates that the impact of increases in private-pay RPPD may be more significant for rural markets due to a higher share of private-pay residents as compared to urban properties.

In-Depth Skilled Nursing Coverage at the Forum
Interested in learning more about current skilled nursing trends? Curious about emerging opportunities to unlock value through new collaborations? Check out these and other sessions at the 2017 NIC Spring Investment Forum, March 22–24 in San Diego:
- Skilled Nursing Trends and Strategic Responses: Explore operational and financial strategies for capturing opportunities and managing risk, as panelists share a critical analysis of the latest and year-over-year trends and a review of NIC skilled nursing data.
- Unlocking Value with Quality Metrics: Get an overview on prevalent health care quality metrics today, and hear about the new metrics some private-pay seniors housing and government-reimbursed skilled nursing operators are exploring in order to deliver and demonstrate value and alignment of interests with consumers, payers, physicians, hospitals, or lenders.
Take a look at the full schedule of sessions for the Forum.[/expand] [cresta-social-share]
The Components of Market Analysis for Seniors Housing and Care
An Introduction to Market Studies

In seniors housing, as with other types of real estate investment and development, intuition isn’t enough to make a decision on whether or not to invest, develop, acquire, or lend. Disengaged from rigorous analysis, our gut instinct is unpredictable and just as likely to steer us to failure as to success. And the more complex the situation, the more misleading our intuition may become.
So how do successful sponsors evaluate opportunities for development or acquisition in the sector, and how do the data affect a project’s, positioning, marketing strategy and potentially final design strategies? In short, they often conduct a market study.
Market studies are a critical element of strategic investment plans, project planning, and project financing for new development, repositioning, and expansions. Traditionally conducted by major accounting firms after planning is completed, investors and developers often conduct a market study prior to seeking financing to determine whether the project is a “go” or “no go,” thereby helping to avoid costly mistakes.[expand title=”Read More” trigpos=”below” tag=”div” trigclass=”nic-read-more”]
“Detached from rigorous analysis, intuition is a fickle and undependable guide—it is as likely to lead to disaster as to success. And while some have argued that intuition becomes more valuable in highly complex and changeable environments, the opposite is actually true. The more options you have to evaluate, the more data you have to weigh, and the more unprecedented the challenges you face, the less you should rely on instinct and the more on reason and analysis.”
— Eric Bonabeau, Harvard Business Review
First Steps: Reviewing Key Metrics
When investors want to invest in a senior living property, they will often perform an initial desktop review of the geographic, demographic, and economic conditions of a given area, often starting the search by analyzing regions of the country and scanning for metropolitan areas with the greatest potential to support development. At this point, they must clarify several components of the market in a broad economic sense so that the prospective project will be aligned with market trends and address unmet need.
The preliminary investigation naturally starts with a review of the key metrics reported by data providers such as the NIC MAP® Data Service:
- Supply and demand patterns, property status, and unit mix
- Current construction starts, including those that have broken ground or are in the construction pipeline, as well as those that are entitled and slated for future development
- Rent levels and growth rates
- Stabilized occupancy rates (which do not take into account recently opened properties) compared with all occupancy rates
- Competitive properties and market share
- Age of existing stock
- Market penetration
If the initial review of the key metrics indicates that market penetration and the competitive environment are favorable, the next step is to conduct a market study.
The Science—and Art—of Seniors Housing and Care Market Studies
Market studies are part art and part science, especially for seniors housing and skilled nursing properties. The growing complexity of changing demographics and attitudes about senior living, shifting health care policy, supply growth, and uncertain economic conditions are making strong market analyses more essential than ever before. Moreover, analyzing senior living markets involves highly specialized skill.
According to the Urban Land Institute, a successful market study comprises a number of deliberate analyses that build upon each other with a logical flow:
- Identify key stakeholders. Will the property feature a majority of independent living residences, assisted living apartments, memory care suites, or skilled nursing beds, or will it provide a full continuum of care? Will the property be comprised of a singular standalone building or be comprised across multiple building on a campus? Will the offering combine multiple seniors housing product types? How many residences will the property have? What are the distinctive features being considered, and what is the anticipated level of acuity to be served?
- Identify the characteristics of the proposed development’s location. Is it located in a rural, suburban, or urban setting, and how are homes in the surrounding neighborhood priced? Is the area on the cusp of gentrification or is crime a concern? How easy is access to the site? How is the land currently being used? What are the land uses of the neighboring properties? Are there any known regulatory issues, zoning and parking requirements or other limitations?
- Identify the age and income qualifications of the target market. Who will be able to afford living in the new development or expansion? What is the minimum age? What are the minimum income and asset qualifications?
- Connect the data with the geography. It’s challenging to understand data without context, and demographic data can be shown on a heat map using GIS software in order to observe areas of strong concentrations of target market households.
- Observe the influencers. Are there significant concentrations of the adult child cohort (typically those households aged 45 to 64)? Is the site conveniently located relative to where the adult children live or work?
- Define primary and secondary market areas from which the majority of demand will originate. Consider the strength of the distribution of qualified senior households and their adult children, as well as their proximity to the site, the impact of barriers to migration and mobility, and the locations of other seniors housing properties.
- Explore the target market’s characteristics. Will residents and family members be attracted by the area’s unique amenities (such as a nearby college or university, places of worship, cultural attractions, outdoor activities, sports arenas, and proximity to public transportation, hospitals, and doctors)? Is employment strong? What are the major industries? Who are the primary employers?
- Estimate supply and demand. What is the overall number of target market households in the market area that could be attracted to a new senior living development? Does demographic segmentation of the market show that the seniors population is growing or shrinking? Where are comparable properties located, and how many and what type of residences do they have? What is the project’s market position relative to key competitors? Other sources of useful information include contact with planning and zoning offices to identify future seniors housing developments and soliciting the opinions of local market experts.
- Ask the customer directly. Engage a seniors housing market research expert to conduct consumer research that will help quantify interest in the project, refine primary market area boundaries, determine site acceptance or choose between more than one site, and elicit input on preliminary design and amenity offerings.
The time and effort required to conduct a quality market study may be significant, but it is most often critical for the creation of a successful project—especially when human intuition may have been the primary driver of a project. If the market study’s results are favorable, the project moves forward to the next phase of determining financial feasibility. If the feasibility study is favorable, the sponsor will use the study to build a case for financing, and developers will be engaged to start master planning.
In future editions of the NIC Insider, I will drill down into common methodologies and the nuances of each step in the market study process. Also check out the NIC blog for our 2017 series of posts about market studies.
Strategies for Slow Lease-Ups & Increased Competition
Are you considering entering or expanding into a new market? Are your prospects attracted to that shiny new building that just opened down the street?
In the “Slow Seniors Housing Lease-Ups & Increased Competition” session at the 2017 NIC Spring Investment Forum, March 22–24 in San Diego, experts will shed some light on how they’ve generated success in competitive markets—and give insight into why some properties fare well while others do not.
Don’t miss this session. Register for the Forum now.[/expand] [cresta-social-share]
Medicaid Block Grants: Speculation or New Direction?

In the executive order President Trump signed on his first day in office, he instructed federal agencies to prepare to grant the states more flexibility in managing their health care programs. According to a Sunday Today interview with Kellyanne Conway, Counselor to the President, the transition to Medicaid block grants will ensure that “those who are closest to the people in need will be administering” health care programs. While the executive order does not state explicitly that Medicaid, the healthcare program for low-income people, will transition to a block grant system, the wording does allude to that type of reform.
The topic of block grants has come up frequently since the November election. Prior to the executive order and Ms. Conway’s statements, block grants had been mostly speculation, but now the prospective shift appears imminent—and would be a major change for all providers participating in Medicaid.[expand title=”Read More” trigpos=”below” tag=”div” trigclass=”nic-read-more”]
Block Grants Defined
Right now, Medicaid is funded in part by the states and in part by the federal government. The amount states receive from the federal government for Medicaid is based on the number of people enrolled. As a greater number of people fall below the Medicaid eligibility threshold, states get more Medicaid dollars to care for them. The federal government ties that money to rules and regulations governing how the states administer their Medicaid programs. If states waive those rules, they can apply to the Centers for Medicare and Medicaid (CMS) for a waiver. States that expanded Medicaid received federal funding to lower the Medicaid eligibility requirements, meaning the states could cover more people than in the past because the federal government was subsidizing the additional Medicaid coverage.
Under block grants, states would receive a single payment: the block grant. The grant amount would be determined by the federal government, a process that could be highly politicized.
Pros, Cons, and In-Betweens
Supporters of block grants say the method would:
- Reduce fraud, waste, and abuse
- Give states flexibility to experiment with programs that work for their residents
Opponents argue block grants would:
- Shift administrative costs from the federal government to the states
- Lead to decreased federal funding over time
As with many policies, the truth probably will be found somewhere in the middle. For example, if the grant amount calculation takes into consideration the transfer of administrative costs from the federal government to the states, the first concern from opponents is eliminated. On the other hand, if the calculated amount is too small or does not grow proportionately to match an increase in enrollment because more people fall below the poverty line, then the states would have less flexibility to provide care because they would be restricted by a smaller budget.
The heart of the policy is in the methodology used to determine the size of the grant, and that methodology could be shaped in a number of different ways.
Process to Shift Medicaid to Block Grants
The executive order prepares federal agencies to begin the process of making Medicaid more flexible for the states. Repealing the Affordable Care Act (ACA) does not repeal Medicaid, but a proposed ACA replacement plan could also replace the existing Medicaid statutes. While Republicans control the House and Senate, actually gaining approval on both the ACA replacement and complete overhaul of the Medicaid system in the same step could be challenging. Most likely, we will see the repeal-and-replace move first, followed shortly by Medicaid reform in a separate legislative action.
Impact on Seniors Housing & Care
Speculating on the impact of block grants is difficult because the yet-to-be-determined calculation methodology is essential to the reform’s implementation. We could see states embrace the home- and community-based services movement and an expansion of Medicaid waivers. If states no longer need CMS approval for certain waivers, nursing homes could end up with fewer Medicaid residents (who hold the current majority in nursing homes), as those residents could be eligible to use their Medicaid dollars to move into assisted living properties or remain in their private residences with home care.
States could also require copays by Medicaid enrollees for nursing home care, thereby potentially reducing the number of Medicaid nursing home residents if costs are too high. Another option for states is to change the eligibility requirements for Medicaid, raising the minimum income threshold and requiring people to spend down more of their assets before they become eligible for Medicaid coverage. States could also focus on programs for dual-eligible residents—those who qualify for Medicaid and Medicare. Block grants could enable states to privatize Medicaid, so nursing homes would work with private insurance companies rather than the state for reimbursements. In short, as the block grant policy intends, states’ possibilities for administering their Medicaid programs are endless.
For now, we wait. We know support for Medicaid block grants exists in the executive and legislative branches. But we also know the process of carving out the details for this reform will be a massive undertaking. By the time the 2017 NIC Spring Investment Forum starts in March, we should have a better understanding of the direction health care reform, including Medicaid, will take.
In-Depth Skilled Nursing Coverage at the Forum
Interested in learning more about current skilled nursing trends? Curious about emerging opportunities to unlock value through new collaborations? Check out these and other sessions at the 2017 NIC Spring Investment Forum, March 22–24 in San Diego:
- The Medicaid Question: What’s Happening in Leading-Edge States: Learn about Medicaid’s approach to long-term services and supports in California, Texas, and North Carolina, and hear predictions for possible future changes to Medicaid, including the potential transition to block grants, the growing proliferation of home and community-based services, and the impact of the increasing reliance on managed Medicaid organizations. Skilled nursing operators and investors should not miss this session!
- The Future of Senior Care in the New Administration: Hear former Senators Tom Daschle and Bill Frist discuss the political landscape and how a new president and Congress could influence health care policy, the move to value-based care, entitlement reform, and tax policy.
Take a look at the full schedule of sessions for the Forum.[/expand] [cresta-social-share]
Seniors Housing & Care Industry Calendar
January/February 2017:
30-1 AHSA 2017 Annual Meeting, Palm Springs, CA
March 2017:
22-24 2017 NIC Spring Investment Forum, San Diego, CA

Be sure to save the dates for both 2017 NIC conferences!
Also note the change in days for the NIC Fall Conference, which will begin on Tuesday rather than Wednesday, and will end on Thursday.
NIC Partners
We gratefully acknowledge our following partners:
