Culture Counts: A Conversation with Tim Buchanan of Legend Senior Living
 Tim Buchanan was way ahead of the labor challenge when he started Legend Senior Living 21 years ago. That’s because he created a culture that puts others first, including employees. Why hire someone if you’re not going to pay attention to them?
NIC Chief Economist Beth Mace recently talked to Buchanan about why work culture matters so much today. As a veteran industry leader, he also shared his insights on the aftermath of the pandemic and what’s ahead for senior housing.
Here is a recap of their conversation.
Mace: Tim, you founded Legend Senior Living in 2001 and have since served as its CEO. Wichita-based Legend owns and operates 41 communities offering independent living, assisted living, memory care, and nursing care in Kansas, Oklahoma, Colorado, Texas, Pennsylvania, and Florida. Can you tell our readership more about Legend?
Buchanan: Legend grew out of my prior experience in the 1990s when I co-founded Sterling House and served as chairman and CEO. We took the company public in 1995 and merged in 1997 with Alterra Healthcare, operating about 400 properties. I left in 1999 and started Legend in 2001. We are privately held and have two generations of family here now. My son Matthew is executive vice president of the company. We develop, acquire, and operate our properties, and manage properties for other owners. Our senior leadership team is collaborative and transparent. Accountability comes with transparency which helps people leverage to their strengths and leadership capabilities.
Mace: Legend Senior Living is founded on values of “servanthood, caring, and character.” Based on your website, your operating strategies, management methods, values, and principles are guided by ethical standards of integrity and honesty supported by your faith. Can you help us pull that statement apart? Why is each word in that statement important?
Buchanan: The basis for the statement is our Christian faith. Servanthood, putting others first and stewardship are among our core values. My transition from residential builder/developer in my 30s was born out of work in the mission field and the desire to have an impact on the quality of life for a larger number of people. Assisted living was just a localized experiment back then. But it checked all those boxes for me. We have a significant ability to make a direct impact on the quality of life for senior adults and change the way people age in America. We also have a significant impact on the lives of the people who work for us, which puts thousands of people in our sphere of influence and our ability to impact them. There is a direct correlation between the talents and skills God has given us and using those to improve life for other people. We deal honestly with people and create win-win relationships. That is much less work than constantly maneuvering and viewing every relationship as a transaction to seek our own gain.
Mace: Fortune magazine has recognized Legend Senior Living as one of the nation’s 25 best workplaces in the senior living industry, while Legend has been certified as a great place to work three years running by Great Place to Work. What do you attribute that to?
Buchanan: I would have to point to culture. The link between my own heart and that of the several thousand people who work for us is the excellent leadership team who communicates that culture. People appreciate being valued even when things are not perfect, knowing there are people who have your back and know you’re important to them. We demonstrate that as a company through leadership development. We are a learning company. We’ve always focused on leadership education to give people an opportunity to improve. We also offer scholarship opportunities, life event celebrations, and associate relief funds, among other benefits, providing a safety net for employees.
Mace: Was that the case during COVID?
Buchanan: We offered “hero pay” like other providers, wage adjustments, support for those in need, flexibility in scheduling to help employees deal with their own family needs.
Mace: Tim, you had significant experience in senior housing prior to founding Legend. What operational or industry observations or lessons were learned with your prior experience in the sector?
Buchanan: In the early days of the ‘90s, there was a debate whether senior housing was a real estate, hospitality, or healthcare business. The answer is ‘yes,’ it’s all of those. But it is focused more on operating excellence than on the quality or amenities of the real estate. You can put up the most beautiful building, and if the operations are average, you will have average returns. That’s why the most successful projects are those where operators have an aligned interest in the economic benefits of the property along with the investment capital that took the risk and deserves a return. There is a hospitality component in assisted living, but assisted living is focused heavily on the delivery of healthcare. One of my favorite quotes is that assisted living is the single largest private pay healthcare delivery systems ever created in America. We really did change the way people age if you look at the long-term care options of the ‘70s and ‘80s, and the landscape is significantly different today. The foundational tenets of assisted living are choice, dignity, and independence. It’s remarkable how important those principles are today 30 years later.
Mace: How did you fare during the worst of the pandemic? And how is the Omicron variant affecting your residents, staff, and overall census today? What lessons have been learned, and what will you carry forward into future day-to-day operations?
Buchanan: When our residents first got vaccinated the cases went nearly to zero. Omicron resulted in more cases than we had early in the pandemic. Omicron’s impact on health has been less than other variants, but it has contributed to a lot of staff absences. For instance, I am fully vaxxed and boosted, and I still got Omicron. It is very contagious.
Mace: How is your current occupancy? Lead generation? Tours? Closings?
Buchanan: January lead generation was our largest January ever, continuing trends that began in 2021. Trends are looking very favorable.
Mace: Is it pent-up demand or new demand?
Buchanan: There is some pent-up demand, but not a flood of that. Some consumers put their plans on pause. But I think the demand is also related to the fact that COVID put a spotlight on the harmful effects of isolation. One thing in senior living we have been trying to educate the public on is the damage of living alone without socialization or a support network around you. Consumers now more easily recognize this.
Mace: Expenses across many line items are going up—insurance, labor and staffing, material costs, and more. All of these factors are squeezing margins. How are you withstanding these pressures?
Buchanan: We had to implement one of largest rate increases we’ve ever had in my 30 years in business. We’ve also put more focus on efficiency, paying attention to contract negotiations to peel every cent we can from expenses. And we’re measuring consumption to tackle waste.
Mace: Acuity by care setting has generally been increasing across the industry. Are you seeing the same in your portfolio?
Buchanan: That has been happening for 20 years. Acuity took a big bump during the financial crisis and COVID has exacerbated the trend. During COVID, people needed a significant reason to leave home. We couldn’t give tours. People making a lifestyle choice put that decision on hold. That left us filling units with people who needed to move, which drove acuity up as well. I think that will moderate now. Also, there’s more focus today on signing up consumers from the internet who can close quickly. Referral agencies tend to want a quick close, and those typically are the higher acuity consumers, which leads to a shorter length of stay. People who need moderate assistance benefit the most from our product which offers socialization, good nutrition, and medication management, and we as an industry need to market to those consumers more effectively. We need to be more creative reaching more independent people in their homes before they start shopping out of acuity need.
Mace: How do you reach people at home?
Buchanan: Direct mail, newspapers, professional community, and other vehicles that senior adults read and pay attention to. We need to communicate more as an industry to boost the branding and image of the product.
Mace: How are you addressing labor force challenges?
Buchanan: We’ve had internal recruiters for a number of years. This crisis has allowed us to elevate that. We meet as a senior management team every Monday and include our director of recruiting. We look at metrics and pay attention to key performance indicators. We operate in 40 different counties, and our recruitment efforts vary by market.
Mace: Is your culture a differentiator?
Buchanan: We track turnover. There’s no point in hiring people if you don’t pay attention to them. You have to be committed to them. You have to teach them and help them grow as individuals.
Mace: What is your development pipeline today? How do you choose markets? How was development affected by COVID?
Buchanan: We opened two buildings last year, one in Colorado Springs and one in Jacksonville, Florida. We are breaking ground on a project in Harrisburg, Pennsylvania in a few weeks. Our pipeline did slow during COVID, but we are now refocused on new markets as well as markets we already serve.
Mace: How do you choose a location?
Buchanan: We look for places where there is a pocket of availability that could withstand additional units. We use multiple demographic internal filters, as well as external resources like NIC MAP Vision data to find opportunities. For our assisted living product, we also look at the regulatory environment.
Mace: Who are your capital partners? What do you look for in a good capital partner? How have your capital partners responded to your needs as an operator during the pandemic?
Buchanan: Our significant investors include family office investors who have been following us for over 20 years. We’ve also had relationships with institutional investors over the years, including multiple REITs. Different REIT arrangements have included triple-net leases, joint ventures, and development pipelines. Our relationship with Welltower spans decades. We will continue to be a partner with Welltower as well as other institutions and REITs. Also, CS Capital Advisors provide great services to us today, and in fact, they took us public at Sterling House. They are very knowledgeable about the industry.
Mace: Are you looking to address the care and housing needs of what NIC calls the “Forgotten Middle?”
Buchanan: That’s a big topic. When we started Sterling House, we formed partnerships with churches. We had a vision to develop a moderate or low-income product and help churches develop campuses, which proved to be difficult. I have admiration for groups that find ways to do that with grant and tax credit programs. Our industry has gravitated more toward affluent customers. We have created a concierge-type product causing most seniors to think that service level is what they’ll receive no matter what they pay. We have to address this. So many can’t afford the product we’re building today. There is a huge need for what we dreamed of 30 years ago, and that’s a product for everyone. We also need to educate consumers. It’s not unlike hotels. Consumers know that they’re getting a different service package at a lower price level. But regulatory and market barriers make it difficult to unbundle services and provide multiple assisted living models. As Americans, we need to commit to more tax incentives and flexible policy to benefit operators and investors to create a product at a lower price point.
Mace: In wrapping up, what’s next, and how are you positioning yourself for growth in the 2020s?
Buchanan: We must continue to innovate. We’re serving three different generations today. Each one has different tastes. Interestingly, assisted living was created by outsiders, not by the long-term care industry which was apprehensive about the changes assisted living might bring. I want to be a change agent. The senior living industry needs to innovate from within.
Mace: What might that innovation be?
Buchanan: As I mentioned, different service bundles, product types, and new modalities of delivery will be required over time. Also, COVID has made us more conscious about public access and security.
Mace: Lastly, is there anything else you would like our readership to know?
Buchanan: Be supportive of your industry and our trade organizations. Everyone needs to be a member, pay dues, and give some time. I was Board Chair of Argentum during COVID. There would have been no COVID relief money for assisted living if not for Argentum, ASHA, NCAL, and NIC and others. We made it possible for the first time to get federal money to operators without governance from CMS. COVID created that opportunity and taught us how to work with and educate state regulated entities. We all owe it to give back to the industry.

Demand at Your Doorstep: Who is Recovering Faster and Why?
While it’s difficult to predict the course of the pandemic, the same can be said for the senior housing recovery. The Omicron variant seems to be on the downswing. More tools are now available to help fight the virus than at the outset of the pandemic. Senior living residents have high vaccination rates, and new therapeutics have been approved.
A number of other factors will impact the strength and breadth of the recovery. A top concern is the continued staffing challenge. Another issue: can rents keep up with rising expenses? And why are certain segments and properties recovering faster than others?
An expert panel tackled the question of how the recovery is likely to play out at a session during the NIC Fall Conference in Houston. The discussion was led by Justin Hutchens, executive vice president, senior housing, Ventas.

Providing context, NIC Senior Principal Lana Peck detailed three ingredients of occupancy recovery: vacant units (42,000), units in lease-up before the pandemic (31,000), and units coming online (33,000).
About 16,00 units were absorbed in the second and third quarters of 2021, leaving about 90,000 units to be absorbed.
The pace of absorption will determine the time needed for the market to recover, noted Peck. The demographic outlook is strong, and the caregiver ratio is declining. Fewer relatives are available to help elders, signaling a need for more congregate care options in the years ahead.
Absorption hit a record high in the third quarter of 2021. Occupied units increased by 12,300, indicating a surge of pent-up demand. Also, the fewest new units since 2015 came online in the third quarter.
Certain factors could slow absorption. Demand might not continue at the same pace. The course of the virus is uncertain. Inflation is cutting into affordability. Consumer confidence and changing consumer preferences could impact leasing activity.
While NIC doesn’t make projections, Peck computes that the recovery could take anywhere from 1.8 to 7.7 years. “There’s a wide difference in the pace of occupancy recovery,” she said.
Labor Woes
The labor force is a big issue impacting the recovery. Wages are up. Workers are hard to find and retain. Skilled nursing properties have been especially hard hit. New residents can’t move in unless the building is properly staffed. Contract or agency workers are very expensive.
Agency workers also do not provide continuity of care, an important element of consumer satisfaction, noted Hutchens. His advice: Hire your own staff and train them well. “Then you have someone committed to your company and you pay less,” he said.
Operators are using a variety of tactics to recruit and retain workers. Flexible schedules, bonuses, and perks are becoming more widespread. Executive directors and sales teams make a difference.
“Where there are great leaders and department heads, everything falls into place,” said panelist Bre Grubbs, executive vice president, revenue strategies, Leisure Care. She adds that the Leisure Care properties in the Seattle area benefited from the closure of hospitality venues by hiring workers who had been laid off. “We gained a pool of people,” she said.

Panelist Chris Bird agreed that leadership at the property level matters. “If you are in the right market with the right manager, recovery is faster,” said Bird, executive vice present and chief operating officer at Life Care Services
Uneven Recovery
Occupancy gains vary by product type. Independent living and life plan communities are faring well, the panelists said. Home sales and values are up, making it easier for older homeowners to make a move. Assisted living is recovering faster than memory care.
Properties in markets with high barriers to entry are faring better as well. “We like the West Coast and New England,” said panelist Nicole Sermier, executive managing director, and head of residential investments, Sculptor Real Estate. “Those markets are harder to build in.” She added that she’s optimistic about the sector.
The fastest recovering markets are those with less inventory, fewer vacancy problems due to COVID-19, little new construction, and those in secondary locations, according to Peck.
Asked about recovery of net operating income, the panelists agreed that rents need to go up to cover rising expenses, such as higher wages and insurance premiums. LCS’s Bird said rents are being raised at some communities by as much as 9%. “We are open about rate increases,” he said, noting that residents are receiving an increase in their social security payments. Sermier observed that it’s easier to raise rents at Class A communities.” We are more cautious on the middle market,” she said.
Concessions are contributing to the recovery, but at a cost. Concessions aren’t necessary in every market and consumers can be wary of big discounts that signal service may not be adequate, according to Bird. His approach is to stay disciplined and not offer concessions after 90 days.
Hutchens asked the panelists whether they anticipate more growth through acquisitions or new development.

LCS is committed to a blend of both. “The demographics are here,” said Bird. But supply chain problems and construction delays are extending the time it takes for a new development to reach stabilization. Bird figures a 200-unit building could take three years to stabilize. But the fact that construction slowed during the pandemic should help the sector recover, the panelists concluded.
To learn more about the demand recovery paths and potential recovery timelines for senior housing, see the most recent NIC Notes blog on the topic.

Thought Leadership at the 2022 NIC Spring Conference
Senior housing and care leaders are gearing up for the 2022 NIC Spring Conference in Dallas from March 23 to 25. This three-day event will help industry leaders pave the way for success in the year ahead by building relationships, securing new deals, and making connections. In addition to the numerous networking opportunities that the conference facilitates, such as informal networking lounges, receptions, and small group discussions, conversation and connection has been thoughtfully woven into the educational program as well.
The Spring Conference’s educational sessions are expertly curated to provide relevant, timely, and actionable insights. The 2022 NIC Spring Conference will feature eight educational sessions—with innovative formats designed to foster interactive discussions. Sessions are scheduled with time to network in between each session, so you can choose to attend them all. Sessions will occur in three formats:

Main Stage Presentation: Senior housing and care experts will tackle significant challenges facing business leaders today, such as:
- How To Increase NOI Today, Tomorrow, and Into the Future: Industry leaders discuss strategies to help senior housing and skilled nursing operators maximize their net operating income and enhance their business model.
- Macroeconomic & Capital Market Trends: Potential Policy Impacts to Senior Living: Hear expert analysis on economic and policy trends to better align your business strategies to market conditions.
- Leaning In and Leveraging Resources for Successful Partnerships: Discover forward-thinking strategies that innovative operators implemented to create additional revenue streams and improve resident outcomes.
- Debt and Equity Trends in Senior Living: What do equity and debt look like for a cashflow business? What are investors looking for in an effective partnership with an operator? Hear analysis on the most competitive and riskiest markets for financing.
Presentation and Discussion: Three sessions will offer attendees a keynote-style or panel presentation, immediately followed by an opportunity to engage in smaller group discussions for a more intimate, in-depth, and dynamic experience. Topics include:
- A Roadmap for Building Back Occupancy: Experts share ideas about positioning, key performance indicators, and customer needs in response to continued shifts in market demand, move-ins, and consumer trends moving to a needs-based model. This session with feature NIC MAP Vision data.
- The ‘Forgotten Middle’ Market: Vision to Execution: Millions of Americans who are unable to afford current private-pay senior living options, yet don’t qualify for Medicaid, will be left without options unless a new innovative model arises. Learn what strides have been made and ways to incorporate new solutions into your business model.
- Fostering Meaningful Engagement: Industry Staffing and Labor Needs: Industry experts share alternative solutions to meet the growing industry needs while facing labor and staffing challenges for both front line and executive positions.
Peer-to-Peer: One standalone session will be entirely devoted to collaborative discussions. Attendees are encouraged to share their own insights and questions in a format moderated by subject matter experts but driven by participants.
- The Time is Now: Developing the Active Adult Playbook: A hot investment is active adult—providing a wide range of opportunities for older adults with lower acuity needs. What are its prospects? Who are the investors? And how are their investment strategies different?
Don’t miss this spring season’s most important event with operators, investors, and healthcare provider decision-makers.

Thoughts from NIC’s Chief Economist—I’ve Got Inflation on My Mind; How About You?
 Inflation, inflation, inflation. It’s the topic on everyone’s minds, be it the shopper at the grocery store, the driver filling his or her car at the pump, the analyst on Wall Street, and the bond traders and Fed watchers within banks and financial institutions. With a gain of 7.5% in January on a year-over-year basis, the spike was the strongest jump in the CPI since early 1982. That’s 40 years. Moody’s Analytics estimates that an inflation rate of 7.0% on a year-ago basis, compared with the 2.1% average growth in 2018 and 2019, is costing the average household over $250 per month.
Inflation on My Mind
The cause of the surge can be traced to or blamed on several culprits, ranging from too accommodative monetary policy (think surge in Federal Reserve’s balance sheet and growth in money supply–too much money chasing too few goods), consumers on a spending splurge like no other (think three stimulus checks totaling $3,200 provided by the federal government during the pandemic to many individuals), supply chain bottlenecks (think global plant closures, shipping backlogs, and worker absenteeism) and increasingly workers anticipating and demanding faster wage growth as the value of their paychecks erodes and their spending power shrinks (think wage-price spirals that you studied in your macro-economic classes). Inflation becomes an intractable problem when consumers believe that inflation will remain high, and workers demand bigger and bigger wage increases to offset rising prices. Businesses then pass on their higher labor costs in even higher prices. In such a way, a much-feared wage-price spiral takes hold, which can potentially take years to reverse (think 1970s wage-price inflation spiral with an eventual solution of significant interest rate hikes shepherded by then-Fed Chairman Paul Volcker which ultimately led to the harsh 1981-1982 recession, at least according to many economic history buffs).
The solution to inflation is not simple, and the fix is complex. It relates to monetary policy, consumer psychology, and business acumen. And unfortunately, the price surge is increasingly looking less transitory, as was first posited by the Federal Reserve, and increasingly more permanent, and potentially entrenched. Remarks by officials at the Fed indicate that a change in policy is at hand with its bond buying program soon to come to a halt and a gradual increase in interest rates likely to begin as soon as March 15th to 16th at its next FOMC meeting.
The general expectation is that the Fed will raise interest rates in 25 basis-point increments through 2022 and into 2023 to end that year with a fed funds rate of 2% to 2.5%, up from virtually 0% today. That said, many bond market analysts believe the interest rate increases will be in larger increments and implemented sooner. The theory is that higher interest rates will slow the pace of demand and reduce upward pressure on prices. The risk is that the execution and timing of this finely choreographed process is not entirely predictable and often results in a significantly larger slowdown in economic growth than is desired, and the economy slips into a recession (think 1980-1982 recession).
For those in the senior housing business, the present macroeconomic environment is like no other time. While some operators have been in business for more than 40 years, the industry as it is today largely did not exist in 1982. Rapidly rising food and energy prices (up 7.0% and 27.0%, respectively in the January CPI from year-earlier levels, and yes, that is not a typo), as well as rising wage rates (where average hourly earnings for workers in assisted living were up by a whopping 8.7% in November from year-earlier levels) are squeezing margins at a time when occupancy rates are historically low, albeit improving. And with rising interest rates, the cost of debt for development as well as operations will add further pressure on NOI growth.
In this environment, it is a tough time for senior housing and nursing care businesses in general, especially on the heels of the pandemic and its continued impact on operations. While the surge in the Omicron variant seems to be behind us, the effects and ongoing risks of the COVID-19 pandemic are certainly not entirely gone.
Improving Senior Housing Market
One possible relief for operators may be improving revenue streams associated with improving move-in rates and rising asking rates. Indeed, asking rate growth reached the highest recorded to date (since 2015) for majority assisted living in December 2021 at 7.4% on a year-over-year basis, according to the most recent data from the Fourth Quarter NIC MAP® Actual Rates Report. October and November were also very strong, both at 7.1%. Year-over-year asking rate growth was also strong for majority independent living, reaching 4.6% in December 2021, the highest year-over-year growth for asking rates since February 2019 when it was also 4.6%. October and November 2021 were also strong for majority IL at 4.4% and 3.7% respectively. The 5.9% rise in social security payments to older adults that went into effect in January 2022 may help support these rate increases.
The Actual Rates Report also showed that, for the third quarter in a row, move-ins continued to outpace move-outs for both majority assisted living and majority independent living properties through the fourth quarter of 2021. This marked ten consecutive months of improvement (move-ins outpacing move-outs) from March 2021 through December 2021.
Separately, recently released data on senior housing market fundamentals continued to show improvement. Senior housing occupancy edged up 0.2 percentage points to 81.2% in the January 2022 reporting period on a three-month rolling basis despite the surge in the Omicron variant, according to the Intra-quarterly NIC MAP® data, released by NIC MAP Vision. In the first months of the pandemic (March 2020-June 2021), senior housing occupancy fell by 8.7 percentage points to 78.7% for the NIC MAP Primary Markets. Since June 2021, occupancy increased by 2.5 percentage points but remains 6.2 percentage points below the pre-pandemic March 2020 level of 87.4%.
All of this portends well for future market fundamentals. Further support from pent-up demand and a near-term pause in inventory growth associated with the slowdown in starts experienced during the pandemic provide further tailwinds. That said, the broader macroeconomic environment may unfortunately provide offsetting headwinds.
In wrapping up and as always, I appreciate and welcome your comments, thoughts, and feedback.


The NIC Lending Trends Report Delivers Greater Transparency on Capital Market Trends
by Anne Standish, Research Statistician, NIC, and Beth Burnham Mace, Chief Economist and Director of Outreach, NIC
Our mission. As a 501(c)3 organization, everything NIC delivers is in pursuance of our mission as a non-profit organization. NIC’s mission is to enable access and choice by providing data, analytics, and connections that bring together investors and providers. Our goal is to improve the transparency and understanding of the sector in order to ease the flow of capital within the sector and lower its costs to ultimately generate quality housing options and outcomes for seniors. NIC Analytics helps to deliver on that mission by interpreting, analyzing, and contextualizing data within the greater senior housing and care space. While NIC MAP® and VisionLTC data, powered by NIC MAP Vision, are the industry’s gold standards for senior housing and care occupancy, inventory, and rate data, NIC continues to collect and publish other data sets that serve additional data needs of our constituents.
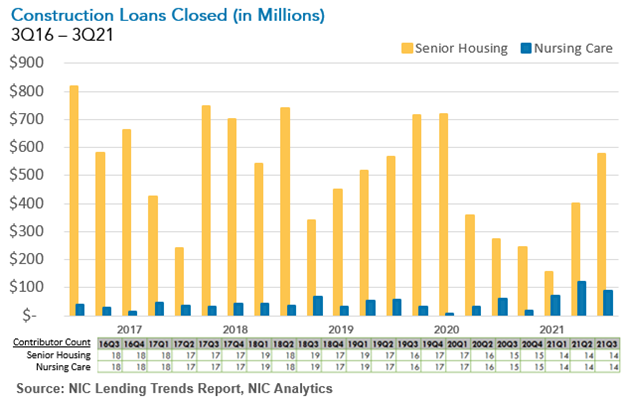
One such report by NIC Analytics is the NIC Lending Trends Report. After identifying the need for data on different types of lending activity specifically for senior housing and care properties, NIC began collecting this data in a quarterly survey in 2016. After several years of data collection, quality assurance practices, and report development, NIC released the new report in 2021. The report tracks several different types of loans including permanent loans, mini-perm/bridge loans, and construction loans. The report has over five years of time series data and includes same-store growth metrics to show quarter-over-quarter changes. The data included in this report are not meant to be representative of a census of the entire universe of lending for senior housing and care in the United States but are useful for understanding trends over time.
Understanding trends in construction lending volumes is important for understanding development and where we are in the construction cycle. Lending data are also helpful for understanding what types of loans are becoming more popular. Overall volumes can help to understand perception of the sector as well and can provide a “temperature check” about how lenders are feeling about the sector. When the pandemic began it was clear that the sector needed data to illuminate what was happening with lending during the crisis. In the early quarters of the pandemic, we saw declines in the volume of new construction loans closed, for example.
Takeaways from the third quarter 2021 report. Data from the recently released third quarter 2021 report show that confidence in construction seems to have returned. The volume of construction loans closed increased for senior housing in the third quarter of 2021, showing that interest in construction projects is returning following a pause seen earlier in the pandemic. On a same-store quarter-over-quarter basis, the increase was 45.0% for senior housing. Construction loans closed for nursing care were also elevated in third quarter 2021, though new nursing care construction loans closed were 25.1% lower on a same-store basis from second quarter 2021. It’s noteworthy, however, that construction lending for nursing care is limited due to certificate-of-need (CON) restrictions, and, as a result, it was roughly 15% of the level seen for senior housing.
Delinquent loans continue to decline from pandemic-related highs. The NIC Lending Trends Report also tracks delinquent loans. Delinquent loans continued to decline for both senior housing and nursing care in the third quarter of 2021 from the pandemic-related high point reached in the third quarter of 2020. Delinquent loans, which include loans in forbearance for some lenders, were 1.0% of total loans in in the third quarter of 2021 for senior housing, the lowest share since first quarter 2020 when it was at 0.3%. Nursing care delinquent loans were 1.2% of total loans in third quarter 2021, down from 1.6% in second quarter 2021. These declines are encouraging signs of continued recovery.

Mini-permanent/bridge loans increased for nursing care properties in third quarter 2021. Mini-permanent/bridge loans have amortization periods that are generally between three and five years and tend to function as an intermediary loan following a construction loan and prior to finding a longer-term mortgage loan. Nursing care properties had strong new mini-perm/bridge loans issued in the third quarter, increasing by 27.2% on a same-store quarter-over-quarter basis from second quarter 2021 and moving back toward its peak of nearly $644 million in the fourth quarter of 2020. Conversely, the issuance of mini-perm/bridge loans for senior housing continued to edge lower from the recent peak in in the fourth quarter of 2019.
Total loans declined for senior housing. Total loan balances declined by 1.4% for senior housing on a same-store basis in third quarter 2021. The senior housing decline reflects loans coming off the books for some lenders. This was the first quarter total loans declined on a same-store basis for senior housing since first quarter 2020. Total loans for nursing care increased by 0.8% on a same-store quarter-over-quarter basis. As of third quarter 2021 the NIC Lending Trends Report tracked $86.8 billion in total senior housing and care loans from the sample of lenders currently providing data to the report.
NIC Analytics wants your data. We are actively looking to grow our sample for this report and would love to talk with you about data contribution if you are a lender. Data collection occurs quarterly and involves filling out one Excel sheet and occasionally answering specific questions. In appreciation for contributing data, data contributors receive the report in advance of publication. The information provided as part of the survey will be kept strictly confidential. Individual answers will be combined with the answers of all other respondents. Data acquired from this survey will only be reported in the aggregate, and therefore, the resulting aggregated data will not be attributed to you or your company upon distribution.
If you would like to participate in our quarterly survey, please email us at analytics@nic.org. We very much appreciate our data contributors. This report would not be possible without them.
While this article focuses on some of the key takeaways from the third quarter 2021 report and the reasoning behind collecting and reporting these data, more key takeaways and trends are available in the full report (which is available to download free of charge.) Keep an eye out for the fourth quarter 2021 NIC Lending Trends Report that is scheduled to be released in mid-May 2022.

CCRC Care Segment Performance 4Q 2021
by Lana Peck, Senior Principal, NIC
The following analysis examines current conditions and year-over-year changes in inventory, occupancy, and same-store asking rent growth—by care segments within entrance fee CCRCs compared to rental CCRCs—to focus a lens on the relative performance of care segments within CCRCs during the fourth quarter of 2021. Overall CCRC occupancy by profit status and CCRC versus non-CCRC occupancy differences by care segment will also be addressed.
NIC MAP®, powered by NIC MAP Vision, collects primary data on occupancy, asking rents, demand, inventory, and construction for more than 15,000 independent living, assisted living, memory care, skilled nursing, and continuing care retirement communities (CCRCs—also referred to as life plan communities) across 140 U.S. metropolitan markets. The dataset analyzed here includes 1,104 not-for-profit and for-profit entrance fee and rental CCRCs in the 99 combined Primary and Secondary Markets.
4Q 2021 CCRC Market Fundamentals
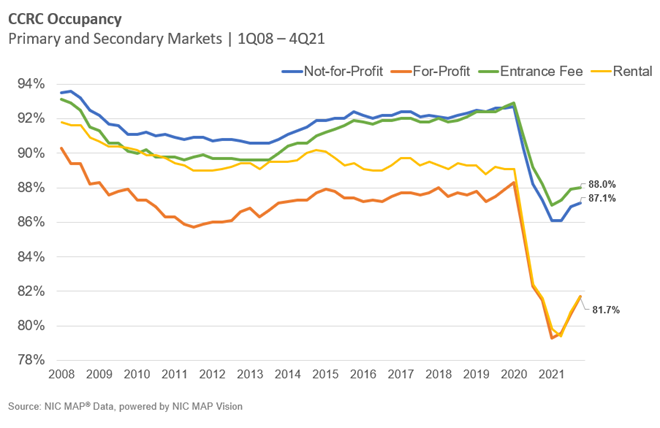
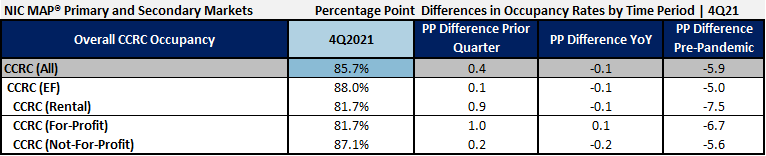
Continuing care retirement community (CCRC), occupancy within the combined 99 Primary and Secondary Markets reached 85.7% in the fourth quarter of 2021, 1.4 percentage points above its pandemic low in the first two quarters of 2021 and 5.8 percentage points below its pre-pandemic occupancy rate in the first quarter of 2020. Currently, CCRC occupancy is equal to the level reached one year ago in the fourth quarter of 2020.
In the fourth quarter of 2021, entrance fee CCRC occupancy (88.0%) was 6.3 percentage points higher than rental CCRCs (81.7%), and not-for-profit CCRC occupancy (87.1%) was 5.4 percentage points higher than for-profit CCRCs (81.7%). Rental CCRCs are currently 7.4 percentage points below their pre-pandemic occupancy levels, while entrance fee CCRCs are 4.9 percentage points lower.
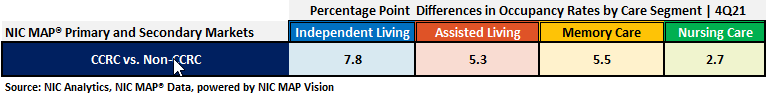
CCRCs vs. Non-CCRCs: Care Segment Occupancy Difference
The table below compares occupancy in CCRCs with that in non-CCRCs for each care segment in the collective Primary and Secondary Markets tracked by NIC MAP Vision. CCRCs outperformed non-CCRCs in each care segment. The difference in overall occupancy rates was highest for independent living units (7.8 percentage points) and lowest for nursing care units (2.7 percentage points) in 4Q 2021.
Entrance Fee CCRCs vs. Rental CCRCs by Care Segment
Among the 1,104 CCRCs spread across the 99 Primary and Secondary Markets tracked by NIC MAP Vision, approximately 51% are operated as entrance fee CCRCs, and 49% are operated on a rental basis. Referenced in the NIC Investment Guide, Sixth Edition, most CCRC residents initially live in an independent living apartment. CCRCs serve a predominately single-female population; however, entrance fee CCRCs have a higher percentage of married couples (42%) than rental CCRCs (29%).
The table below illustrates the relative market performance of entrance fee CCRCs compared to rental CCRCs by care segment in the fourth quarter of 2021 and includes year-over-year changes in occupancy, inventory, and asking rent growth. Note that CCRCs often offer both entrance fee and rental contracts to give residents financial choice and flexibility. NIC categorizes CCRC communities by the contract type that the majority of residents have.

Entrance Fee CCRCs Have Higher Occupancy Rates and Stronger Rent Growth as well as Inventory Growth. By payment type, entrance fee CCRCs have higher fourth quarter 2021 occupancy rates than rental CCRCs for each care segment. The entrance fee CCRC independent living care segment had the highest fourth quarter 2021 occupancy (90.5%), followed by entrance fee CCRC assisted living and memory care (86.7% and 86.8%, respectively). The difference in fourth quarter 2021 occupancy between entrance fee CCRCs and rental CCRCs was the highest for the memory care segment (7.5 percentage points), followed by assisted living (6.0 percentage points), independent living (5.4 percentage points), and nursing care (1.6 percentage points). On a year-over-year basis, the nursing care segment had the most substantial change in occupancy (up 1.5 and 1.2 percentage points, respectively).
As shown in the table below, entrance fee CCRCs comprise a significantly greater proportion of the independent living units. Independent living occupancy is higher than in the other care segments, explaining the more robust overall occupancy performance of entrance fee CCRCs.

CCRCs attract residents who are planners drawn to the continuum of care. However, entrance fee contract residents generally differ from rental contract residents in terms of higher net worth, lower age of entry, and longer tenure in the community. CCRC entrance fees (often similar to resident home sales values) typically subsidize a community’s monthly fees to some extent. Conventional wisdom would suggest that average rental CCRC monthly fee levels would therefore be higher. However, as shown in the table, in addition to higher occupancy rates—which tend to translate into community pricing power—any or all of these factors may help to explain the reasons why average entrance fee CCRC monthly fee levels are higher than rental CCRC monthly fees for each care segment.
The highest year-over-year asking rent growth was in the entrance fee CCRC assisted living segment (4.4%), followed by nursing care (3.4%), and memory care (2.5%). Entrance fee and rental CCRC asking rent growth were similar in the independent living segment. Note these figures are for asking rates and do not consider any discounting that may be occurring.
The number of units in a community differs significantly by payment model. Referenced in the NIC Investment Guide, Sixth Edition, the median size of entrance fee CCRCs is approximately 345 units, compared to 230 units for rental CCRCs. According to the NIC MAP Vision data, both entrance fee and rental CCRCs experienced negative year-over-year inventory growth in one or more care segments. Negative inventory growth can occur when units/beds that are temporarily or permanently taken offline or converted to another care segment outweigh added inventory.
During the past four quarters, rental CCRCs reduced (or shifted) their inventory in each care segment except memory care. Entrance fee CCRCs increased their inventory in all but nursing care. Both entrance fee and rental CCRCs reduced nursing care inventory by -2.1% and -2.4%, year-over-year. Rental CCRCs had the highest reduction in their inventory for the assisted living care segment (-3.1%), while entrance fee CCRCs added 1.2% to their assisted living inventory. Entrance fee CCRCs added more memory care than rental CCRCs (2.4% versus 1.1%). Rental CCRCs reduced (or shifted) more independent living than entrance fee CCRCs (-2.9% versus 0.3%).
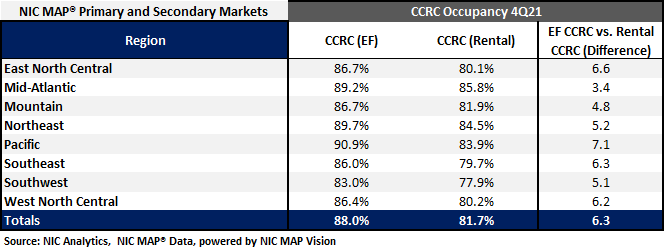
Entrance Fee CCRC Occupancy is Highest in the Pacific Region. In fourth quarter 2021, the Pacific, Mid-Atlantic, and Northeast regions had the strongest CCRC occupancy rates ranging from 88.5% to 88.2%. The weakest CCRC occupancy was in the Southwest region at 80.8%. Considering payment type, as shown in the table below, entrance fee occupancy was highest in the Pacific region (90.9%), whereas rental occupancy was the highest in the Mid-Atlantic region (85.8%). The most significant difference between entrance fee and rental occupancy was reported for the Pacific region, where entrance fee CCRC occupancy was 7.1 percentage points higher than rental.
Look for future blog posts from NIC to delve deep into the performance of CCRCs.
Are you interested in learning more?
To learn more about NIC MAP data, powered by NIC MAP Vision, and about accessing the data featured in this article, schedule a meeting with a product expert today.
Note: this analysis was originally published by Ziegler Investment Banking, Senior Living Finance Z-News for the week of January 31, 2022.
