NIC Insider: The most trusted and objective insights, exclusive data, and key industry access—delivered straight to your inbox monthly.
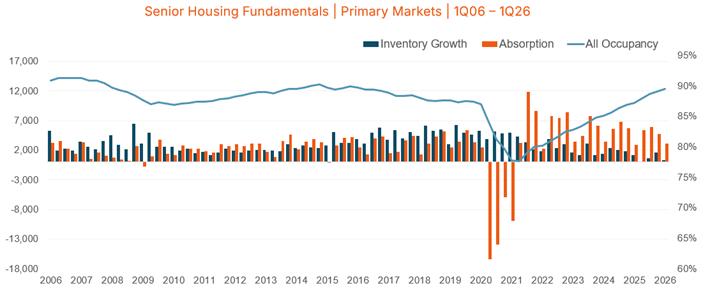
In this edition of the NIC Insider: Strongest Investment Performance in Nearly a Decade, Occupancy Nears 90% for Senior Housing While Active Adult Softens, and More
Subscribe to the NIC Insider ▶