Conversations and Connections at the 2016 NIC Fall Conference
A record number of industry leaders attended the 2016 NIC Fall Conference, which was held September 14–16 at the Marriott Marquis in Washington, DC. Four networking spaces, three NIC-hosted receptions, and over a dozen education sessions encouraged attendees to make connections and begin conversations on the current trends affecting the industry and the new influencers that will shape how providers of care and capital operate in the future.
Highlights of the conference programming are below. For full coverage, check out NIC’s website.
[expand title=”Read More” trigpos=”below” tag=”div” trigclass=”nic-read-more”]

Day 1
Newcomers to seniors housing and care capital took center stage as the 2016 NIC Fall Conference kicked off on Day 1.
The property investment decision process was deconstructed and analyzed at the Pre-Conference Seniors Housing Boot Camp for capital providers and developers new to the industry. The session was led by members of NIC’s Future Leaders Council. Situated at tables of 10, attendees were able to “vote” via their smart phones on a case-study property, weighing in on details such as demographics, occupancy, and the condition of the plant. After a discussion, each table submitted a bid, ranging from $25 million to $35 million. “Valuations can differ depending on who is at the table—developers, operators, or investors,” said session leader Bre Grubbs, vice president of Leisure Care, Seattle.
Day 2
Areas of focus took shape in Day 2’s sessions with discussions centered on the changing capital markets, politics and policy, and predictions for a future with new competition and a more demanding customer. Some highlights are below:
- The Opening General Session keynote speaker, former HHS Secretary and Utah Governor Mike Leavitt, shared his perspective on the shift to value-based health care payments and how industry providers can profit by becoming part of the risk equation.
- Analyzing the upcoming election, pundits David Brooks and J. Dionne pondered our age of polarization. Alternately worried about government dysfunction and yet still optimistic about the American people, they think Hillary Clinton will win. But, they admitted, their predictions have been mostly wrong so far in this puzzling political year.
- Kelly Cook Andress of Sage Senior Living and NIC’s chief economist Beth Mace discussed the changing senior demographic and how there will be fewer caregivers to care for a massive generation that has saved less but is expected to demand more.
- Operator CEOs from Belmont Village Senior Living, One Eighty/Leisure Care, and Silverado talked about their companies’ strategies for competitive positioning, labor, and demand. They said they’re maintaining a proactive, highly visible presence in markets where they have communities, using in-house recruiters, and attracting Millennials to work in the industry by appealing to their sense of purpose more than showing compelling demographics.
Day 3
Discussions centered on the capital markets and future of aging on the final day of the conference. Key takeaways included:
- Property valuations are being driven by the higher cost of capital, which has led to a decrease in transaction volume. “Be patient, be disciplined,” advised panelist David Boitano of Ventas, Inc.
- Tim Fox of Senior Resource Group moderated a session on current markets that focused on NIC data and research on seniors housing and care trends. The data establishes a baseline of information, he said, that helps the industry improve. As the conversation moved to recent NIC initiatives, Ray Thivierge of Genesis HealthCare, Inc., said that data helps them compare themselves to what’s happening in the markets.
NIC Talks
 The popular series of 12-minute talks returned for a second year to the 2016 NIC Fall Conference. Six industry leaders and outside experts and disruptors shared their visions for the future of aging and how the Baby Boomers, who will start turning age 80 in 2026, will transform seniors housing and care.
- The “longevity bonus” will bring an end to the traditional progression of education, work and family, and retirement, explained Ken Dychtwald of Age Wave. “People will have new dreams at 60, at 80, and at 100.”
- Billie Jean King shared her experience of living with her partner at Atria Senior Living while also serving as Atria’s “Well-Being Coach.” “In some ways I feel more vibrant because of my life experience than when I was younger.”
- A growing camp of researchers say we may be able to actually reverse the aging process. How will that impact society if we live 200 or even 1,000 years, asked NIC Talks speaker Tom X. Lee, CEO and founder, One Medical Group.
- People who age well have deep community connections, explained John Cochrane of Cornerstone Affiliates. Fostering that deep connection is a driving force for the community of the future, and communities need to be radically different than they are today.
- The bucket list is a flawed concept, said Timothy Smick of Harbor Retirement Associates, LLC, because most everyone’s bucket runs dry. Boomers will be looking to redefine themselves and live meaningful, purposeful lives.
- According to Joseph F. Coughlin of the MIT AgeLab, technology will be the conduit to developing relationships with consumers before they need seniors housing. He said Boomers are “Generation Expectation”; the new generation gap is not their numbers or money, but their expectations.
Additional coverage of NIC Talks is available on NIC’s website. Full videos are available online.
[/expand] [cresta-social-share]
Thoughts from NIC’s Chief Economist
The Labor Market: Boom or Gloom?
 Today’s U.S. employment market can be described as a tale of two labor markets depending on which statistic or survey result grabs your attention. On the one hand, and as evidenced by the large group of disenfranchised anti-establishment voters during both the Republican and Democratic presidential primaries, a large swatch of Americans feels that the economic expansion, which is entering its seventh year, has left them behind. They look at wage advancements, the jobless rate, the types of jobs being created and other indicators and are dissatisfied.
[expand title=”Read More” trigpos=”below” tag=”div” trigclass=”nic-read-more”]
With two million people unemployed for more than six months and the U-6 unemployment rate at 9.7% in August, significant numbers of Americans are underemployed or discouraged. Many believe it is harder to get ahead today than it was for previous generations. Indeed, productivity measures have been abysmal recently, and without productivity advances or the ability of each hour of labor to produce more in goods and services, our grandchildren will not feel better off than their parents today. It is the antithesis of the American dream. In the second quarter, the government’s official measure of output per worker grew only 0.6% over the 2012–2016 period, the lowest five-year growth span since 1987–1992. And finally, at 62.8% in August, the labor force participation rate is near a 40-year low.
On the other hand—as an economist, I always have two hands—there is a bevy of statistics that showcase significant progress in the U.S. labor market. The official U-3 unemployment rate was 4.9% in August, a level considered by some to be “full employment” and which was down from 10% at its worse during the recession. Job gains have averaged 182,000 per month for the first eight months of the year. And salaries grew 3.1% in 2015 after factoring into account demographic trends that lower-paid, younger workers are replacing higher-paid, older workers, according to a study by the Federal Reserve Bank of San Francisco.
These indicators and others have provided evidence for both the doves and the hawks within the Federal Reserve on when and how much to adjust interest rates in the aftermath of the 25-basis-point hike of the federal funds rate that occurred last December. At its most recent Federal Open Market Committee (FOMC) meeting in September, the Fed again postponed a rate hike, saying, “The Committee judges that the case for an increase in the federal funds rate has strengthened but decided, for the time being, to wait for further evidence of continued progress toward its objectives.” While no increase occurred in September, the way has been paved for a rate hike at the December 13–14 FOMC meeting. (It is extremely unlikely that the Fed would adjust rates at its next meeting, which takes place November 1–2, in light of the presidential election). Looking further ahead, the median estimate by the 17 officials of the FOMC of the fed funds rate shows two rate hikes in 2017, bringing the fed funds rate to between 1.00% and 1.25% by year-end 2017.
Where Are the Seniors and How Many of Them Are There?

The previous chart shows estimates by the U.S. Census Bureau of the number of persons alive by birth year according to the cohort in which they are classified. Those born in 1917 will be 100 in 2017, while those born in 1937 will be 80 and those born in 1952 will be 65. The Greatest Generation, or those born prior to 1927, are now aged 89 and older and total three million. The Silent Generation, born between 1928 and 1945, total 27 million, and the Baby Boomer Generation, born between 1946 and 1964, total 74 million.
Today’s typical seniors housing residents are from either the Greatest Generation or the Silent Generation, are aged 80 or greater, and were born prior to 1936. If we assume that residents in seniors housing are 80 years or older, there are currently 12.3 million existing or potential residents for seniors housing. The first Baby Boomer will not turn 80 until 2026. When that occurs, this massive wave of individuals will become potential residents. Until that time, however, those potential residents are the children of today’s residents and influence the living decisions and choices of their aging parents.
Within the United States, the largest numbers of people age 85+ live in California, Florida, New York, Texas, and Pennsylvania. Considering these also are the most populous states, it’s not too surprising that they host the largest number of older people. Looking at the growth of the age 85+ cohort from 2015 to 2020, California, Florida, Texas, New York, and Arizona are expected to have the most absolute gains. In terms of the concentration within states, the share of the population over age 85 is highest in North Dakota, Iowa, South Dakota, Connecticut, and Florida.
NIC’s New Data Initiative Launched: Actual Rates Report and Takeaways
For the past 18 months, NIC has been engaged in expanding the seniors housing data we collect and report to be inclusive of actual rates and leasing activity. Effective September 7, 2016, we released the inaugural Seniors Housing Actual Rates Report. This new report, which is available for all NIC MAP® clients, provides insight into actual rates and leasing velocities— metrics that are important for benchmarking and strategic planning.
This data is sourced differently than our traditional quarterly releases of NIC MAP data and is made up of a national sample of operators who provide corporate data feeds of rent roll metrics directly to NIC on a monthly basis. At this point, this nationwide database represents over 250,000 independent living and assisted living (inclusive of memory care) units from more than 2,500 properties. In contrast, the traditional NIC MAP data is a quarterly time series that goes back 8 to 10 years in time for most markets (the exception being the recently launched “Additional Markets”—markets 100 to 140—which have only five quarters of history) and includes all operators who have more than 25 institutional-quality units located in those 140 metropolitan area markets. The new time series dataset currently includes 15 months of data from April 2015 to June 2016.
Specifically, the new data concepts include:
- Actual Rates – In-Place Rates and Initial Rates
- Asking Rates
- Leasing Activity – Move-Ins and Move-Outs
- Occupancy
- Rates Quartile Distributions
Based on data since April 2015, key takeaways from the new data include:
- Turnover is significantly greater for assisted living than for independent living and may reflect the generally higher acuity levels of assisted living residents. This has contributed to a more volatile occupancy pattern for assisted living than independent living.
- In the past 12 months, move-outs exceeded move-ins during the winter months of December, January and February for assisted living.
- Both the average in-place rates and average initial rates were below the average asking rates for both independent living and assisted living properties throughout the reported period, with the monthly differences greater for assisted living properties than independent living properties.
- As of June 2016, the assisted living initial rates averaged 7.8% below their average asking rate, which equates on an annualized basis to an average initial rate discount equivalent to just under one month.
- The rolling three-month average asking and initial rates for both independent living and assisted living properties increased from June 2015 to June 2016, with the initial rates’ increases slightly outpacing the increases in asking rates for both property types.
For those companies that are currently providing data, we sincerely thank you for helping us advance further transparency in the industry.
As always, I welcome your feedback, thoughts, and comments.
Beth
[/expand] [cresta-social-share]
A Deep Dive into the 2Q2016 NIC Skilled Nursing Data Report
 The focus on timely, relevant data is a relatively recent trend within the skilled nursing industry but is quickly becoming the new normal. Not only is collecting and storing additional data points a higher priority than in the past, but being able to research, analyze, and understand the data at an ever-increasing speed will be essential for identifying patterns and trends that will aid future success.
[expand title=”Read More” trigpos=”below” tag=”div” trigclass=”nic-read-more”]
One of the ways NIC has increased the speed of data delivery to the skilled nursing industry is by providing our quarterly NIC Skilled Nursing Data Report. This report includes key revenue and occupancy metrics that are important for operators and investors to understand on a timely basis, especially in today’s rapidly changing environment. Before NIC started releasing the report earlier this year, with data that is seventy-five days old, the industry relied on CMS, whose data is typically 12 to 18 months old. The NIC Skilled Nursing Data Report also includes data on managed Medicare, which is not found from any other data source on such a timely basis.
Currently, we collect data from approximately 20 operators and 1,500 properties on a monthly basis and report it quarterly on a national aggregate level. However, the plan is to grow the data set and add more operators and properties, which will allow NIC to report at the state level. Operators around the country are welcome to participate and will receive a free benchmark report every month for their participation.
The Latest Report
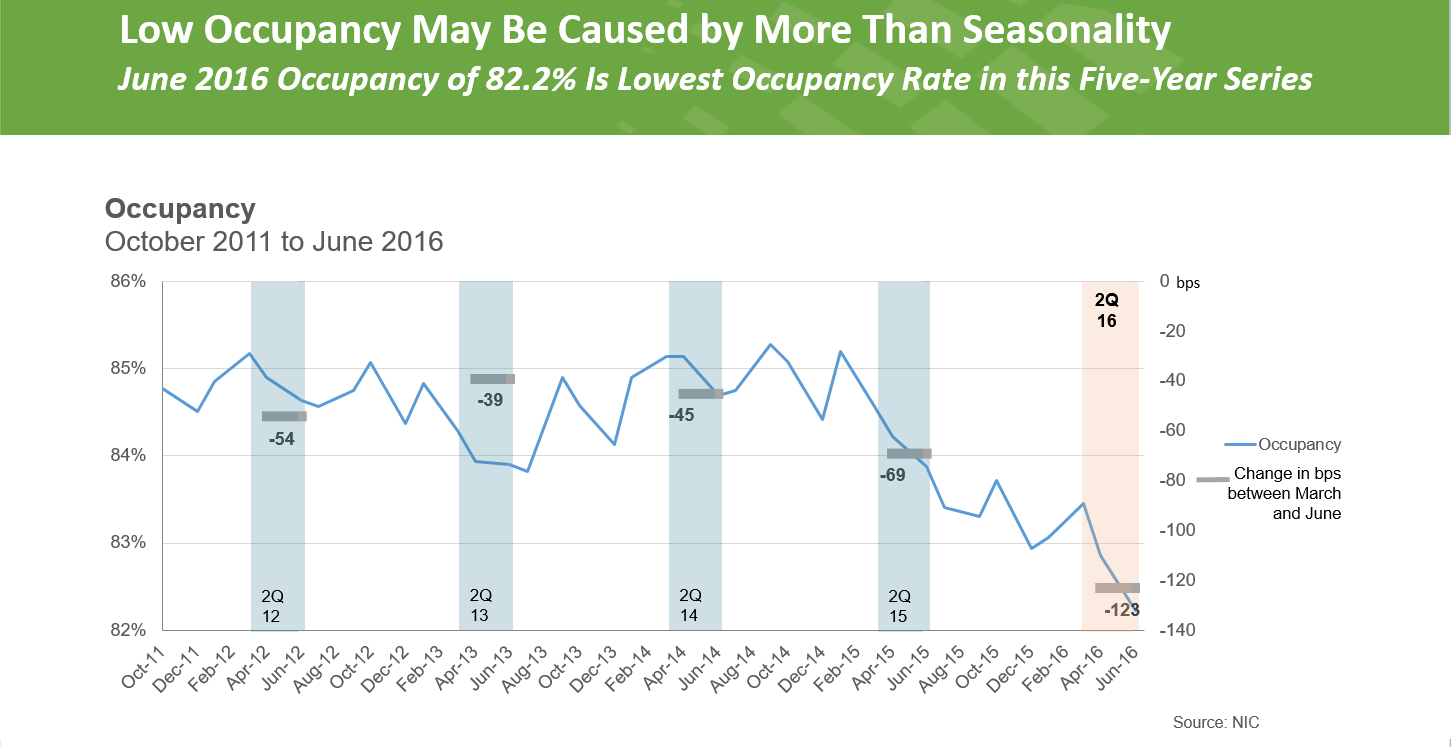
On September 15, at the 2016 NIC Fall Conference, NIC released its 2Q2016 Skilled Nursing Data Report, with data from October 2011 through June 2016. The complimentary report is available for download at http://info.nic.org/skilled_data_report_pr.
After bouncing back in the first quarter of 2016, occupancy declined 123 basis points quarter-over-quarter to 82.2% as of June 2016, which is the lowest occupancy recorded in the data series. While occupancy usually softens in the second quarter, this year the second-quarter decline was more significant than in previous years, suggesting that lower occupancy is being driven by factors beyond seasonality.
There are a number of care delivery and reimbursement initiatives that could be playing a role in the decline. For example, acute care providers, managed care payers, and conveners have initiatives in place to divert skilled nursing referrals to home health and other community-based care settings. In addition, some patients referred to skilled nursing for post-acute care are managed by payers aiming to reduce length of stay, which creates a reduction in Medicare and managed care days.
Occupancy not only decreased quarter-over-quarter; it also decreased year-over-year, falling 170 basis points from 83.9% in June 2015 to the 82.2% in June 2016.
Occupancy historically has been an important metric to follow, and still is, but it is just as important to understand the relationship between occupancy and the true economics of the operating business. As some operators are transitioning into higher acuity patient care, it’s possible that an operating business captures fewer patient days because of the lower length of stay for, as an example, more Medicare rehab patients. This will cause occupancy to decline. However, it’s also possible that, all else being equal, the higher reimbursement rates for higher acuity patients will mitigate some of the pressure on cash flow from lower occupancy, as long as the volume of patient admissions is strong and expenses (for example, labor expenses) do not increase more than the incremental revenue. In stating that, the large drop in occupancy in the second quarter does seem significant for the operating businesses, especially as skilled mix has decreased.
Skilled Mix Declined Due Especially to Medicare
The main driver of lower occupancy was skilled mix, or the share of patient days paid for by Medicare and managed Medicare. It decreased 140 basis points from 25.9% in March 2016 to 24.5% in June 2016. Year-over-year skilled mix declined 130 basis points from 25.8% in June 2015. Medicare patient day mix drove the decline within skilled mix as it declined 107 basis points from the prior quarter to 13.5%. Year-over-year—which can possibly be more telling of the trend—Medicare patient day mix declined 140 basis points from 14.9% in June of 2015. Managed care (managed Medicare) patient day mix also declined from the prior quarter, albeit slightly, to 5.8% of patient days. Year-over-year managed care patient day mix decreased 40 basis points from 6.2% in June 2015.
Decline of Managed Care (Managed Medicare) Revenue per Patient Day May Be Abating
One of the main reasons timely data is so important is for identifying trends as they happen, and this recent data release showed that the decline in managed care revenue per patient day (RPPD) might be subsiding as of the second quarter. The rate of decline within managed care RPPD—the daily reimbursement rate paid to skilled nursing providers per patient by managed care—did slow, which suggests that the managed care rate of decline may be plateauing. The quarter-over-quarter decline to $437.85 per day was only -0.2% compared to the steep declines of -1.2% and -1.7% seen in the prior two quarters. Year-over-year, the rate declined 4.2% from $457.08.
Given the fact that the latest year-over-year data still shows a significant decline, we still need to be cautious in interpreting this quarter’s data. To call this recent quarterly comparison a trend might be foolish as it is only one quarter of data that shows the decline abating, but this development warrants attention as we watch what happens in the third quarter.
This particular data metric, managed care RPPD, has grown in importance over the last few years because of the growth of managed care. Specifically, Medicare Advantage (MA) plans have grown significantly in popularity, as the number of people turning age 65 in our country and now eligible for Medicare has grown significantly, as well. For skilled nursing operators, who have increasingly felt the effects of pressure from MA plans both in terms of length of stay and reimbursement rates, any leveling off of the rate of decline in per day rates would be a welcome turn of events.
Medicaid RPPD Hit a Five-Year High
In the second quarter of 2016, Medicaid RPPD grew 0.3% to $198.16, which is a change from the prior quarter’s flat growth. Year-over-year Medicaid RPPD grew 0.9% from $196.31 in June 2015. The current June RPPD of $198.16 represents the highest rate within this time series and a compound annual growth rate of 1.3% since October 2011.
Although the growth of Medicaid RPPD seems to be somewhat of a bright spot for operators, one question is if $198 per day is enough to cover the cost of care for a resident in skilled nursing. Answering that question is not so easy, because the rate and expenses can vary significantly by state and county. Operating expenses seem to be growing faster, especially labor wages, which are a significant percentage of total operating expenses. So with such a low reimbursement rate compared to other payers (e.g. Medicare), there’s not only the challenge of covering the cost of care, but if the growth rate of reimbursement continues to trail the growth rate of expenses, it can create significant pressure on profitability.
We will look forward to reporting on the key metrics next quarter to see how these current trends evolve.
[/expand] [cresta-social-share]
NIC Investment Guide Released and Available for Download
 The fourth edition of the NIC Investment Guide: Investing in Seniors Housing & Care Properties is now available for download. This is NIC’s flagship publication that serves as a primer on the opportunities and challenges of investing in seniors housing and care properties. It provides the most comprehensive and reliable data, as well as trend insights, to serve as the definitive resource for those invested or looking to invest in the sector.
[expand title=”Read More” trigpos=”below” tag=”div” trigclass=”nic-read-more”]
The Investment Guide highlights the nation’s investment-grade seniors housing and care market, which is estimated to have nationwide inventory of nearly 23,400 properties inclusive of more than 3.0 million units. Its overall market value is estimated at $327 billion, which assumes an average $165,000 price per unit for seniors housing properties and an average $81,000 price per bed for nursing care properties.
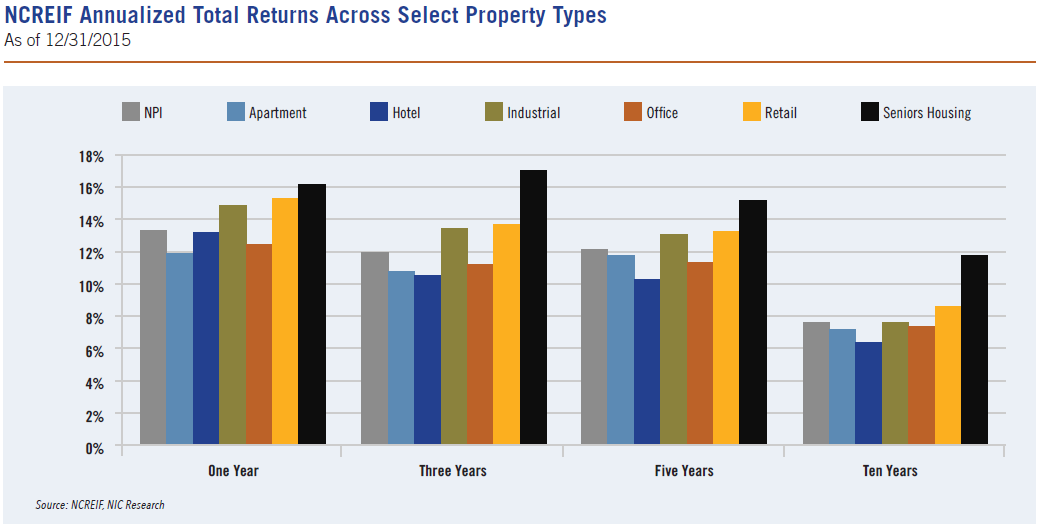
As depicted in the following exhibit from the Investment Guide, seniors housing properties have regularly outperformed all of the core investment property types within the database of the National Council of Real Estate Investment Fiduciaries (NCREIF). Seniors housing properties have generated an annualized total return of 11.9% since 4Q2005, which compares to an annualized total return of 7.8% for the entire NCREIF Property Index (NPI).
The fourth edition is updated with historical time-series data through year-end 2015. The Investment Guide demonstrates the value of time-series data, which is sought by investors—especially those investing institutional capital. Expanded coverage in this edition includes development considerations, including development and capital spending, as well as emerging trends and observations. Topics covered in terms of emerging trends include:
- Demand and consumer decision-making
- Supply and development
- Design and service strategies
- Capital availability and pricing
- Labor availability, cost, training, and leadership
- CMS policy and regulation impact on long-term care and post-acute care
This year’s Investment Guide Task Force, which was instrumental in the drafting of the fourth edition, was composed of 11 leading industry professionals. The Task Force was co-chaired by Steven Insoft of Omega Healthcare Investors, who is also member of NIC’s Board of Directors, and Carolyn Nazdin of KeyBank Real Estate Capital, who previously was a member of NIC’s Future Leaders Council, for which she served as a vice chair. NIC expresses its sincere appreciation for the contributions of all members of the Task Force.
The Investment Guide’s Executive Summary is available for download free of charge at:
http://www.nic.org/analytics/publications/investment-guide/
The full 152-page publication in a PDF file is available for download for a nominal $50 at:
http://www.nic.org/nic-store/
[/expand] [cresta-social-share]
Seniors Housing & Care Industry Calendar
October – November 2016:
16-19 AHCA/NCAL Convention & Exposition, Nashville, TN
24-26 ULI 2016 ULI Fall Meeting, Dallas, TX
30-2 LeadingAge: 2016 Annual Meeting and EXPO, Indianapolis, IN
15-17 REITWorld: NAREIT’s Annual Convention, Phoenix, AZ
NIC Partners
We gratefully acknowledge our following partners: