April 2019
Skilled Nursing Could Be the Industry’s Dark Horse: A Conversation with Omega’s Taylor Pickett
 The skilled nursing sector has its challenges, but that doesn’t worry Taylor Pickett in the long run. As CEO of Omega Healthcare Investors, a publicly traded REIT with a concentration in skilled nursing, he predicts a brighter future as the inevitable wave of aging baby boomers creates more demand for the product.
NIC senior principal Bill Kaufmann recently had a chance to discuss the evolution of the skilled nursing market with Pickett. Here’s a recap of their conversation.
Kauffman: Can you tell us about your professional background and how you became CEO of Omega?
Pickett: I’m a CPA and a lawyer with membership in the Maryland State Bar Association, though inactive as both at this point in my career. I held a number of executive positions at Integrated Health Services and was the CFO in 2001 when I was recruited for my current role as CEO of Omega. We moved the Omega headquarters from Ann Arbor, Michigan, to Hunt Valley, Maryland. The executive team’s original mandate was to turn around Omega and likely sell the company. By 2004, we had accomplished the turnaround, and the Board decided that the best thing for shareholders would be to continue growing the business.
Today, Omega’s equity market value is approximately $8 billion compared to a value of $70 million when we first started. We own nearly 1,000 facilities. About 83 percent of those are skilled nursing properties, and the balance is comprised of seniors housing. We are expanding our seniors housing portfolio. We have a $280 million assisted living high-rise underway in Manhattan in partnership with Maplewood Senior Living. The community is scheduled to open at the end of the year
Kauffman: We have seen numerous challenges within the skilled nursing sector over the past few years, but it seems there may be some stabilization in occupancy as of late. Do you see that in your portfolio? If so, why is it stabilizing? If not, do you see any signs of stabilization?
Pickett: Our occupancy has been stable for the last six quarters. We believe that we have reached the bottom of occupancy declines, and our extensive demographic data analysis predicts upward occupancy growth over an extended multi-decade timeframe. This correlates exactly with the increase in birth rates beginning in 1941 and the fact that skilled nursing utilization rates begin increasing significantly when people reach age 75.
Kauffman: What do you see as the best way to create value for your shareholders at this point in time?
Pickett: We have created tremendous value via disciplined, but meaningful, capital allocation. We will continue to allocate capital into skilled nursing facility assets with yields north of 9% versus our cost of capital at less than 7%. In addition, we have created tremendous value in our high-end product with Maplewood Senior Living.
Kauffman: Has the thought process toward real estate investing in skilled nursing changed over the last couple years? Are you paying more attention to operations? If so, why?
Pickett: Our thought process has not changed. However, the last few years has further emphasized how critical it is to pick the right operating partners. You can make very smart decisions about real estate quality, asset level cash flows, and location/demographics, but a poor operator can eliminate all of those competitive advantages. Over the last few years, our pool of operators has contracted in response to the tough operating environment.
Kauffman: What metrics do you pay attention to regarding your operating partners? Are there key metrics that are most critical, and how has that changed over the years?
Pickett: Our key metrics have not changed. Our emphasis on trends in clinical outcomes and quality has increased as these factors are more important than ever in determining ongoing profitability. In addition, we continue to monitor cash flow coverages and the impact of labor and reduced Medicare length of stay on operating results.
Kauffman: How long do you think the challenges in skilled nursing will continue?
Pickett: The new PDPM payment model will provide modest near-term industry relief, but the real driver of long-term relief will be occupancy. The positive demographics that drive occupancy are here today and are the primary reason that Omega’s occupancy trend has been flat in the face of ongoing Medicare length-of-stay reductions. As Medicare length-of-stay reductions moderate, we expect that occupancy will begin to climb. Our prediction is that we will begin to see occupancy growth, driven by demographics, within the next 12 months.
Kauffman: In your opinion, what makes a great skilled nursing operator?
Pickett: Most great operators were former administrators and have incredible attention to details. Usually, these operators visit all of their facilities on a regular basis several times per year.
Kauffman: How do skilled nursing operators get to the next level to be the best in their market?
Pickett: Step One is always great clinical outcomes—both for Medicare and for Medicaid patients. In order to achieve these outcomes, operators must be able to attract and retain outstanding clinicians, from the director of nursing through nurse assistants.
Kauffman: How do you view the operating environment in terms of the size of operators? Mom-and-pop, regional, and large? Is it better to be local from an operations perspective?
Pickett: We see the most success with our larger regional operators that have the benefit of scale and still are able to manage in a tighter geography. They typically have the resources to recruit, hire, train, and retain staff, while still having the bandwidth to personally visit all of their locations on a regular basis. That being said, we see plenty of national and local providers achieve excellent results by creating models that allow them to scale up or down, as required.
Kauffman: Can a skilled nursing operator have a competitive advantage?
Pickett: There is no doubt that there are competitive advantages that stem from the factors we have already discussed. Mainly, these are a focus on clinical outcomes and the attention to details, both financial and operational. That being said, it really helps when your facility is in the right location in the right market.
Kauffman: NIC just held its Spring Conference with the theme of healthcare collaboration. Are your operating partners implementing more care coordination with upstream and downstream partners? What do you see as opportunities within that strategy?
Pickett: There is certainly going to be more collaboration as care plans focus not only on the current issues that patients face, but also on preventative and predictive care models. None of this activity and coordination is new, but we have the benefit of much more powerful technology which we will need to care and pay for the massive wave of aging baby boomers.
Kauffman: A positive for skilled nursing over the last few years is plentiful liquidity. Do you agree? And what risks will this pose as the credit cycle plays out?
Pickett: I agree that there has been quite a bit of liquidity in the market. I don’t think that liquidity in and of itself will create any issues when the cycle tapers down. However, there will always be situations where borrowers have levered up with variable rate debt that may be difficult to refinance at similar debt costs, and in some cases equity infusions may be necessary.
Kauffman: What do you see as the risks and opportunities with PDPM?
Pickett: We see very little risk, other than the first few months of implementation, from PDPM. Our analysis confirms that it will be revenue neutral and that there will be expense savings by utilizing group and concurrent therapy. PDPM is a wonderful example of good policy that will promote better patient outcomes without incremental taxpayer dollars, while recognizing the appropriateness of efficient therapy delivery in many settings.
Kauffman: Judging by our nation’s aging demographics, the Medicaid population will grow significantly. Are we prepared as a country to serve that population? Is there an investment opportunity when it comes to this demand for care in the long term?
Pickett: I believe that caring for our growing elderly Medicaid population will ultimately become a massive issue for our industry and the country. As you know, Medicaid care in skilled nursing facilities is completely need driven, and, by definition, our Medicaid residents require round-the-clock care and have exhausted their financial resources. Technology may help slow the emergence of the issue (such as driverless vehicles and enhanced monitoring capabilities), but ultimately, care is provided person to person. I think there could be expanded real estate opportunities; however, given the lower occupancies in many states, I don’t think we will see that need/opportunity for a number of years.
Kauffman: What do you see as: 1) the greatest opportunity; and 2) the greatest risk for skilled nursing operators in both the near term and in the next 10 years?
Pickett: We believe that most of the risk is near term, as operators struggle with historically low occupancy and a tough labor market. Most of our operators just battle through these issues every day. The opportunity is longer term, as the demographic wave, that is here, continues to grow. Over the next 10 years, all boats will rise as the tide comes in. The bigger winners will be the operators who have the vision to invest in the care delivery models best suited to both the immediate needs of the resident and the preventative and predictive models that are evolving.

NIC MAP® Introduces Seniors Housing Rate Tiers
 In commercial real estate, property class designations (i.e., Class A, Class B or Class C) are based on a combination of factors that allow investors and analysts to more easily classify, distinguish, and compare properties against each other. Depending on the property type—retail, office, industrial or multifamily—a variety of factors are used to make these distinctions. These may include age of property, quality of physical structure, property amenities, metropolitan area location including CBD versus rural or suburban, rent levels, transaction sales prices, rental income, appreciation, and income growth potential. These property class designations can often provide an investor a framework for understanding how each property is positioned within their overall investment strategy. However, they may not always be objective and may in some instances be subjective and non-standardized.
NIC MAP® Seniors Housing Rate Tiers
Similar to the intent of “class categorizations” seen across other commercial real estate property types, NIC MAP has recently developed a “rate tiers” approach to our seniors housing property database that is quantitative and objective, with a goal to further segment our data for our clients. Useful to investors, analysts, and senior living operators who wish to benchmark their properties to properties with similar rate structures, this approach allows NIC to promote greater transparency within the seniors housing property type and creates greater comparability to other commercial real estate property types.
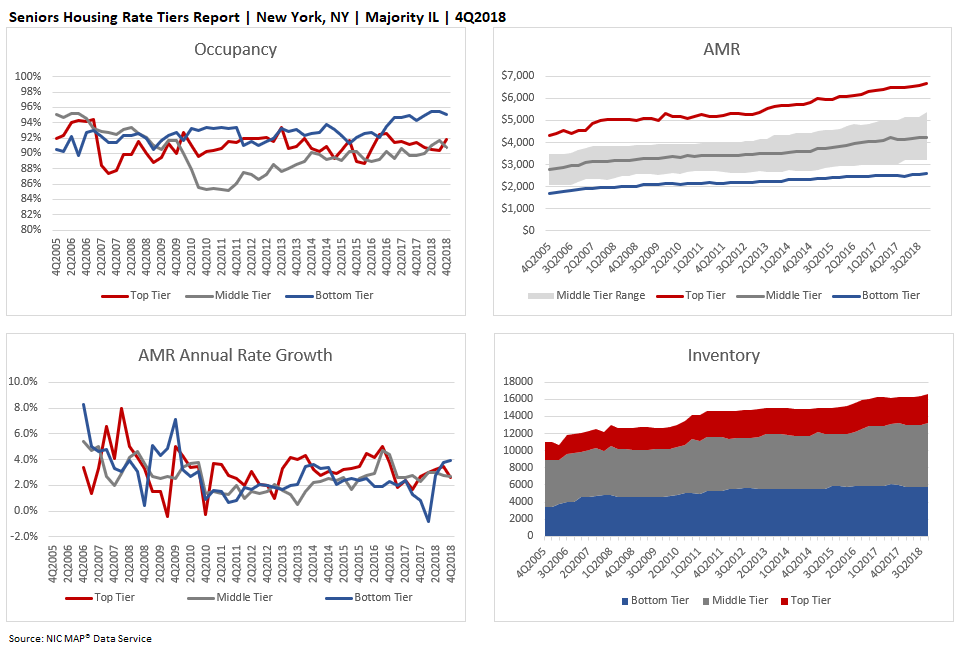
The NIC MAP Seniors Housing Rate Tiers Report provides a historical time series of average market rates (AMRs) and AMR annual rate growth, occupancy and inventory for majority independent living (IL) or majority assisted living (AL) property types by rate tier and metropolitan market for the 31 Primary Markets.
Defined uniquely for each metropolitan market (as opposed to a national average), three rate tiers for each metropolitan market have been estimated based on average market rate (AMR) data that is segmented by quartiles into three groupings: top tier (i.e., top quartile), middle tier (i.e., middle two quartiles), and bottom tier (i.e., bottom quartile). Each quarter, each property is classified into one of these three categories, and the designation of a property can change from one quarter to the next.
The NIC MAP Seniors Housing Rate Tiers Report includes a “same-store” methodology for computing rate growth within each tier. Year-over-year rate growth is computed by using only the properties included within a respective rate tier from one period to the next.
The example below shows the standard four charts found in the majority independent living rate tiers report for the New York metropolitan market for 4Q2018.
Assisted Living and Independent Living Results Vary
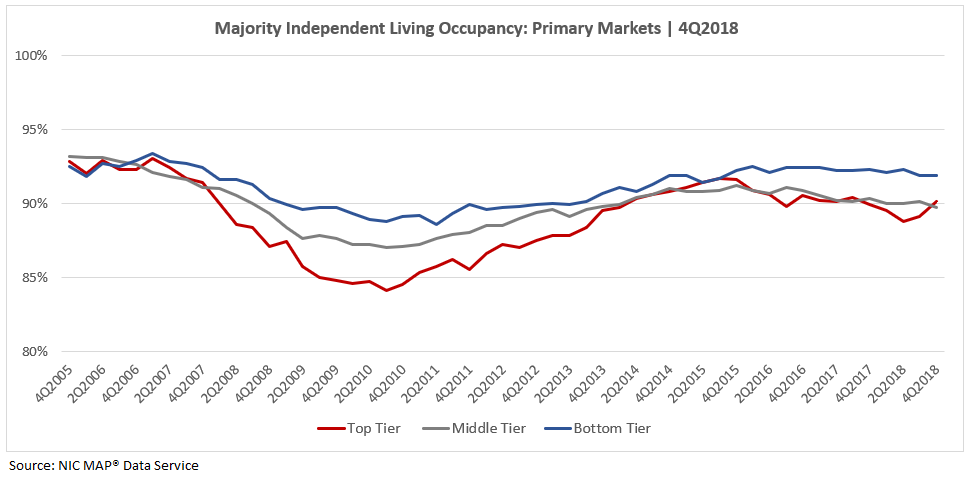
The charts below depict occupancy by NIC’s three rate tiers for majority independent living and majority assisted living across the time series, aggregated for the 31 Primary Markets.
Interestingly, the occupancy rate for bottom tier majority independent living properties in the 31 Primary Markets has generally outpaced the top and middle tiers since 3Q2006. The occupancy “spread” by rate tier was the greatest during and coming out of the Great Recession, perhaps due to the greater affordability of bottom tier properties, which may have allowed them to maintain higher occupancy rates than the top and middle rate tiers.
More recently, majority independent living occupancy rates for the three rate tiers converged close to 91% in the second and third quarters of 2015. Since then, and as the market has softened, the difference in occupancy rates between the bottom and top tiers widened to as much as 3.5 percentage points in 2Q2018, when the average occupancy rate of majority independent living properties in the 31 Primary Markets was at a four-year low point. Currently, in 4Q2018, bottom tier majority independent living occupancy (91.9%) is 1.8 percentage points higher than in the top tier (90.1%).
However, rate tier occupancy for majority assisted living property types in the 31 Primary Markets followed a different pattern. Bottom tier majority assisted living property occupancy rates were lower than the top and middle tiers leading into and through most of the Great Recession.
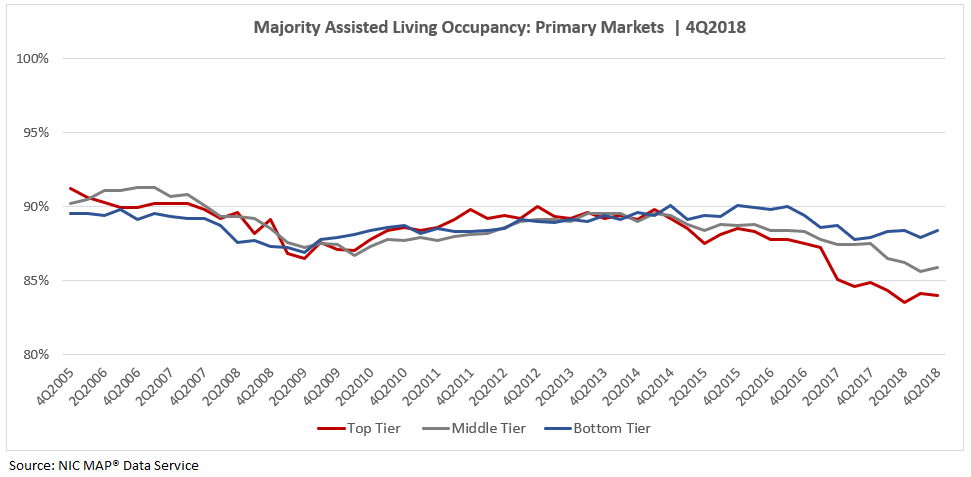
Coming out of the Great Recession, majority assisted living inventory grew at a faster pace than majority independent living, and occupancy across rate tiers was relatively narrow until it began to diverge around the fourth quarter of 2014, as strong supply growth outpaced demand. Since then, bottom tier occupancy rates have exceeded the top and middle tiers. More recently, majority assisted living occupancy in the 31 Primary Markets was 85.4% in 4Q2018, near its record low rate of 85.3% reached in 2Q2018, when the difference between the bottom and top tiers was the widest at 4.9 percentage points. Currently, the difference between the bottom and top tiers is 4.4 percentage points.
Conclusion
The “rate tiers” approach to seniors housing properties provides NIC MAP clients another way to segment the data. The report allows an analyst to review average market rates for majority independent living and majority assisted living properties by rate tier, as well as AMR annual rate growth, occupancy and inventory by rate tier at the metropolitan market level for the 31 Primary Markets, including market aggregates for the 31 Primary Markets, Secondary Markets (32-99), and the 99 Primary and Secondary Markets.
The increased granularity raises a number of intriguing questions to be explored, such as:
- Are markets with high top tier AMR annual growth rates dominated by large chain properties?
- Do markets with high variability between the top and bottom tiers suggest the need for greater local focus when analyzing the market fundamentals?
- What are the benefits and drawbacks of investing in metropolitan markets with wide or narrow variations in top and bottom tier pricing?
- Do top tier properties tend to be newer and bottom tier properties older?
- Are top tier properties located in neighborhoods with higher property values than bottom tier properties?
- Does the greater affordability of bottom tier properties help insulate them from occupancy pressures in times of fluctuating local demographic and economic conditions?
- How does AMR annual rate growth relate to changes in inventory and occupancy by rate tier?
In coming months, NIC will begin to explore some of these questions. In the meanwhile, dig in and examine the data. Let us know if you find some intriguing results. And thanks in advance!

Hackathon Recap: Giving Boomers What They Want
One of the most talked-about sessions at the recent 2019 NIC Spring Conference was the “Boomer Hackathon,” in which three teams—and those in attendance—brainstormed innovations in seniors housing appropriate for incoming Baby Boomers. A standing-room-only crowd participated in the event, forming small groups to attack the same problem as three teams of experts, who were formed ahead of time.
Popularized by Silicon Valley, the hackathon format hammers out rough, but functional solutions, usually in 24-72 hours. NIC’s inaugural hackathon did so in 75 minutes, but not without a little advance preparation from each of three official teams. Lead by industry veterans, each team of three was selected from a pool of applicants. NIC’s approach to selection was based primarily on diversity of experience and perspective. In studies of hackathons, this strategy has proven effective.
The session wasted no time. Co-facilitators Jacquelyn Kung and Bob Kramer quickly introduced the concept at hand, introduced the teams, then directed them to get to work. Kung encouraged attendees to form small groups of their own to dig into the issue, which was to create a retirement living model that works for Boomers, a business model that works for the investor (both debt and equity), and a business model that works for the operator.
The teams were:
- Lynn Katzmann, CEO, Juniper Communities; with Gracyn Robinson Senior Interior Designer, LWDA Design/Architects and Mike Mattingly Principal, Avenue Devlopment
- Kurt Read, Principal, RSF Partners; with Rachel Kelly, graduate student, Cornell University and Hsuan (Andy) Yao, graduate student, University of Southern California
- Sean Kelly, CEO, the Kendal Corporation; with Ashley Wilkens Senior Vice President, Ziegler Investment Bank and Astrid Kramarz Director-Healthcare Lending, Bank of West
A panel of three independent judges, all boomers themselves, was on hand to ask questions and provide feedback. These were Steve Moran, Publisher, Senior Housing Forum; Jenny Brimhall, a San Diego realtor; and Todd Reis, an actor and magician.
While the teams got to work, Kung split the room in half, instructing attendees on one side of the room to form small groups and brainstorm one innovative feature of a living complex attractive to Boomers age 64-73. Groups on the other side of the room were asked to think of an innovative financing approach for a non-traditional living model—and to specify if it was for the operations side or the real estate side.
The room buzzed with discussion as attendees and teams alike attacked the issues, huddled around whiteboards, or circulated the room to listen. After ten or so minutes, it was time to hear each team’s 2-minute “pitch” to the judges.
First to pitch was Kurt Read, whose team presented the “live to learn” concept, a Cornell University alumni community on New York’s Roosevelt Island. The community would mix senior alumni with college students and offer continuing education in luxury, all-inclusive living spaces within easy reach of the city. The project’s investment case for operators features marketing to a large alumni community and outsourcing a-la-carte services. Net margins of 40% might be shared with the university. Assumptions were for 200 apartments, 60% double occupancy, 100 day passes at $5,000 per person, and a 90% steady state of occupancy.
Judges and the audience asked questions of Read, who highlighted the attractiveness of “going back to school” and that the model could scale to other locations, making it a “portable” independent living concept.
Katzmann’s pitch was for an international destination offering, featuring efficient 3-D printed buildings and interiors, solar and energy-efficiency, and even gardens to supplement food supplies. Seniors would be pitched on the ability to travel and live in communities around the world. Financials for operators would net an EBITDA of 40%, with retail covering 15% of debt service requirements. Investors would save 20-25% on lower-cost 3-D printing and gain significant savings from solar and energy efficiencies. A seven-year horizon and 12-month lease up would yield a 5% cap rate upon sale, for a 6% unlevered IRR.
Sean Kelly delivered the final pitch and revealed that his team’s “pitch” was, in fact, a real project currently in development. He walked through artist’s renderings and floorplans as he described how “Kendal at Sonoma,” marketed as a “Zen-lifestyle community,” will offer Boomers portability with sister campuses in other locations, access to community, walkability, and numerous amenities designed around life-balance and well-being.
As session co-facilitator Bob Kramer later pointed out, no matter who might be considered a winner, perhaps the most interesting outcome of NIC’s first Hackathon was the revelation that all three teams made portability a feature of their appeal to Boomers. Other attendees noted that, while perhaps not yet the new normal, the new concepts—and the idea that operators and investors should think outside the box when preparing for Boomers—should be taken seriously as the generation that changes everything approaches senior living and care.
Editor’s note: All calculations presented in this article are rough estimates and do not represent actual underwriting models.

Underwriting Healthcare in Private Pay Seniors Housing
Meet Mary. She’s 86 years old, with arthritis, osteoporosis, hypertension, and COPD. Her story gave the NIC Conference’s opening panel “Underwriting Health Care in Private Pay Seniors Housing” a platform to illustrate how the broader healthcare system is starting to impact net operating income (NOI) calculations for seniors housing properties.
A panel of highly experienced industry leaders walked through how today’s senior housing properties handle the health care needs of their residents, before discussing how that is likely to change in coming years, and how investors will need to understand the impact of those changes on NOI.
John Rijos, the co-founder and CEO of Chicago Pacific Founders, and the former co-president and COO of Brookdale, explained how Medicare Advantage (MA) plans work, and how they are changing how properties are compensated.
Jerry Taylor, executive vice president at Solera Senior Living, shared his insights from years working at the property level, providing practical insights for investors, many of whom might not be familiar with property level operations, on how Mary’s care would be handled today by a typical property.
Chris Winkle, the CEO of Sunrise Senior Living, described what will be going on in 2025 in the private-pay arena, and what investors will need to look for as they analyze properties in a value-based world. Winkle’s projections were well-informed. His company already created their own Medicare Advantage plan.
Guided by moderator Joel Mendes, senior vice president, Seniors Housing Capital Markets at JLL, the discussion quickly covered the realities underlying today’s investment assumptions, and then got into how those assumptions are likely to change, using 2025 as a hypothetical comparison. As Medicare Advantage plans impact how properties do business, investors will need to understand their influence in the very near future.
Mary went through a number of experiences involving health care episodes. In today’s fee-for-service model, Mary endures several trips to the emergency room and ends up costing Medicare over $60,000 during her time in assisted living. The panel described how properties traditionally handled medical episodes, often sending residents to the emergency room for care. These properties cooperate with medical professionals but receive no financial consideration for the care they provide (other than standard monthly care charges).
The panel then fast-forwarded six years to 2025, playing out Mary’s scenario in a community collaborating with local Medicare Advantage plans. In this model, Mary receives care onsite, avoiding trips to the ER, and ends up staying healthier longer. She also pays less in monthly care charges. Mary’s length of stay also increases. The private pay senior living property provides medical services in a lower-cost setting and reduces ER visits and hospitalizations. In recompense for lowering these costs while improving quality of care, the collaborating Medicare Advantage plans pay the property an average of $500 per month per enrolled resident.
The panel discussed the valuation worksheet below that they designed to illustrate, from an investor’s perspective, how a property today will compare to the same property in 2025, working with a group of assumptions that are discussed below. In the end, Mary appears to have a better experience in 2025 and the property, which by 2025 has a 50% collaborating MA plan participation rate, realizes a 20% increase in NOI.
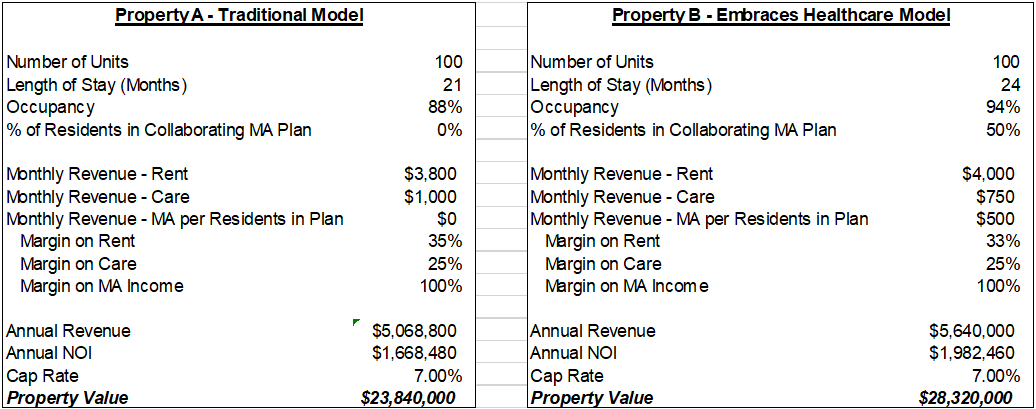
The assumptions underlying the valuation worksheet take into consideration a number of factors that were carefully considered and debated by the panelists. Panel moderator Joel Mendes, of JLL, explained that when asked about the assumptions, not all panelists agreed on every assumption but they all agreed the circumstance described was plausible. A follow up session featured a dynamic live worksheet on the big screen, in which differing assumptions, offered by attendees and panelists, could be calculated and discussed. Even with the more conservative assumptions that were entered into the worksheet during the session, the model that embraced the Medicare Advantage plan still appeared to increase value.
The notion of the worksheet is that Property B is receiving inbound referrals from physicians and health systems that are economically incentivized to refer their patient base into an environment that provides the highest quality of healthcare. It is assumed that this property has the technology and infrastructure to provide the data that these systems need in order to feel confident in making that referral. In this scenario, Property A does not have this source of referrals. This advantage is reflected in Property B’s higher occupancy rate, as well as its base rental rate.
The other assumptions underlying Mary’s fictional healthcare-oriented property in 2025 are as follows:
“Length of Stay” increased for Property B, both because residents will stay healthier for longer, and also because referral networks will likely want to send patients to the property earlier, in order to reduce the likelihood of avoidable accidents, amongst other reasons.
“% of Residents in Collaborating MA Plan” reflects the assumption that, by 2025, half of Property B residents will be enrolled in an MA plan which financially benefits the property.
“Rent” assumes that Property B has a competitive advantage, due to inbound referrals, and will be able to charge slightly higher rents as a result.
“Monthly Revenue – Care” is lower for Property B, due to a healthier resident base.
“Monthly Revenue – MA per residents in plan” assumes that collaborating MA plans would be contributing $500 per month for things like transportation, palliative care, and nutrition.
“Margin on Rent” is reduced slightly to reflect that one to two onsite persons would be responsible for coordinating care. This assumption was made despite an argument that if you go from 88% to 94% occupancy, that last 6 percentage points is higher margin, which would offset some of this additional cost.
“Margin on MA Income” reflects that the property already has the infrastructure and is providing the services that MA plans are attracted to and pay for.
“Cap Rate” is kept the same. In today’s market investors generally require a higher return on revenue from a non-private pay source. It could be argued that revenue derived from an MA plan, and therefore dependent upon a government program, should have a higher cap rate. However, it also could be argued that Property B is best equipped to cater to the health care payment environment in 2025 and is therefore a less risky investment. The two opposing forces were assumed to offset one another.
How realistic is this? Rijos and Winkle both shared their real-world experience of offering Medicare Advantage plans to their residents, and said it is very realistic.
Taylor, who vetted details prior to implementing an MA plan, felt that any prudent operator should educate themselves on these concepts. All of the panelists agreed that operators and investors alike are at risk if they’re not making informed decisions about how they intend to address healthcare going forward.
You can view a recording of the session here.

University Outreach Expands Leadership Talent Pool
 By NIC Future Leaders Council (FLC) members Sarah Peerson, vice president, Senior Housing Finance, Wells Fargo Bank and Tom Mathisen, vice president, Investments, LCS
The seniors housing industry is growing and evolving. The well-publicized aging population will require more senior living options and a larger workforce to staff the buildings and manage the assets. That emerging reality creates the need for thoughtful leaders and highly-engaged talent.
The National Investment Center for Seniors Housing & Care (NIC) recognizes the need and addresses it through many channels as part of its mission. One of those channels is the University Outreach Committee, spearheaded by the NIC Future Leaders Council (FLC).
The University Outreach Committee was formed in 2013 under the direction of the FLC with a goal to pair talented students from university undergraduate and graduate level programs with leading firms in the seniors housing and care industry for summer internship experiences and entry level job opportunities. The committee launched its program with a network of seven universities that have highly regarded specialized programs including Cornell, Columbia, Washington State, University of Pennsylvania, University of Maryland, University of Southern California, and the University of Wisconsin. Through FLC member relations with their alma maters, as well as through industry members’ collegiate contacts, the roster now includes 22 schools. Each of these schools offers a specialized program in one or more of the following fields: real estate, hospitality, finance, gerontology and/or technology.
In past years, NIC’s FLC facilitated internship opportunities for qualified students at REITs, large banks, national and regional operators, private equity firms and consulting firms. The opportunities began primarily on the investment side related to real estate or finance but grew to include opportunities in operations, technology and human resources. In addition, given the industry wide labor shortage, the committee reaches out on a smaller scale to high schools and trade schools to educate those students on entry level community career opportunities.
NIC maintains a dedicated website promoting the internship program, which also serves as an application portal for interested students. Internship opportunities are posted in early fall to align with the corporate recruitment process which typically begins in mid to late fall. Once internships are posted, members of NIC’s Future Leaders Council work with the universities to promote the opportunities on campus. This platform offers an extra boost to the recruiting efforts of each company that participates. Forming relationships with students seeking careers in the industry is a great benefit as recruiting continues to be a challenge.
The latest initiative of the University Outreach Committee is on-campus presentations. FLC committee members rolled out a template presentation last summer to be used by anyone in the industry who may be interested in presenting to a group of college students. It covers industry statistics and uses photos to share what a seniors housing community looks like today. The presentation also takes a high-level look at a property P&L statement and discusses the job opportunities available in the industry from the level of community operations to investment management.
It should also be noted that NIC offers scholarships for students to attend the Fall and Spring NIC Conferences. Since the initiative was launched in the spring of 2016, the number of scholarships available for each conference ranged from 10 to 16.
In yet another way NIC is supporting the academia is through Vision 2025, an event to be held in Chicago on June 19 and 20. Vision 2025 is sponsored by NIC, American College of Health Care Administrators (ACHCA), American Health Care Association/National Center for Assisted Living (AHCA/NCAL), American Senior Housing Association (ASHA), Argentum, LeadingAge, and National Association of Long Term Care Administrator Boards Foundation (NAB Foundation). The goal of the event is to ensure the health and continuity of the seniors housing industry through the development of at least 25 robust university and college programs that train future leaders by 2025. In attendance will be numerous key influencers from the seniors housing industry as well as leadership within the world of academia. Vision 2025 could very well set the stage for a very collaborative, though-provoking, and productive platform focused on making the connection to universities.
Moving forward, the University Outreach initiative will seek to grow its presence, with a goal to add at least two new university and employer relationships each year. Relationships can be established through various alumni connected to NIC as well as the broader industry. Everyone in the industry is highly encouraged to reach out to their alma maters, as well as universities, community colleges, or other academic institutions within their region.
NIC is an organization with a broad reach in the industry through its many points of contact. Through all NIC channels, including the FLC, the University Outreach Committee works to create a respected entity focused on recruiting the future leaders of the seniors housing industry.
To be sure, the mission of the University Outreach Committee is a bit daunting in the context of the industry’s future workforce needs. It is important to realize that every point of contact, whether great or small, makes a difference. NIC and the FLC, as well as the University Outreach Committee, stand ready to partner with colleagues in the industry to further this important mission.