CCRC Care Segment Performance Outshines Non-CCRCs

Analysis examines current inventory, occupancy, year-over-year same store asking rent growth—and average occupancy growth, average annual same store asking rent growth, and average change in inventory for the past three years—by care segments within CCRCs compared to non-CCRCs

As the leading data provider for the seniors housing and care industry, the NIC MAP Data Service® tracks occupancy, asking rents, demand, inventory and construction data for independent living, assisted living, memory care, skilled nursing and continuing care retirement communities (CCRCs), also referred to as life plan communities, for more than 15,000 properties across 140 metropolitan areas. NIC MAP® currently tracks 1,196 nonprofit and for-profit entrance fee and rental CCRCs in these 140 combined markets (1,125 in the 99 combined Primary and Secondary Markets).

CCRCs offer multiple care segments (at a minimum independent living and nursing care) typically by a single provider on one campus. This analysis breaks the care segment types apart from the CCRC community type that NIC includes under the main category of Seniors Housing. Care segment type refers to each part or section of a property that provides a specific level of service, i.e., independent living, assisted living, memory care or nursing care.

Expanding on a recent NIC blog post that detailed 3Q 2019 CCRC market fundamentals data and trends in the 99 combined Primary and Secondary markets, which represent the aggregate of the data collected from 99 of the nation’s largest core-based statistical areas (CBSAs), the following analysis examines current inventory, occupancy, year-over-year same store asking rent growth—and average occupancy growth, average annual same store asking rent growth, and average change in inventory for the past three years—by care segments within CCRCs (CCRC segments) compared to non-CCRC segments in freestanding or combined communities to focus a lens on the relative performance of care segments within CCRCs.

Key Findings:

CCRCs reported higher occupancy and rent growth than non-CCRCs, which had significantly higher levels of inventory growth. Higher inventory growth at non-CCRCs, lower turnover at CCRCs, CCRC customer characteristics (e.g., “planners who are attracted to lifestyle-enriched amenities and services with the security of knowing future healthcare needs will be met) and the relative performance of the majority unit mix may explain potential reasons for these stronger rates of occupancy in CCRCs.

  • As of 3Q 2019 in the 99 Primary and Secondary Markets, the overall occupancy rate at CCRCs was 5.0 percentage points higher than at non-CCRCs (91.4% vs. 86.4%). And, between 3Q 2016 and 3Q 2019, care segment occupancy improved more for CCRCs than non-CCRCs.
  • The current occupancy rate for both CCRCs and non-CCRCs was highest in the independent living care segment (92.7% and 88.4%); occupancy was lowest for CCRCs in the nursing care segment (88.7%)—and for non-CCRCs in the memory care segment (83.7%).
  • The difference in current occupancy between CCRCs and non-CCRCs was the highest for the memory care segment (7.6 percentage points), followed by the assisted living care segment (6.1 percentage points), the independent living care segment (4.2 percentage points) and the nursing care segment (2.8 percentage points).
  • For the three-year time period under study (3Q 2016 to 3Q 2019), CCRCs had higher rates of occupancy growth than non-CCRCs for each of the four care segments.
  • The memory care segment at CCRCs reported the highest occupancy growth (2.3 percentage points). The least growth in occupancy was noted for the non-CCRC independent living and assisted living care segments (declining 3.0 and 2.6 percentage points, respectively).
  • Inventory growth (reported as the change in the number of units from 3Q 2016 to 3Q 2019) was higher for non-CCRCs across all of the four care segments.
  • Both CCRCs and non-CCRCs reported the largest (proportionate) inventory growth for the time period in the memory care segment.
  • Only the nursing care segment reported negative inventory growth (CCRCs -2.3% and non-CCRCs -1.1%). Reasons for negative inventory growth may include some beds being taken offline, combined, or shifted to lower acuity care segments.
  • From 3Q 2016 to 3Q 2019, the highest average year-over-year same store asking rent growth was noted for CCRCs in the independent living and assisted living care segments (3.4% and 3.3%), and the lowest for non-CCRCs in the independent living care segment 2.1% (which, incidentally, also had the largest negative average change in occupancy for the three-year period under study, -3.0 percentage points).

Current Unit Mix and Occupancy

In the third quarter of 2019, CCRC occupancy, which is inclusive of both entrance fee and rental payment types in both nonprofit and for-profit communities across the 99 Primary and Secondary Markets, was 91.4%–equal to the highest occupancy rate achieved since 4Q 2008. Non-CCRC occupancy averaged 86.4% in 3Q 2019 (5.0 percentage points lower than CCRC occupancy).

Conventional wisdom suggests that the wide discrepancy in occupancy rates may be due, in part, to the unique CCRC product offering, which tends to attract retirees who are “planners”—those who wish to make one move to a continuum of care—or perhaps because new CCRC residents are generally healthier than residents in other types of seniors housing, resulting in lower resident turnover in CCRCs.

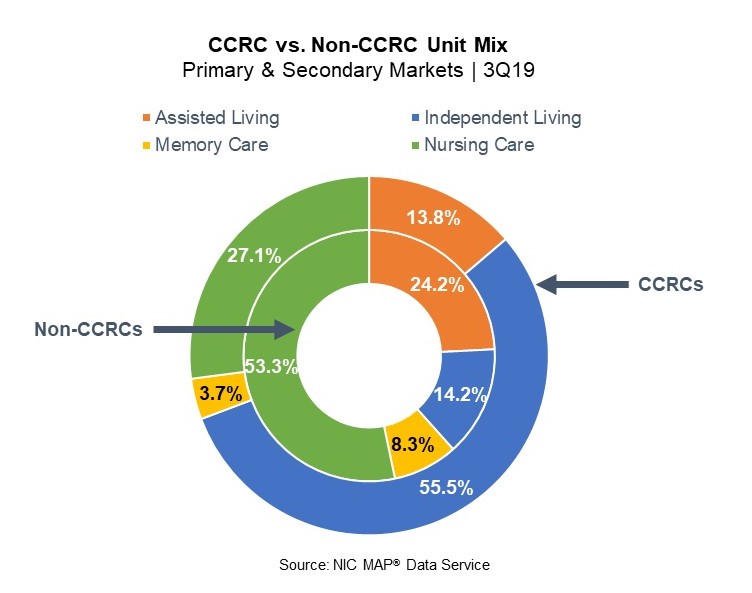
However, another potential reason for the difference in occupancy rates may be a result of the relative influence of the majority inventory mix in CCRCs compared to non-CCRC communities (freestanding and combined). As shown in the chart, in aggregate, CCRCs are comprised of a majority of independent living care segment units (55.5%), followed by nursing care units (27.1%), assisted living units (13.8%), and memory care units (3.7%). Compared to CCRCs, non-CCRCs have lower proportions of independent living care segment units (14.2%), higher proportions of nursing care units (53.3%), assisted living units (24.2%) and memory care units (8.3%) than CCRCs.

Thus, the overall CCRC occupancy rate, compared to the overall non-CCRC occupancy rate, may be influenced positively by majority unit mix as the CCRC independent living care segment (which represents 55.5% of CCRC units) garnered the highest occupancy in the third quarter of 2019 (92.7%), as well as on average for the three-year period under study. The current nursing care segment occupancy rate in non-CCRCs, which represents 53.3% of non-CCRC units, was much lower at 86.0%.LPC Chart and Table_NIC_12.10.19
CCRCs vs. Non-CCRCs in Detail

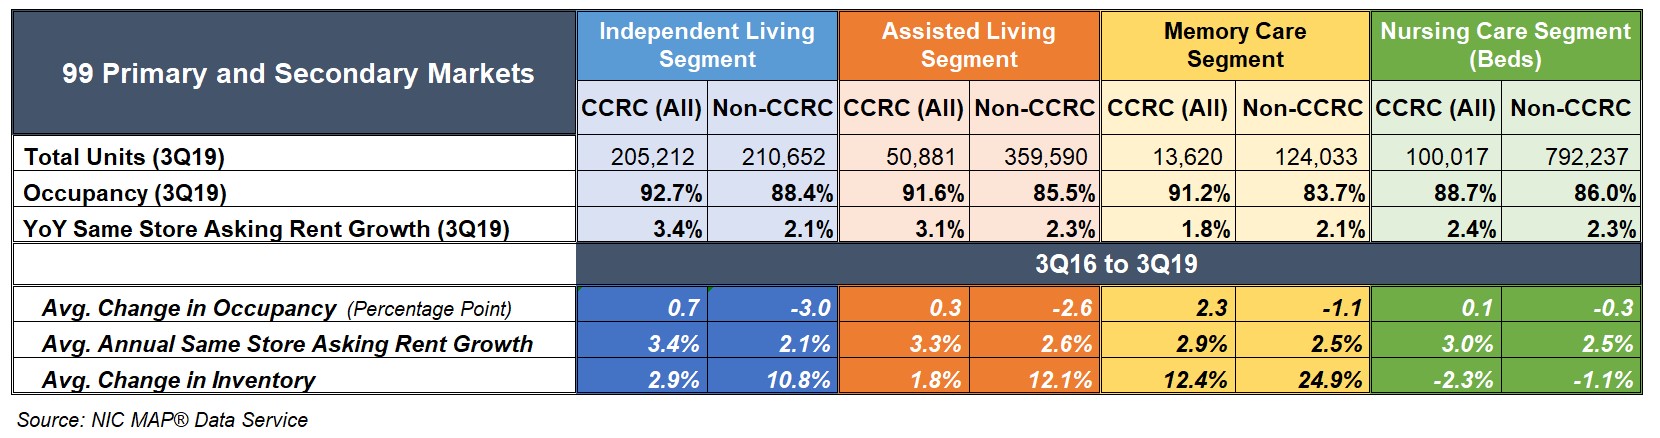
The table below compares each of the care segments—independent living, assisted living, memory care and nursing care—in the 99 Primary and Secondary Markets. The table shows the 3Q 2019 total open units, occupancy and year-over-year same store asking rent growth—and average change in occupancy, average year-over-year same store asking rent growth, and average change in inventory for CCRCs and non-CCRCs for the three-year time period (3Q 2016 to 3Q 2019).

The CCRC independent living care segment had the highest 3Q 2019 occupancy (92.7%), followed by assisted living (91.6%), memory care (91.2%), and nursing care (88.7%). Among non-CCRCs, the independent living care segment had the highest 3Q 2019 occupancy (88.4%), followed by nursing care (86.0%), assisted living (85.5%) and memory care (83.7%).

The difference in 3Q 2019 occupancy between CCRCs and non-CCRCs was the highest for the memory care segment (7.6 percentage points), followed by the assisted living care segment (6.1 percentage points), the independent living care segment (4.2 percentage points) and the nursing care segment (2.8 percentage points). 

CCRC same store year-over-year asking rent growth in the third quarter of 2019 was 3.9% (down from the time series high of 4.6% reached in the first quarter of 2019). The highest year-over-year same store asking rent growth was reported for CCRCs in the independent living and assisted living care segments (3.4% and 3.1%). The lowest was noted for CCRCs in the memory care segment (1.8%), and non-CCRCs in the independent living and memory care segments (2.1%, respectively).
  CCRC table 2 1219-2


Higher Occupancy at CCRCs

For the three-year time period under study, CCRCs had positive improvement in occupancy rates for all four care segments, while non-CCRC care segments saw declines in occupancy.  The best improvement in occupancy was for the CCRC memory care segment (2.3 percentage points), and the largest occupancy declines were for the non-CCRC independent living and assisted living care segments (-3.0 and -2.6 percentage points).

  • Among CCRCs, the memory care segment had the strongest occupancy improvement (a gain of 2.3 percentage points), followed by independent living (a gain of 0.7 percentage points), assisted living (a gain of 0.3 percentage points), and the nursing care segment (a gain of 0.1 percentage points).
  • Among non-CCRCs, the independent living care segment had the greatest change in occupancy and this change was negative (a decline of 3.0 percentage points), followed by assisted living (a decline of 2.6 percentage points), memory care (a decline of 1.1 percentage points), and the nursing care segment (a decline of 0.3 percentage points).

Significantly Weaker Inventory Growth at CCRCs

For the three-year time period under study, non-CCRCs had significantly higher rates of inventory growth (change in inventory), overall, and by segment, than CCRCs. Between 3Q 2016 and 3Q 2019, inventory at CCRCs grew by 1.6% (5,892 units), while non-CCRC inventory growth grew by 5.6% (75,775 units). The highest rate of inventory growth was reported for both CCRCs and non-CCRCs in the memory care segment (12.4% and 24.9%); the lowest was reported for both CCRCs and non-CCRCs in the nursing care segment (-2.3% and -1.1%).

  • Among CCRCs, the memory care segment had the highest inventory growth (12.4%–a gain of 1,507 units), followed by independent living (2.9%–a gain of 5,867 units), and assisted living (1.8%–a gain of 895 units). However, inventory declined in the nursing care segment by 2.3% (a reduction of 2,377 beds).
  • Among non-CCRCs, the memory care segment had the highest inventory growth (24.9%–a gain of 24,752 units), followed by assisted living (12.1%–a gain of 38,904 units), and independent living (10.8%–a gain of 20,562 units). Inventory declined in the nursing care segment by 1.1% (a reduction of 8,443 beds).

Higher Annual, Same Store Asking Rent Growth at CCRCs

For the three-year time period under study, CCRCs had higher rates of average year-over-year asking rent growth overall, and by segment, than non-CCRCs. The highest was noted for CCRCs in the independent living and assisted living care segments (3.4% and 3.3%), and the lowest for non-CCRCs in the independent living care segment 2.1%.

  • Among CCRCs, the independent living care segment had the highest average year-over-year same store asking rent growth for the three-year period (3.4%), followed by assisted living (3.3%), nursing care (3.0%), and the memory care segment (2.9%).
  • Among non-CCRCs, the assisted living care segment had the highest average year-over-year same store asking rent growth over the three-year period (2.6%), followed by the memory care and nursing care segments (2.5%, respectively), and the independent living care segment (2.1%).

Look for future blog posts from NIC to delve deep into the performance of CCRCs. For further information on NIC, its reports, and data and analytics services available to providers, please visit the NIC website at www.nic.org.


A version of this analysis was originally posted to Ziegler’s Z-News newsletter on December 13, 2019.
Seniors Housing Annual Total Returns Equal 7.80% in Q3 2019

National Council of Real Estate Investment Fiduciaries (NCREIF) released investment return performance indicators for the primary commercial real estate sectors, including seniors housing as of Q3 2019.

The National Council of Real Estate Investment Fiduciaries (NCREIF) recently released investment return performance indicators for the primary commercial real estate sectors, including seniors housing. The results for seniors housing are summarized in this blog post. The performance measurements reflect the returns of 124 seniors housing properties, valued at $6.5 billion in the third quarter. As recently as the second quarter of 2018, the value of seniors housing properties reported into NCREIF was $1 billion less, at $5.4 billion with 110 properties reported. While limited in scope, the data reflects the return performance of investment managers who manage or own institutional real estate with a market value of at least $50 million held in a fiduciary setting.

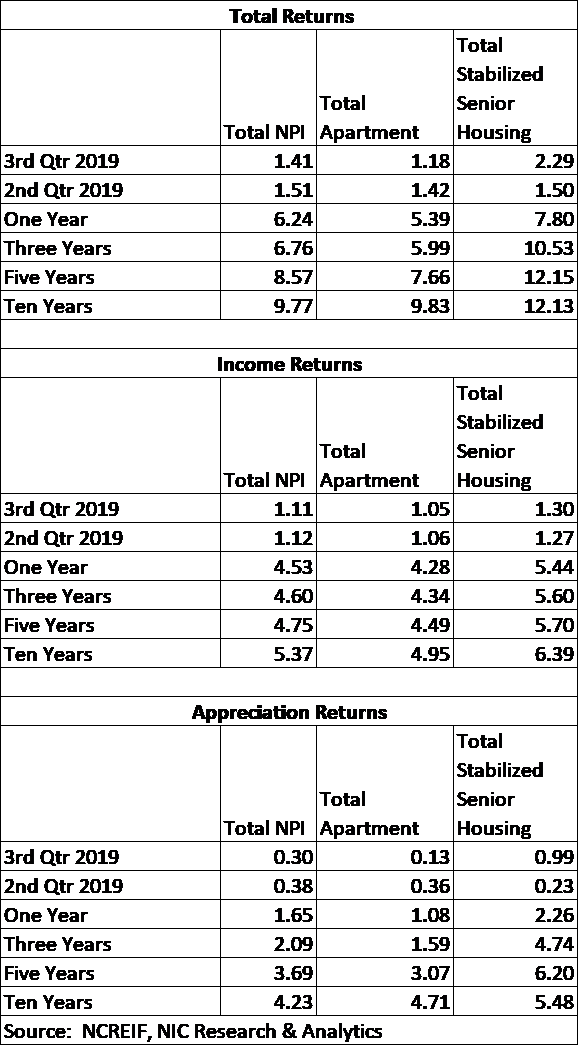
Seniors Housing Capital Returns Outpace NPI.  The total investment return for institutional investors as measured by the 124 properties that reported data to NCREIF in the third quarter of 2019 was 2.29%, composed of a 1.30% income return and a 0.99% capital (appreciation) return. The positive appreciation return indicates that the seniors housing properties in the NCREIF data set continue to increase in value after deducting for capital expenditures. The total return for this quarter was slightly ahead of the average quarterly return over the past four quarters, which was 1.89%. The quarterly total seniors housing return compared favorably with the 1.18% rate for apartments and 1.41% rate for the total NPI. The quarterly appreciation return for seniors housing was particularly strong compared with the NPI and apartments and was 0.99%, compared with 0.30% and 0.13%, respectively. Note that these figures reflect unleveraged returns. 

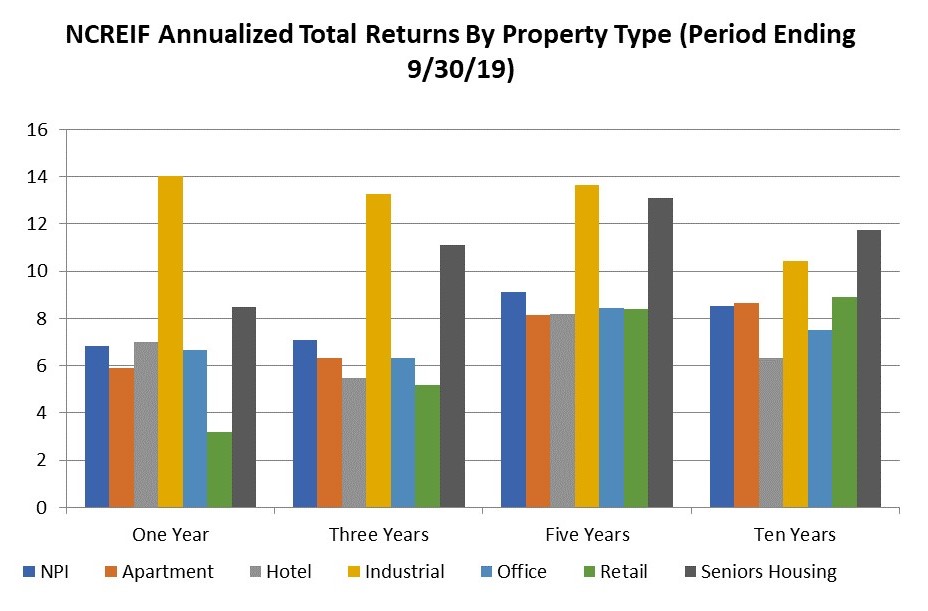
The annual total return through the third quarter of 2019 was 7.80%, exceeding the NCREIF Property Index (NPI) result of 6.24% and the apartment return of 5.39%. However, at 13.64%, industrial total returns significantly outpaced seniors housing. Industrial continues to benefit from e-commerce which has increased demand for last-mile warehouse space. Despite the relatively strong showing for seniors housing, the total annual return has been trending down since mid-2014 when it peaked at 20.37%. This pattern can also be seen in the broader index and reflects where we are in the cycle.

Mace NCREIF image 1-2

Cap Rate Compression.  Based on NCREIF data, the value-weighted cap rate for seniors housing averaged 5.1% in the third quarter, near the mean for the year, but down from the average 5.4% rate seen in 2018 and 5.8% in 2017. Since 2017, cap rate compression has not been as significant for the overall NPI nor apartments. The risk premium is nearly one percentage point higher than for apartments (4.2% cap rate) and 78 basis points for the NPI (4.3% cap rate).


Mace NCREIF image 2b


See NCREIF Real Estate Performance Report Quarterly Highlight.

Addressing the Workforce Crisis: Labor Management Lessons Learned from a Healthcare Setting

I recently joined the Outreach team with National Investment Center (NIC) following a career in acute-care hospital and ambulatory operations with a large academic medical center. My previous focus was on patient throughput strategies, EHR optimization, telemedicine implementation, value-based care, and lean deployment throughout our organization.

I recently joined the Outreach team with National Investment Center (NIC) following a career in acute-care hospital and ambulatory operations with a large academic medical center. My previous focus was on patient throughput strategies, EHR optimization, telemedicine implementation, value-based care, and lean deployment throughout our organization. I join NIC in the hope of bringing a perspective on how hospitals and health systems can collaborate with the senior housing and skilled nursing sector to increase value, improve care, and ultimately provide a better patient experience. With the implementation of CMS’ Patient Driven Payment Model (PDPM), I am also able to serve as an expert in industry transition to quality-based reimbursement.

As senior housing becomes further ingrained in the care continuum, I believe that we can meet the needs of all seniors, but to do so will require skillful cooperation and coordination among all who play a role. I hope to bring a unique viewpoint to our team and share many of the valuable lessons I learned throughout my tenure in hospital administration. It is in that vein that I share my first post, one that focuses on employment retention and workforce engagement strategies.

Retaining an engaged workforce is a cornerstone of long-term business success but doing so is not always an easy task. Generational preferences and rising wages across the country mean managing labor and its associated costs is a growing concern for all businesses. According to NSI Nursing Solutions’ “2019 National Health Care Retention and RN Staffing Report,” the average cost of turnover for a bedside nurse is anywhere from $40,300 to $64,000. It’s also widely recognized that turnover often leads to declines in safety, quality, and experience. Strategies designed to establish consistent labor pipelines and enhance the quality of staff may help mitigate these challenges. While some of the strategies discussed below in this commentary are specific to healthcare, others can be utilized in any setting. As is often the case, these strategies will require an upfront cost, but with a successful implementation, that cost can be recouped over time as employee turnover, recruitment, onboarding, and training costs greatly outweigh the initial investments.

Attract and Develop Talent Using Residencies & Training Programs

Getting new staff in the door is one of the biggest challenges currently facing health systems. With experienced clinicians commanding increasingly high salaries and generous benefit packages, attracting an early-career talent pool which can be trained to the standards and practices of a specific facility is a winning strategy. Traditional physician residencies have been around for more than a decade, but increasingly residencies and training programs are being made available for a wide variety of clinicians, including Nurse Practitioners, Physicians Assistants, Registered Nurses, Certified Nursing Assistants, and Clinical Technicians.

Residencies can provide a win-win for both the organizations seeking staffing and the employees looking to grow professionally. Access to training in a real-world care setting, the expertise of physicians, and continuing education opportunities can set up an organization with a pipeline to deliver quality clinicians at a more affordable cost. Graduates of these programs are better trained, and therefore better equipped to find employment, but they also establish roots during training. These roots–relationships, routines, and familiarity–often lead to a high retention rate following graduation from the program. It can be rewarding to train the next generation of quality clinicians, but for employers the ultimate goal is securing access to a deep pool of skilled talent.

Create Growth Opportunities for Long-Term Retention

All employers would like their employees to feel a sense of accomplishment in their work. However, employers often seem to fail their employees when it comes to the intrinsic satisfaction they feel. Senior staff with organization-specific expertise can grow frustrated when their organization adds new staff with the same titles and job descriptions they earned over years of service, for example. Even happy employees look for better opportunities, and often these employees are the ones that organizations most want to retain. Employers cannot overlook giving their employees a reason–beyond a paycheck–to stay with the organization.

Career ladders can both reward senior staff for years of service and allow for recognition of skillsets with additional compensation. Procedural skills, certifications, and the ability to staff various care areas should be built-in prerequisites in an organization’s career ladder. With careful design, the career ladder is a powerful tool, enabling organizations to encourage retention, raise average experience levels, and incentivize ongoing professional development.

Invest in Training for Organizational Success

Another often overlooked retention incentive is to invest in training and ongoing development. This strategy requires upfront investment, but can yield improved billing and reimbursement, as well as improved patient care. Take the recent implementation of CMS’ Patient Driven Payment Model (PDPM) and the impact it has on mental health treatment as an example. Only about 5% of nursing home residents have a diagnosis of depression, but academic studies indicate the prevalence is closer to 40%. The disconnect in depression identification in this population can partly be attributed to the differences between overburdened frontline caregivers with multiple pressing demands and the highly-focused nurse teams that conduct studies specifically for academia. Another contributing factor is that the methodology of identifying depression, the Patient Health Questionnaire (PHQ-9), relies on self-reporting that can be distorted by the respondent’s perception of the situation.

With PDPM, however, operators are rewarded for treating each resident’s specific needs, with payments increasing in line with patient acuity. This incentivizes depression identification and documentation, as payment boosts can bring in additional reimbursement income. Offering frontline staff training and education on how to identify and treat depression yields benefits in terms of staff satisfaction–and also improves resident outcomes, and a facility’s bottom line.

Avoid Single-Site Employment Models

Absences and call-outs are a reality facing any organization. Those absences are typically resolved using on-call staff or bringing in an unscheduled employee at a premium rate of pay. For employers with multiple sites in a specific region, creating an employment vehicle that allows for flexibility with regards to daily work location can be a strategy to avoid costly premium wages that are often used to fill holes in schedules. Additional incentive payments made to employees willing to work at multiple sites can be recovered by avoiding the costly alternative of overtime or on-call pay. Navigating Human Resources’ hurdles is the most challenging aspect of this strategy, as titles, benefits, and job responsibilities often vary slightly from one site to another. Usually, developing a separate employment intermediary that houses these flex-staff can resolve those challenges.

Amidst accelerating wage growth, persistent workforce shortages, and other labor-related challenges, the pressure to implement creative, evidence-based solutions to prevent shortfalls both in daily staffing and longer-term leadership roles is intensifying. Employing some–or all–of the strategies mentioned here will help organizations better position themselves for greater long-term success.

Groups Partner to Offer Innovative Medicare Advantage Plans

As providers grapple with how to best care for frail elders, a new model of collaboration is being launched that could serve as a national template for the integration of housing and healthcare. Ten senior living and care organizations in the Twin Cities will offer a new Medicare Advantage plan to their residents effective January […]

As providers grapple with how to best care for frail elders, a new model of collaboration is being launched that could serve as a national template for the integration of housing and healthcare.

Ten senior living and care organizations in the Twin Cities will offer a new Medicare Advantage plan to their residents effective January 1, 2020. It is thought to be the largest roll-out of such a plan to date.

The plan is an institutional special needs plan (I-SNP). These Medicare Advantage plans are designed to meet the often complex needs of adults living in long-term care, assisted living and memory care settings. Enrollment is restricted to eligible individuals who, for 90 days or longer, are expected to need the level of services provided by a long-term care facility.

Medica Advantage Solution PartnerCare is the name of the plan being offered through a unique collaboration  between Genevive, a geriatric medical and care management organization, the nonprofit health plan Medica, and the senior living providers. They operate 78 Twin Cities-area long-term care and assisted living communities.

The senior living communities are operated by Benedictine Health System; Cassia (Augustana Care/ELIM Care affiliation); Catholic Eldercare; Episcopal Homes of Minnesota; Goodman Group; North Cities Health Care, Saint Therese; Volunteers of America; Walker Methodist; and Presbyterian Homes & Services (PHS).

“The goal is to provide an integrated care delivery system for the residents we serve,” said Dan Lindh, president of PHS, the largest senior living provider in the PartnerCare plan. “We believe this model of care will improve quality outcomes.”

Enrolled residents will receive a holistic model of care delivered by Genevive through a multidisciplinary team with expertise in providing care to people with complex conditions. The team includes physicians, nurse practitioners, care coordinator, specialists, a pharmacy consultant, anticoagulation team and ancillary service providers, all connected to care teams at the individuals’ long-term care or assisted living facility.

A new model of health insurance and housing

The broader I-SNP program is based on both a clinical and financial model. The clinical focus is on delivering the right care at the right time, and where the resident lives. Early intervention and care coordination are important components, along with strong referral networks to appropriate healthcare providers and the use of electronic medical records so all providers have the most accurate and up-to-date information on the individual. This approach can produce better health outcomes and reduce costs. The I-SNP, which is paid a set amount each month to care for an individual, takes on the financial risk of insuring the resident.

Lindh expects 600 individuals to sign up for PartnerCare in the first year. In two years, he projects an enrollment of 3,000.

Though I-SNPs represent a small part of the Medicare Advantage market, they are growing in popularity. Overall enrollment in I-SNPs grew from 74,000 in 2018 to 87,000 in 2019, according to the Medicare Payment Advisory Commission (MedPAC). The number of plans rose from 97 to 125.

PHS, which serves 27,000 seniors annually, has taken a step-by-step approach into the world of managed care and I-SNPs. Last year, PHS bought a 50% interest in Genevive, a mobile primary care practice which it co-owns with Allina Health.

A believer in treating residents where they live, Lindh said his organization already had doctors and nurse practitioners on staff to treat residents before the I-SNP was formed. The partnership with Genevive expanded the pool of doctors and nurse practitioners available to residents. “You have to scale up,” said Lindh, remarking on the ingredients needed to create a successful I-SNP.

Geography plays a role too. I-SNPs work best in a tight geographic area, said Lindh. The organizations in the PartnerCare program have big footprints in the Twin Cities area. That way medical practitioners can visit and treat patients effectively and efficiently without wasting hours traveling to locations outside of the primary service area.

Lindh does not expect to expand PartnerCare beyond the Twin Cities.

Buy or build expertise?

Though launching an I-SNP such as PartnerCare is a complex undertaking, Lindh noted that it helps to have previous managed care experience.

Last year, PHS introduced a special Medicare Advantage plan (D-SNP) in partnership with Medica. Genevive was already operating D-SNP plans in partnership with Medica, UCare and Blue Cross Blue Shield. These plans are targeted to individuals dually eligible for Medicaid and Medicare at 14 PHS communities. About 3,500 individuals are covered in these D-SNP plans.

The D-SNP has given PHS experience in risk sharing—an important concept in the evolution of managed care where providers receive a fixed amount to provide healthcare for an individual. The D-SNP receives an average of $3,500 a month for the treatment of each individual in the plan.

“It’s working well,” said Lindh. While the margins move up and down, he estimates they will average about 5%-8% annually. Margin, however, is less important than improving overall quality of care.

PartnerCare payments will be about $2,000 per member, per month. That number is based on what the average adult with the same diagnosis would pay on their own in the wider community. Care coordination and management of services creates the dynamics that make risk sharing work, noted Lindh. Also, Reinsurance covers the cost of catastrophic claims.

What’s the best approach for providers new to the world of managed care and I-SNPs? The choice is to slowly build expertise internally, or to purchase the expertise from outside experts. “The magic is in collaboration,” said Lindh.

Where and How Do Boomers Want to Live  As They Age?

As we age, where will we want to live? And how will we want to live? It’s a decision that faces many of us today, either directly for ourselves or indirectly for our elderly parents.

As we age, where will we want to live?  And as importantly, how will we want to live? It’s a decision that faces many of us today, either directly for ourselves or indirectly for our elderly parents.

In a recent front-page Wall Street Journal article, Peter Grant drew attention to and rightfully addressed this question, as nearly 13 million older Americans face this decision today and as the massive wave of 72 million baby boomers born between 1946 and 1964 gradually approach the time where post-retirement lifestyle choices will once again need to be made.Many baby boomers will prefer to age at home, with technology helping to enable this choice. But many will also prefer to age in community with opportunities for companionship, friendship, engagement, involvement, socialization and easy-to-access meals, healthcare, assistance with day-to-day living activities, safety and security. Cognitive impairment, mobility limitations, multiple chronic conditions and functional restrictions may also cause older households to leave their homes for additional care. 

Today there are an estimated 1.6 million units of seniors housing in the United States—which equates to roughly 18% of households over the age of 80. Our recent analysis suggests that by 2030, 2.5 million units will be needed if that penetration and utilization rate of 18% of households over age 80 remains steady in the coming years. For seniors housing operators, this suggests that hundreds of thousands of new units will be needed to satisfy this demand. Even if the utilization rate were to fall below today’s 18%, additional inventory will be needed.

It’s evident that the baby boomers have never acted like their parents and always pave a new way forward. And, it’s likely that new forms of living patterns will emerge. Many of America’s elders will remain in their family homes, many will live in traditional seniors living properties, some will live in an evolving form of seniors living housing that is still emerging, some will live in co-operative living arrangements similar to how they lived during the 1960s, some will live intergenerationally with younger individuals who can help defray costs or help with household chores and maintenance, and some will live in choice-based group homes with their friends like the Golden Girls sitcom. The truth is that the sheer size of this burgeoning cohort will support many living preferences—home or in community. 

The ability for elderly baby boomers to remain at home and continue with support from family will be less likely than today as another recent NIC study showed that 48% of individuals age 75 and over will be divorced in 2029 compared with 39% today. Either due to widowhood or divorce, many will simply not have partners/spouses to care for them. Moreover, the sheer demographics of America are quickly changing the caregiver support ratio which will fall from seven adult children aged 45 to 64 to care for one parent over 80 years old today to four-to-one in 2030 and three-to-one in 2050. Additionally, fewer adult children will live in proximity to their parents.

Hence, the desire to live at home may not always be matched by the ability to do so. At the same time, the desire to live in a group setting may not always be matched by the financial ability to do so. As we consider the aging of our population, we need to think about what America’s elders can afford in terms of their care and housing choices. For example, NIC’s study on the Forgotten Middle, published in May 2019 in the public policy journal Health Affairs, showed that 46% of 75-plus middle-income households will not have sufficient financial resources to live in today’s senior housing.

With a spotlight now shining on the issues of choice, desire and affordability of care and housing options, we can collectively consider what public and private sector solutions exist today and what needs to be re-imagined, designed and created. It’s an opportunity for public/private partnerships, as well as for private sector solutions and innovative and creative public policies.