The following analysis examines broader occupancy trends, year-over-year changes in inventory, and same-store asking rent growth – by care segment – within 1,038 Continuing Care Retirement Communities (CCRCs) and 13,708 non-CCRCs in the 99 NIC MAP Primary and Secondary Markets.
1Q 2026 Market Fundamentals by Care Segment – CCRC (All) vs. Non-CCRC
The exhibit below compares the market performance of CCRCs and non-CCRCs by care segment for the first quarter of 2026, highlighting year-over-year changes in occupancy, inventory, and asking rent growth.
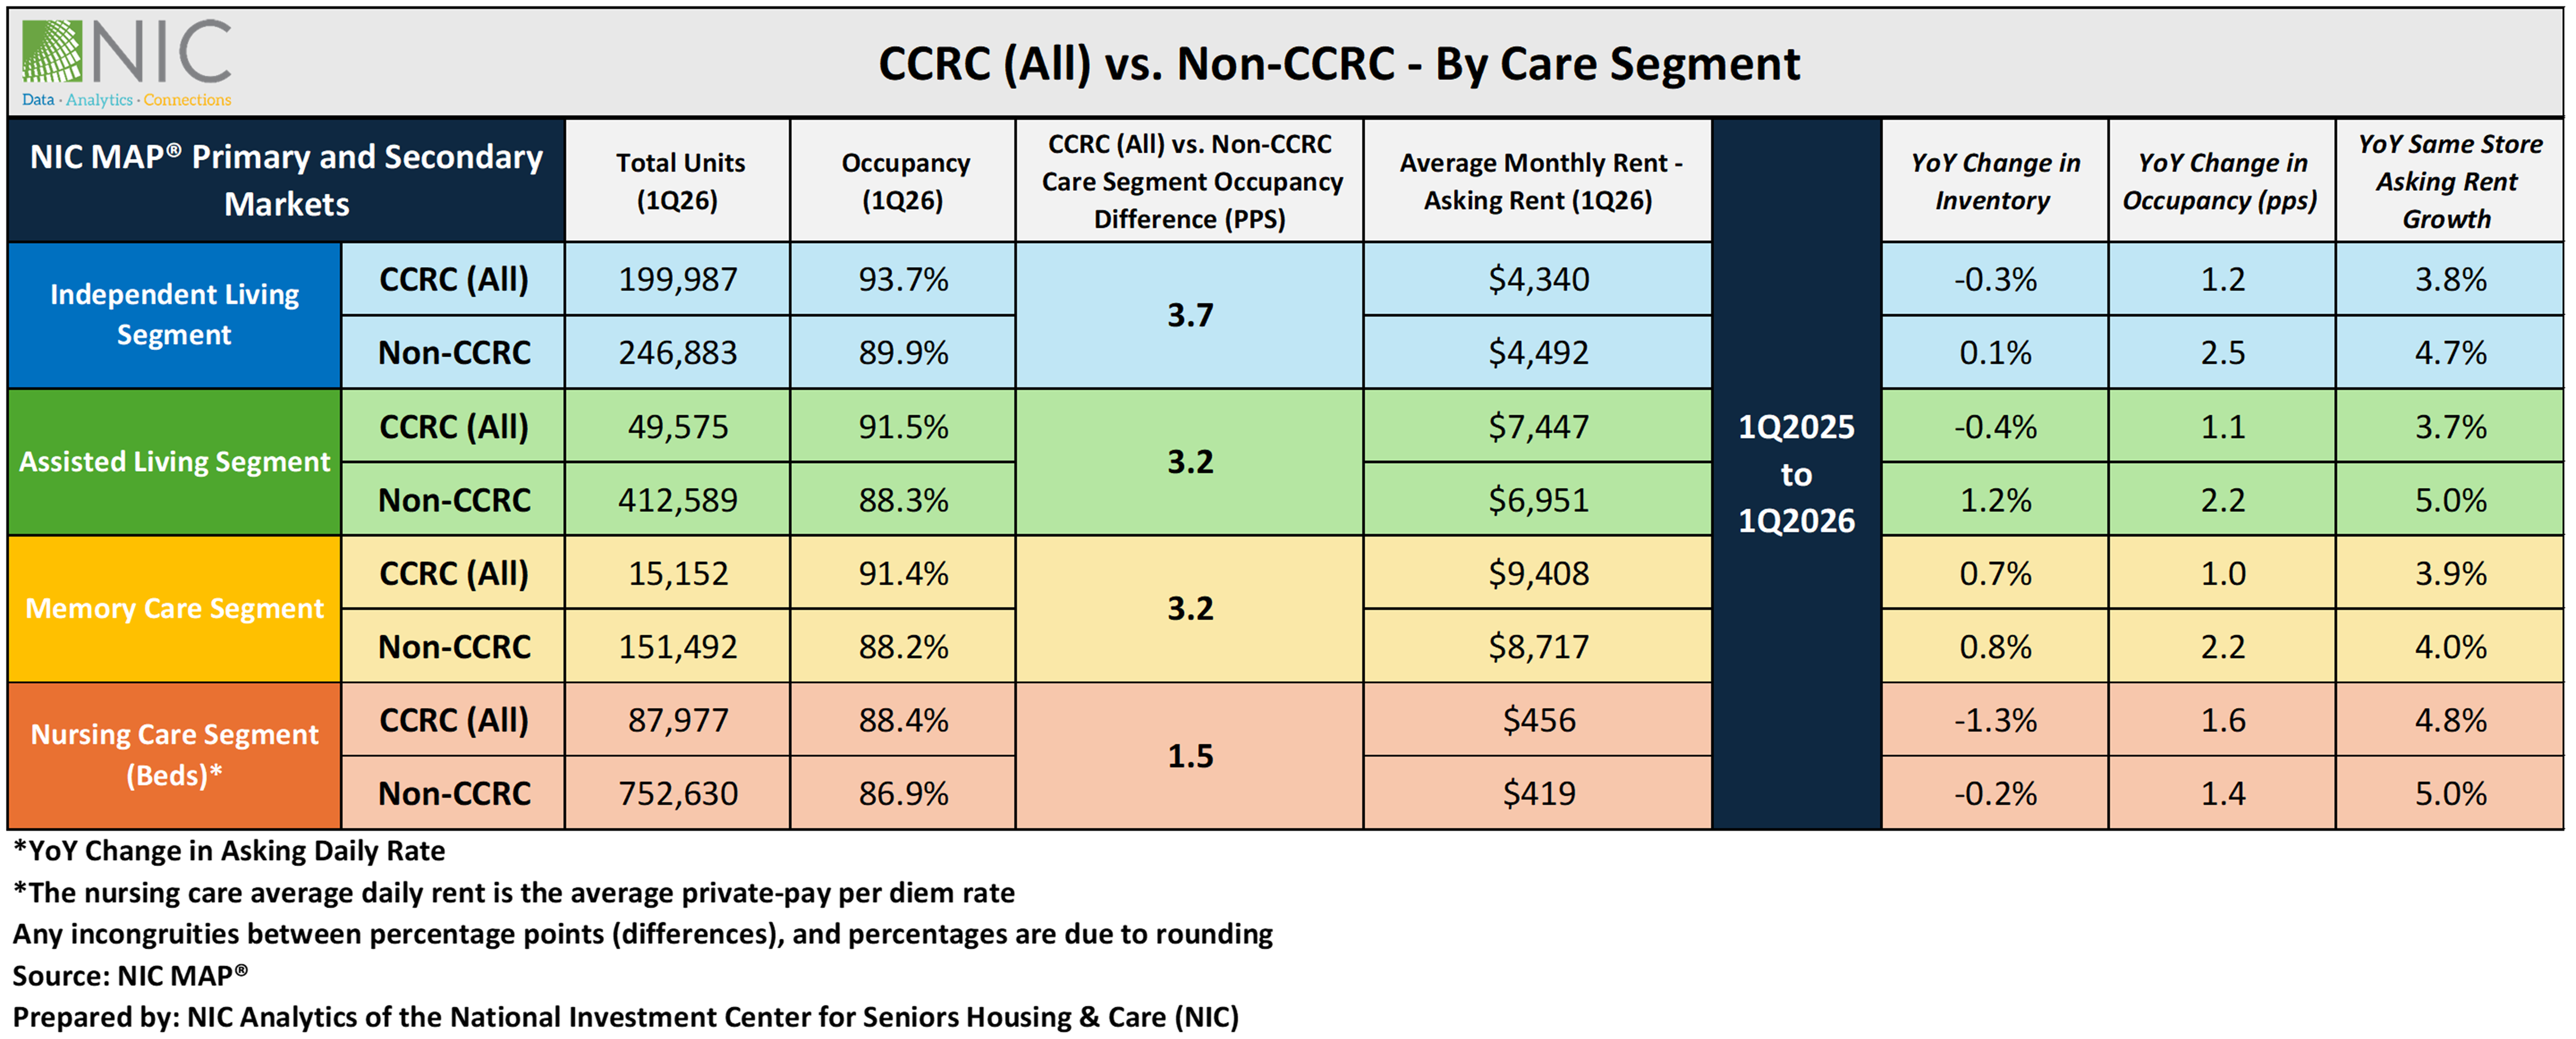
Occupancy. Consistent with prior quarterly results, CCRCs continued to outpace non-CCRCs in occupancy rates across all care segments. The largest occupancy difference between CCRCs and their non-CCRC counterparts in the first quarter of 2026 was in the independent living segment (3.7pps), with the smallest gap in the nursing care segment (1.5pps). The independent living segment recorded the highest occupancy rate among both CCRCs (93.7%) and non-CCRCs (89.9%).
Non-CCRCs recorded higher year-over-year occupancy changes in all care segments except for the nursing care segment, with independent living recording the highest change from the past year (2.5pps). While CCRCs overall have higher occupancy, the occupancy growth has been slower compared to non-CCRC communities.
Asking Rent. The average monthly asking rent (in dollars) for CCRCs continues to be higher than that of non-CCRCs across all care segments except for the independent living segment. Non-CCRCs experienced stronger year-over-year rent growth in all care segments with assisted living and nursing care segments showing the highest growth (5.0%).
Note that these figures represent asking rates and do not reflect any discounts that may be applied. The nursing care average daily rent is the average private pay per diem rate.
Inventory. Compared to the level a year ago, nursing care inventory declined in both CCRCs (1.3%) and non-CCRCs (0.2%), the largest drops among the care segments. Among CCRCs, positive inventory growth was seen in the memory care segment (0.7%), while assisted living and independent living edged down slightly by 0.4% and 0.3 respectively.
For non-CCRCs, the strongest year-over-year inventory growth was recorded in assisted living (1.2%) and memory care (0.8%) segments, while nursing care declined.
Negative inventory growth can occur when units or beds are temporarily or permanently taken offline or converted to another care segment, offsetting any newly added supply.
Every Region Delivered Year-over-Year Occupancy Gains in 1Q 2026 Across Both Entrance Fee and Rental CCRCs
In the first quarter of 2026, entrance fee CCRCs continued to outperform rental CCRCs in occupancy rates across all regions, with every region posting year-over-year gains compared to the first quarter of 2025. The Mid-Atlantic region led with the highest entrance fee occupancy at 94.3%, followed closely by the Northeast at 94.0% and the Pacific at 93.9%. Meanwhile, the Southwest region (89.5%) recorded the lowest, although still up 0.7 percentage points (pps) from a year earlier. The West North Central region posted the largest year-over-year gain among entrance fee CCRCs at 3.5pps, climbing from 88.8% to 92.3%, followed by the Pacific (2.7pps) and the Mountain regions (2.1pps).
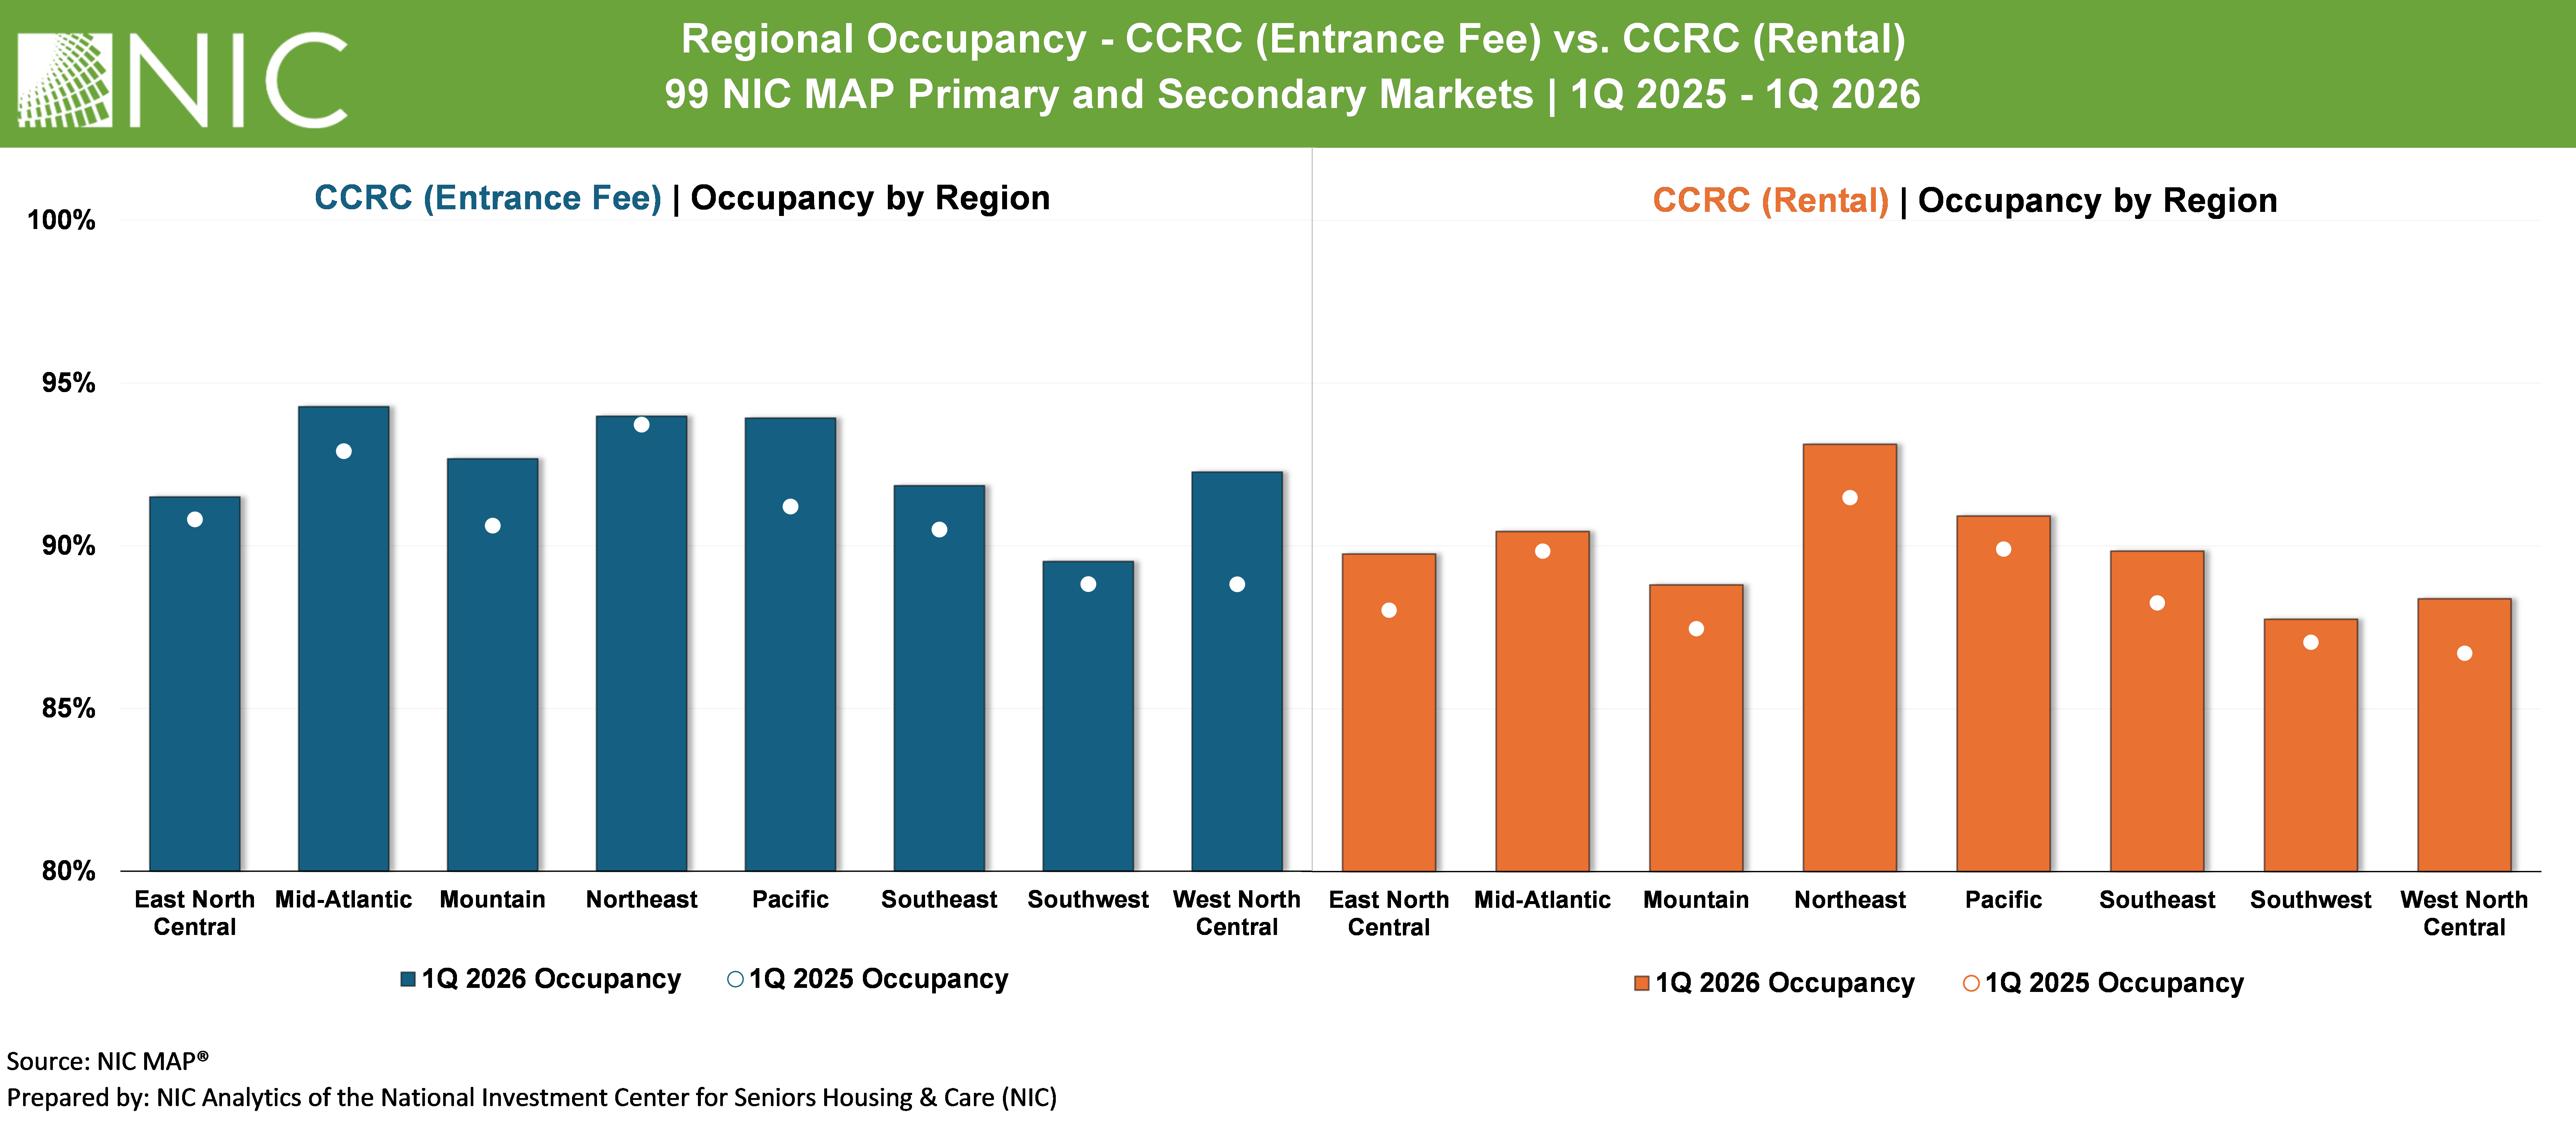
For Rental CCRCs, the Northeast region recorded the highest occupancy at 93.1%, an increase of 1.6pps from the first quarter of 2025, while the Southwest reported the lowest at 87.8%. The East North Central region posted the strongest year-over-year improvement at 1.8pps, rising from 88.0% to 89.8%, with the West North Central (+1.7pps) and Northeast regions (+1.6pps) close behind.
Look for future articles from NIC to delve into the performance of CCRCs.