Buyer Activity Strong in 3Q as Pricing Picks Up

U.S. seniors housing and care transactions market saw a slight drop in dollar volume in the 3Q 2019 from 2Q quarter. However, measured by the number of transactions closed year-to-date 2019, the market seems to be very active on a relative basis.

The U.S. seniors housing and care transactions market saw a slight drop in dollar volume in the third quarter of 2019 from the previous quarter. However, measured by the number of transactions closed year-to-date in 2019, the market seems to be very active on a relative basis. Judging by interest from investors, especially from the private buyers (discussed further below), this trend is likely to continue in the short-term barring any liquidity or economic shocks.

When comparing the number of transactions closed, the first three quarters of 2018 lagged that of the same period in 2019, with 391 and 441 transactions closed, respectively. That represents a 13% increase year-over-year. Given that transaction volume is relatively strong, in terms of the number of deals closed, the activity is another testament of the continued plentiful liquidity in the seniors housing and care market. Nearing the close of 2019, we should expect strong activity in the fourth quarter, barring any capital market disruptions, as there is typically a push to close deals that have been in the pipeline before year-end.

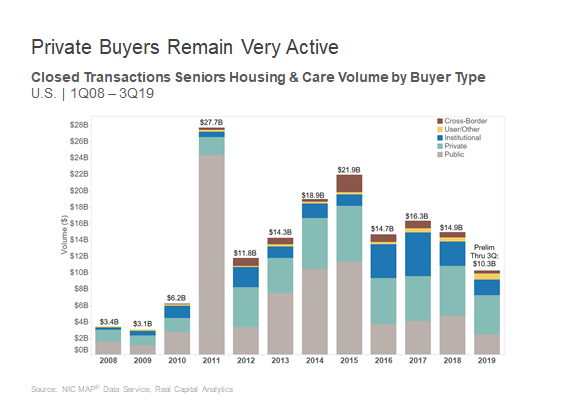
The number of closed transactions in the third quarter alone was 140, up slightly from the third quarter of 2018 when 138 transactions closed. Private buyers are driving this activity, providing a relatively significant amount of liquidity to the market. Private buyers represented $1.6 billion of the $3.2 billion total of closed transactions in the third quarter of 2019,  or 49% of the total volume. This has been a consistent theme throughout 2019 as private buyers have represented 47% of volume through the third quarter 2019, registering $4.8 billion of the $10.3 billion closed so far in 2019. The consistency has been notable as the private buyers continue to register over $1 billion in closed transaction volume each quarter with only  one quarter dipping below $1 billion since the third quarter of 2013. More recently, since the beginning of 2016, the first year public buyers started to slow down with their activity, private buyers have averaged $1.5 billion in volume per quarter. This compares to institutional and public buyers which averaged $947 million and $1 billion, respectively.

Public buyers represented $2.5 billion of the $10.3 billion of total dollar volume thus far in 2019, or 25% of total volume. Institutional buyers only represented $1.9 billion of the total dollar volume through the third quarter of 2019. The institutional buyers which include many of the private equity companies that manage institutional funds such as pension and endowment money, have raised lots of capital but anecdotal evidence suggests they are having a hard time putting the capital to work in a meaningful way due to competition and high property prices, in addition to lower expected returns.20191119_Transaction Blog
As activity overall has been strong, so has the price per unit in seniors housing. In fact, the price per unit increased in the third quarter, and interestingly enough, the seniors housing rolling four-quarter price per unit has reached a time-series high going back to 2008. It currently stands at $185,600  per unit, an increase of 10% from the second quarter which had a price per unit of $168,800. The price per unit in the third quarter of 2019 is up 18% from the third quarter of 2018 when it averaged 156,800.   

Nursing care pricing also increased in the third quarter of 2019. It now stands at $78,000 per bed, which represents a 13.5% increase from the prior quarter. The price per bed in the third quarter 2019 is up 7.4% from the third quarter of 2018 when it was $72,600. 

As a closing note, when analyzing this pricing data, it should be  pointed out that some higher priced, or lower priced, outliers can skew the averages. In the third quarter, for example, Riverview SNF Realty LLC bought from Eastern Blvd Real Estate LLC at a price per bed of $140,000, which  represents a much higher price per bed than the rolling four-quarter average. The same holds true for seniors housing. In a third quarter 2019 deal, GFH Financial Group bought from Harbert Management Corp. at a price per unit of more than $300,000, again representing a much higher figure than the average. 
Driving Innovation Through Consumer Insights

Attendees at the 2019 NIC Fall Conference learned about the product development strategy that conceived the successful Swiffer® cleaning tool and the Capital One® banking cafés.

A mop and a café might not sound innovative to most seniors housing operators. But when presented with the product development strategy that conceived the successful Swiffer® cleaning tool and the Capital One® banking cafés, attendees at the 2019 NIC Fall Conference learned that the process for true innovation applies across all industries.

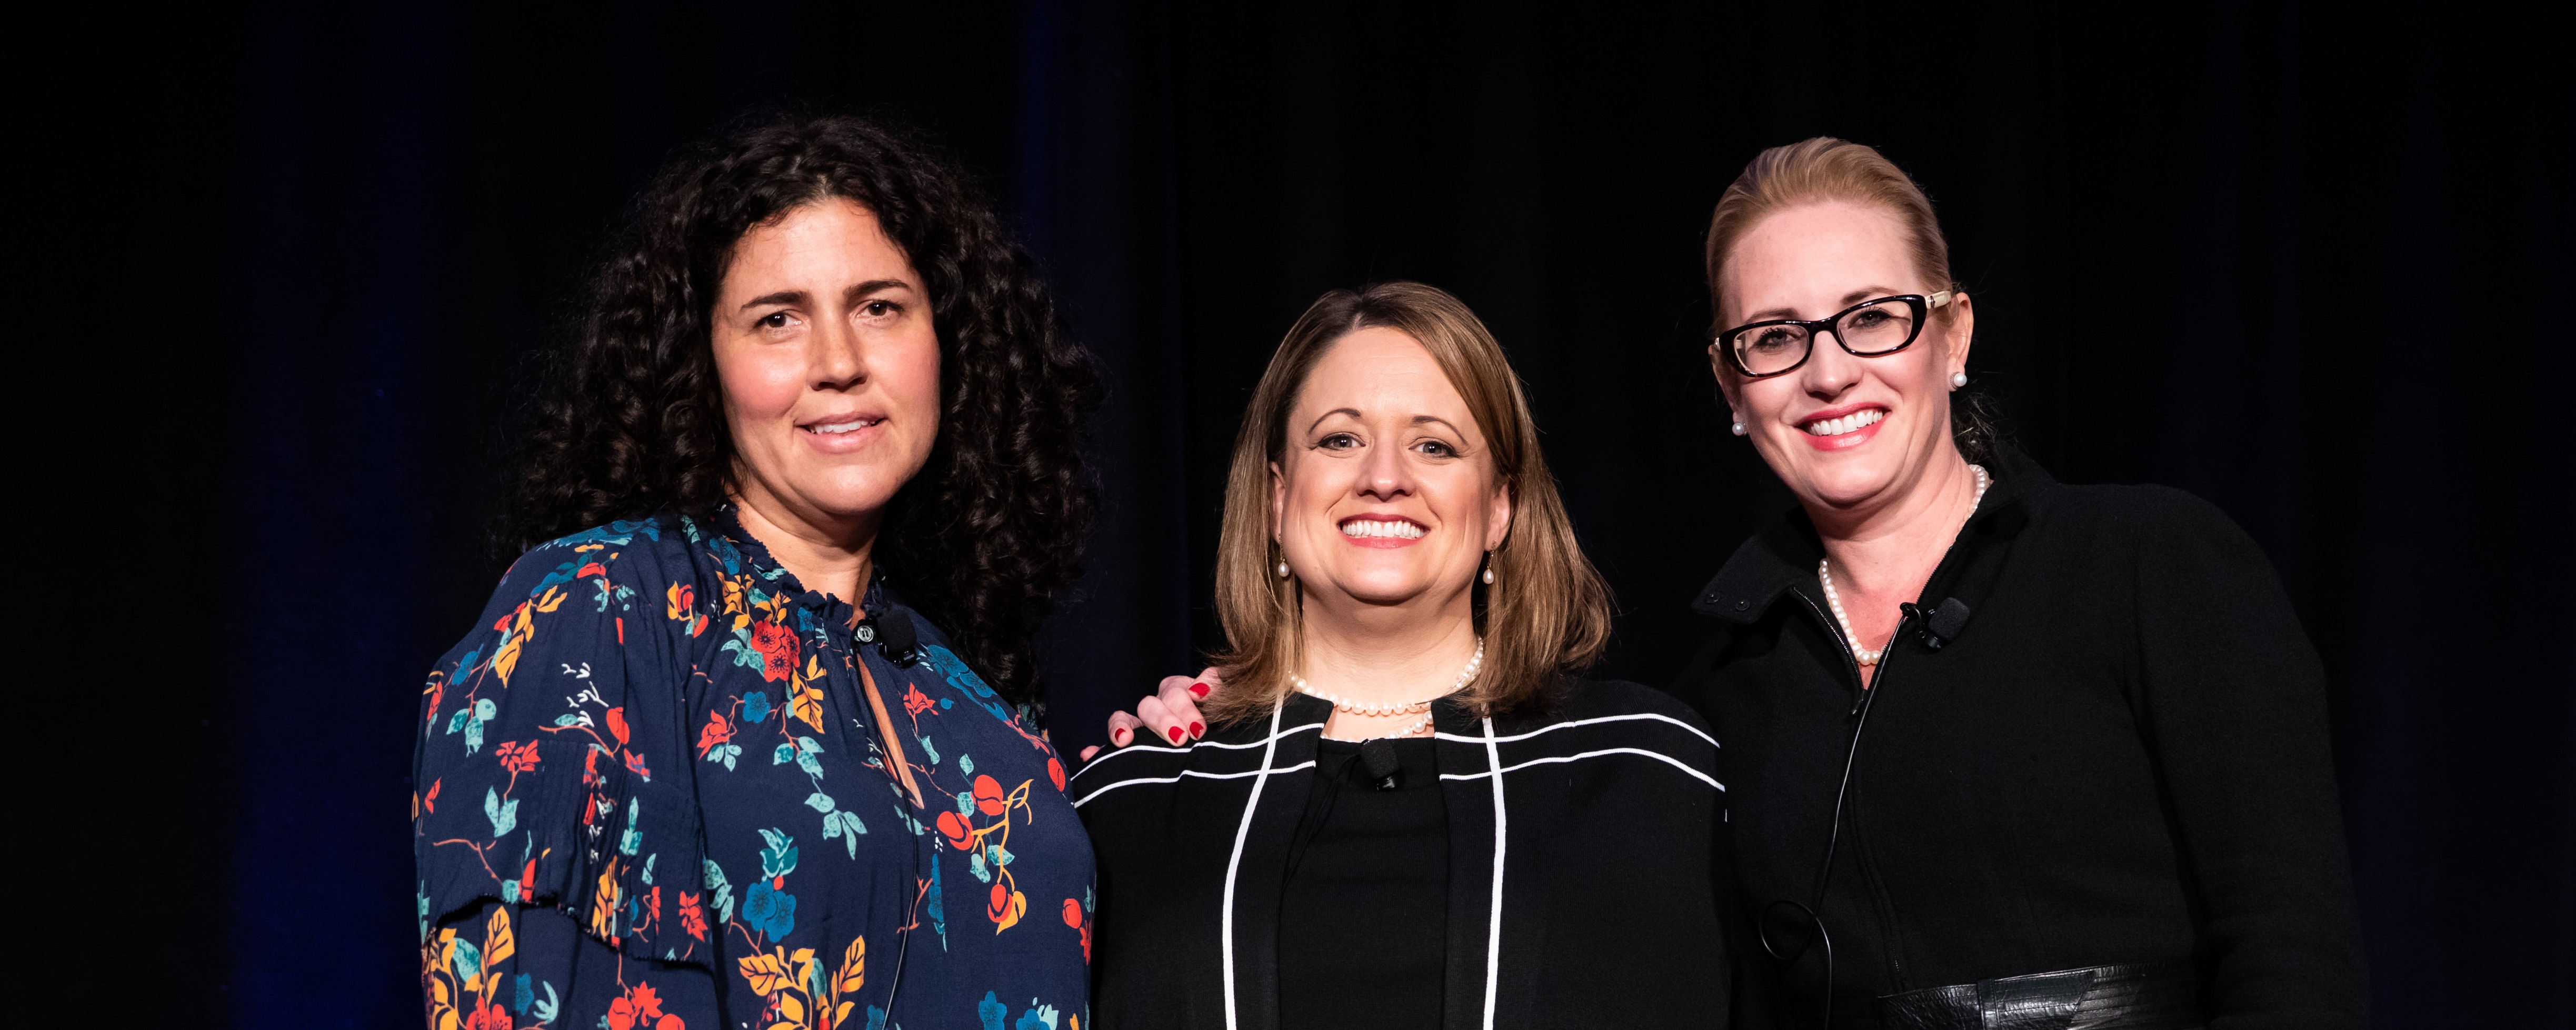
Maria Nadelstumph, vice president of organizational development and program excellence at Brandywine Living, moderated the session “Activating Consumer Insights: Lessons from Other Industries,” while Heather Reavey, head of innovation delivery, EPAM Continuum, and Jennifer Windbeck, managing vice president, market experience, Capital One Cafés and Branches, described the processes used at their companies to generate breakout innovations.

Reavey and Windbeck work in different industries, on very different products, yet the product innovation process they employed to launch the successful Swiffer WetJet™ mop and Capital One Cafés, respectively, involved a common thread—consumer insight. They shared thoughts on how consumer insights can, and should, be used in the seniors housing industry to develop fresh ideas that go beyond iterating current offerings.

Consumer insight research often guides product development in industries like hospitality and consumer products. Yet it is not as prevalent today in seniors housing. While there is consensus that the baby boomer generation desires a different seniors housing experience than their parents have, there is no consensus on what they want. And that’s where innovation comes in. 

Reavey and Windbeck shared the business success achieved at their companies by investing in consumer research as a first step in the product development process. The research allowed them to better anticipate consumer needs, and allowed insights to drive innovative ideas.

According to Reavey, generating ideas is easy. “The real challenge of innovation is getting things out into peoples’ homes,” she said. She advised that the first step in successful product innovation is to define and deeply understand the problem your product will solve. 

“The only way that we really have confidence in our ideas, is if we know the problem that they’re solving. And we feel confident that the problem is really relevant to people. If we can solve that problem, people are going to buy our product instead of the competitive products. It’s going to be differentiated.”

EPAM Continuum, a global innovation, design, and development firm, practices human-centered design. They spend time with people in order to really understand what they care about and what the meaningful challenges are in their lives. In their consumer insight framework, they focus on a person’s emotional side rather than functional needs.

“Usually when people tell us about their functional needs, it will give us clues on how to iterate something that exists today,” noted Reavey. “What we like to focus on is the emotional side, because that’s what drives innovation.”

Reavey used the example of asking a person about a blender. She described how a person will default to talking about their functional needs for a blender—a quieter motor or a blade that is easier to clean, for example. But she maintains that if the conversation starts at a broader level—talking about what the person cares about in life—it may lead to answers that indicate the person cares about preparing healthy food, or even that they don’t want to use a blender at all and prefer to eat out.

“That’s where the innovation comes from. It’s really understanding what your audience cares about in life and not in the category that you’re exploring. Your job is to then connect what they care about in life to your category.”

Windbeck’s experience at Capital One followed a similar process—speaking to consumers about personal preferences.

“We decided to start from scratch in reimagining the in-person banking experience. We threw out everything we ever knew about branch banking,” she said. They started with a “what if” perspective in their consumer research, rather than a focus on what already existed.

Capital One also knew that not every customer would be drawn to the café concept. “We were okay that this would not be the bank for everyone. We were designing for a very specific persona and a very specific behavioral identity group.”

In both cases, the teams at EPAM and Capital One designed successful products that the consumers didn’t necessarily know they wanted.

Reavey suggested that to apply these methods in seniors housing, companies should start by speaking to consumers who aren’t involved with seniors housing now. We should talk to potential future users, with no preconceived ideas. She noted that employees can provide thoughtful insights as well.

The panelists then offered advice on the potential time and expense involved with consumer insight research. “When you think about things like innovation and user experience, it can feel a little bit fluffy. That’s not the case here. We are doing [this] to differentiate ourselves from competitors,” said Windbeck. “We are a for-profit company and so we are doing this in order to drive profits.”

Reavey also noted that there are ways to innovate without huge expense, “Sometimes we make innovation much bigger in our heads than it needs to be. We think that it’s going to take years and we’re going to need millions of dollars in investment. You can do a lot of iteration really fast and cheap just by being creative about figuring out how to fake it before you make it.”

She applied that thinking to seniors housing and suggested that instead of believing you need to innovate a whole complex or building, start with a pamphlet and get feedback on your ideas on that scale. Windbeck also suggested allowing workforce teams to go beyond surfacing ideas, and give them parameters within which they can innovate and test ideas on site.

“Do inexpensive, quick prototyping and use data and hard results to be able to say, ‘Here’s what we tried, here’s how it worked. Here’s what this could look like at scale’,” advised Reavey.

Nadelstumph closed the session by reminding attendees of the value of innovation in seniors housing, “There’s a lot of opportunity here. So let’s stop building on best practices and let’s get a little bit more creative to drive the business.”

Current Occupancy Performance Patterns of Older Seniors Housing Markets May Surprise You

This commentary dives into the NIC MAP® data for the 31 Primary Markets to explore potential relationships between seniors housing age and occupancy by geography.

Seniors housing properties are aging, and senior consumer tastes are changing. Strong inventory growth in recent years has brought to market new competition for existing buildings—most built prior to the Great Recession. Which markets have the oldest and newest seniors housing stock? Is there a “sweet spot” in terms of building age and occupancy performance? And, what are some of the factors that contribute to strong occupancy in older buildings? To provide food for thought and possible answers to these questions, this commentary dives into the NIC MAP® data for the 31 Primary Markets to explore potential relationships between age and occupancy by geography.[1]

Which markets have the oldest seniors housing properties?

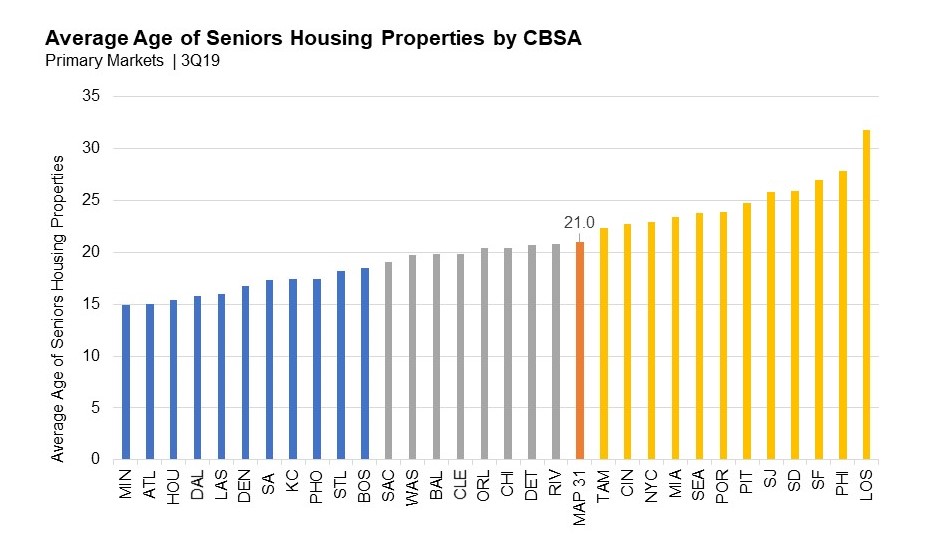
The chart below ranks the average age of seniors housing properties by geography for the 31 Primary Markets as of the third quarter of 2019. The youngest markets, as measured by the average age of the properties in the CBSA, are indicated by blue bars (Minneapolis to Boston), and the oldest are indicated by gold bars (Los Angeles to Tampa).Average age of seniors housing by CBSA

Source: NIC MAP® Data Service

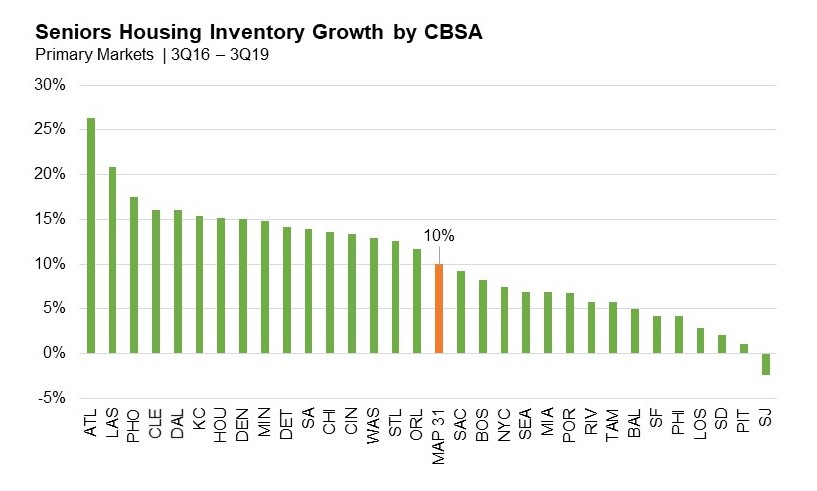
In the third quarter, the average age of seniors housing properties in the Primary Markets (denoted by the orange bar) was 21 years old. Minneapolis, Atlanta and Houston had the lowest average age (15 years). Not surprisingly, the markets with the youngest properties also had the most recent inventory growth. Indeed, of the eleven markets with the lowest average age, nine had net inventory growth of 15% or more over the past three years. Two of these markets, Atlanta and Las Vegas, had net inventory growth of 26% and 21%, respectively. This compares with 10% for the Primary Markets.

Los Angeles had the oldest seniors housing properties (averaging 32 years old), followed by Philadelphia, San Francisco, San Diego, San Jose and Pittsburgh (ranging from an average of 28 years to 25 years old). Older markets reported lower rates of net inventory growth, and each of these markets saw growth of 4% or less over the past three years.Slide1-1

Source: NIC MAP® Data Service

Is there a relationship between a market’s average property age and occupancy?

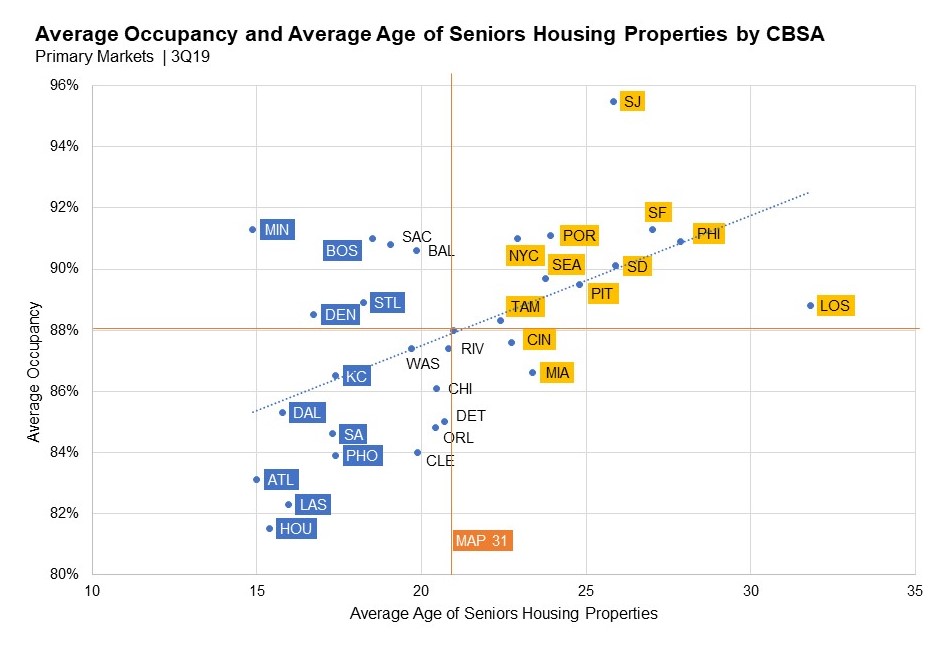
Conventional wisdom suggests that senior living consumers are attracted to move into new construction with fresh finishes and amenities, and contemporary design. But are these assumptions consistent with the data? The chart below explores the relationship between the average occupancy of seniors housing properties and average age by geography. The Primary Market average age for seniors housing properties was 21 years old as of the third quarter of 2019, and the overall average occupancy rate was 88.0%. The youngest eleven markets are shown to the left of the Primary Market average, and the oldest twelve are shown to the right.Slide1-2

Source: NIC MAP® Data Service

Contrary to a prevailing assumption that newer properties should garner higher occupancy rates than older properties, there is a notable link between older average age and higher average occupancy—in fact, some of the oldest markets—including San Jose, San Francisco, Portland, New York City, and Philadelphia—had among the highest average seniors housing occupancy rates across the Primary Markets. Compared to markets with newer properties, which showed a weaker connection between average age and average occupancy, older markets had higher than average stabilized occupancy, lower than average rates of annual net absorption (i.e., less change in occupied stock), and lower than average rates of annual net inventory growth.

Is there an occupancy “Sweet Spot?”

Seniors housing has weathered an acceleration of inventory growth over the past several years, which has put downward pressure on occupancy in many metropolitan areas. But, do seniors housing buildings have a “sweet spot” in terms of occupancy performance?

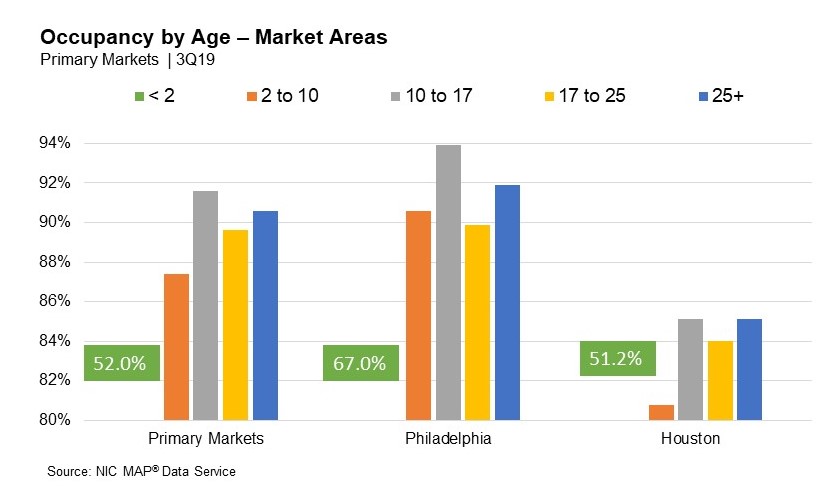
Across the 31 Primary Markets, nineteen reported the highest average occupancy in the 10- to 17-year age grouping, and five in the 25-years or more age grouping. The chart below displays the average seniors housing “all” occupancy rate by age group in the third quarter for the Primary Markets in aggregate, Philadelphia—which exemplifies an older market with above-average occupancy—and Houston, which exemplifies a younger market with below-average occupancy.

As illustrated, in all three instances, the 10- to 17-year age grouping, followed by properties over 25 years old, outperformed the other age groupings in terms of average occupancy. For the Primary Markets, those occupancy rates were 91.6% and 90.6%, respectively. For Philadelphia, those occupancy rates were 93.9% and 91.9%, and for Houston, 85.1% and 85.1%.Slide1-3

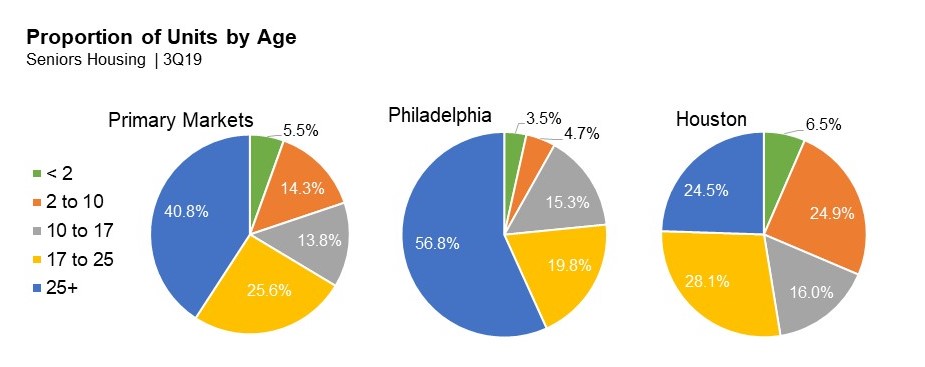
Considering the proportion of units by age for each of the three examples, Philadelphia’s overall occupancy rate (90.9%) was buoyed by properties between 10 to 17 and 25+ years old, which represented just under three-quarters of all existing units. Houston’s overall occupancy rate (81.5%), on the other hand, was dragged down by properties less than 10 years old, which represented nearly a third of all existing units.Proportion of Units 11132019

Source: NIC MAP® Data Service

Why does it appear that the “sweet spot” for building occupancy is in the 10- to 17-year age range? Is it possible that by this time in a property’s life, operators had built strong reputations in and around the neighborhoods they serve? Had they mastered staffing and other operational efficiencies translating into high levels of resident satisfaction that augment word-of-mouth marketing power? Or had they perhaps begun to spend earmarked maintenance and revenue-enhancing capital expenditure dollars to improve, refurbish, or reposition units or common spaces within buildings for higher and better use—all of which may allow them to build or maintain market share, and effectively compete with the latest offerings?

As the NIC MAP data indicate, on one hand, markets with the youngest seniors housing stock generally had seen recent, and in some instances ongoing, high levels of inventory growth, coupled with lower average occupancy rates, and greater competition resulting from supply and demand imbalances. On the other hand, markets with older seniors housing stock generally had maintained strong occupancy rates, in part due to barriers to entry keeping inventory growth in check, and higher levels of stabilized occupancy.

In analyzing the 31 Primary Markets, the NIC MAP data revealed that the strongest average occupancy performance was most frequently seen in the 10- to 17-year age range. Possible reasons for higher average occupancy among older properties are multi-faceted and market specific. As seniors housing properties age, the capex burden naturally increases, and industry data suggest that capital expenditures begin to accelerate around year 10 of a building life. It is possible that capital expenditures for refreshing an older property may be encouraged by new supply, and sustained expenditures may allow an older property to boost or maintain its occupancy for many years. Unspent or unwisely spent capex could result in diminished returns, so it is important for operators to appropriately time and budget expenditures based on their unique market conditions.


[1] Note that the property age data tracked by NIC is based on the date in which the building was originally opened. That said, if a building was torn down and subsequently rebuilt, the property’s age would reflect the new building open date. However, the age of a property is not adjusted for expansions or repositioned units, which are considered part of the original building.

###

Home Health: Is It Better to Own or Partner?

No matter where they live, most seniors prefer to age in place. But as they do, they also typically need more services. These can include assistance with the activities of daily living as well as health services. But what’s the best way to deliver those ancillary services in a seniors housing or skilled nursing setting? […]

No matter where they live, most seniors prefer to age in place. But as they do, they also typically need more services. These can include assistance with the activities of daily living as well as health services.

But what’s the best way to deliver those ancillary services in a seniors housing or skilled nursing setting?

Effective home care and home health strategies were discussed recently at a well-attended session at the 2019 NIC Fall Conference in Chicago. A panel of experts took a deep dive into the pros and cons of outsourcing the services or taking them in-house.

“Seniors housing and care operators need a strategy,” said panel moderator Joel Nelson, president and CEO at Life Care Services (LCS).

The panelists agreed that an effective strategy can help boost resident satisfaction and also extend length of stay. Residents who can get the help they need where they live are less likely to move. They’re more satisfied, and so are their families.

The difference between home care and home health was defined. Home care consists of help with activities of daily living (ADLs). Home health is typically a Medicare-certified and reimbursed service, such as physical therapy or nursing care.

Several macro trends are impacting the home care and home health markets. The Centers for Medicare and Medicaid Services (CMS) is moving toward value-based care, seeking the best health outcomes in the lowest cost settings. More healthcare is being delivered at home. Also, CMS is allowing some payors to offer home care services. “That creates opportunity,” said Cheri Greenfield, senior vice president, Home Care Operations, Humana.

A 2018 study by Humana showed that the next generation of seniors will have less social support because of smaller and fragmented families, and more elders will live with chronic conditions. “We need to invest in the right services,” said Greenfield.

New Rules Disrupt Home Health

A big change takes effect January 1, 2020, that will impact the home health landscape. The new system—Patient Driven Groupings Model (PDGM)—changes reimbursements from per visit payments to ones based on value.

“The change will push mom-and-pop home health agencies out of the business,” predicted panelist Paul Kusserow, president and CEO, Amedisys, a large home care and home health services provider. He estimated that of the 12,500 home health agencies in the country about a third will have trouble surviving the change in the payments system.

Kusserow views the situation as an opportunity to purchase home health agencies and grow Amedisys. He noted that seniors housing operators might also consider jumping into the home health business, though a partnership with an established company might make more sense because of the complexity of the business.

Panelist Todd Kaestner agreed. “Home health is a technical and complex business,” said Kaestner, executive vice president, corporate development, Brookdale Senior Living. The company offers home healthcare in about 70% of its 800-plus communities. Home care services are available in 100 locations.

LCS launched a home health business in 1985 but several years ago decided to outsource the work instead. “We didn’t have enough scale,” said Nelson, adding that the availability of labor was an issue along with the need to heavily invest in new technology.

Start-ups are difficult, noted Kusserow. Amedisys launches 12-15 home health care agencies a year. The cost is about $500,000, and sometimes double that amount for agencies that require special licensing, such as for hospice services or in a state where a certificate-of-need must be purchased.

Nelson asked the panelists whether home health and home care services compete with seniors housing or represent a route to referrals and higher occupancies.

Humana’s Greenfield views the relationship as a partnership. “We can come together to identify the right services at the right time,” she said.

Kaestner at Brookdale doesn’t see home health as a competitor because of its episodic nature. Home health providers offer treatment for a specific condition over a short period of time. But he added home care services can help increase the length of stay of residents. “It can be a win-win,” he said.

Telemedicine will change the home health market, said Kusserow. “It’s a tremendous opportunity.” Sensors will monitor the elder’s activity and health, signaling when assistance is needed. Amedisys invested last year in Medalogix, a Nashville-based predictive analytics company. It provides data to customize care plans to reduce hospitalizations and keep seniors in the most appropriate care setting—information sought by managed care plans.

Whether a senior living provider decides to launch its own home care and home health business or partner with another provider, the panelists agreed that a strong local management team is necessary for success. “All healthcare is local,” said Kaestner. “This is a people intensive business.”

Capital Options Flourish – Fall Conference Spotlights Finance Markets

Debt and equity capital is readily available for the right borrowers, according to panelists at the 2019 NIC Fall Conference.

Debt and equity capital is readily available for the right borrowers, according to panelists at the 2019 NIC Fall Conference. 

Private equity interest in the sector has not slowed as players compete for the best properties and development opportunities. Debt funds are assuming a bigger role as a capital source while traditional debt providers aim to stay disciplined amid wariness about the broader economic outlook and overbuilding in certain markets.

“It’s an interesting time,” said Sarah Anderson, managing director, Newmark Knight Frank. “The industry is in a good spot.”

Back-to-back educational sessions at the conference, held last month in Chicago, addressed the capital markets. The first panel discussion explored capitalization options. The second session compared new and traditional debt and equity capital sources.

The broader economic outlook provided context for the discussions. Panelists noted that unemployment is very low, 3.5% in September, its lowest point since December 1969, which has pressured wages and staffing in the sector. The Federal Reserve has cut interest rates two times so far this year, and may cut rates again, a plus for borrowers but also a worrisome sign that economic growth is slowing. 

“This is the longest economic expansion we’ve had,” noted panelist Grant Saunders, senior vice president/senior banker, KeyBank Real Estate Capital. He didn’t think any one factor might tip the economy into recession, adding that the correlation between seniors housing performance and the broader economy is somewhat muted in both bad and good times.

Private equity continues to play a big role in the sector. “We don’t see any slowing,” noted Anderson. She added that a lot of opportunistic capital is sitting on the sidelines, waiting to buy up troubled properties in overbuilt markets.

The agencies—Fannie Mae, Freddie Mac, and HUD—are actively lending and offering competitive rates, said panelists.

Debt funds have emerged as an alternative funding source, noted panelist Dan Reilly, managing director, White Oak Healthcare Finance, a debt fund. He’s bullish on skilled nursing properties, especially those owned by local operators that have good relationships with hospitals and other referral sources. “It’s a huge opportunity,” he said. “Great operators with great track records will win in the skilled nursing sector.”

Reilly said his fund has earmarked money to invest in new construction, though other lenders are wary of ground-up development at this point in the economic cycle.

“We like to understand new construction projects,” said Anderson. Developers prefer partners with sufficient liquidity to provide a completion guarantee and an operator with a good track record. Panelists noted that an operator should also be invested in the deal so its interests are aligned with those of the lenders and investors.

Panelists in the first session analyzed three case studies, providing insights into how they viewed each deal.

In the second session, panelist John Mark Ramsey, CEO, Sentio Investments, noted a disconnect between investor expectations and property performance. The operating environment is somewhat tricky while, in his opinion, investors still haven’t lowered return projections.

Ramsey likes repositionings and new development, in certain situations. “Other firms are moving in that direction,” he said.

The mezzanine debt market remains robust, according to Tim Podboy, head of originations, Heitman. Some banks dictate the use of preferred equity as an alternative, however.

Will credit standards tighten?  

“I think we will see some tightening,” said panelist Steve Anderson, managing director, Ally Bank Healthcare Capital.  He predicts that slower lease-ups will also slow lending.

Panelist Ramsey agreed. He thinks banks will tighten their lending standards because of a combination of an oversupply in some markets, labor shortages and rising expenses. In response, banks will focus on the quality of the operator and sponsor, he added.

Ally’s Anderson urged lenders to be patient. “Buildings will fill eventually,” he said.

Panelists in the second session also discussed the NIC study “The Forgotten Middle,” which explores the future housing needs of middle-income seniors. The speakers addressed how capital sources might work together to produce more housing for this growing cohort of elders.

Public-private partnerships were discussed as a financing option. Private capital sources will probably not accept the lower returns expected from middle-market housing. But other types of capital might, noted Ramsey, singling out so-called impact funds or those that invest with a social goal in mind.

Panelists agreed that middle-market communities may require a variety of capital funding sources. The hard part will be how to pay for the care component.

“There has to be a solution around how to provide care,” said Brock Andrus, managing director, structured finance, Bridge Investment Group. Emerging technologies that improve the efficiency of care delivery will play a role, he said. Partnerships with nonprofit organizations to operate the properties are another alternative, he added.

“We have to figure out a way to care for people in the most appropriate setting,” said Ramsey.


                                                              ###