The following analysis examines broader occupancy trends, year-over-year changes in inventory, and same-store asking rent growth – by care segment – within 1,036 Continuing Care Retirement Communities (CCRCs) and 13,701 non-CCRCs in the 99 NIC MAP Primary and Secondary Markets.
2Q 2026 Market Fundamentals by Care Segment – CCRC (All) vs. Non-CCRC
The exhibit below compares the market performance of CCRCs and non-CCRCs by care segment for the second quarter of 2026, highlighting year-over-year changes in occupancy, inventory, and asking rent growth.
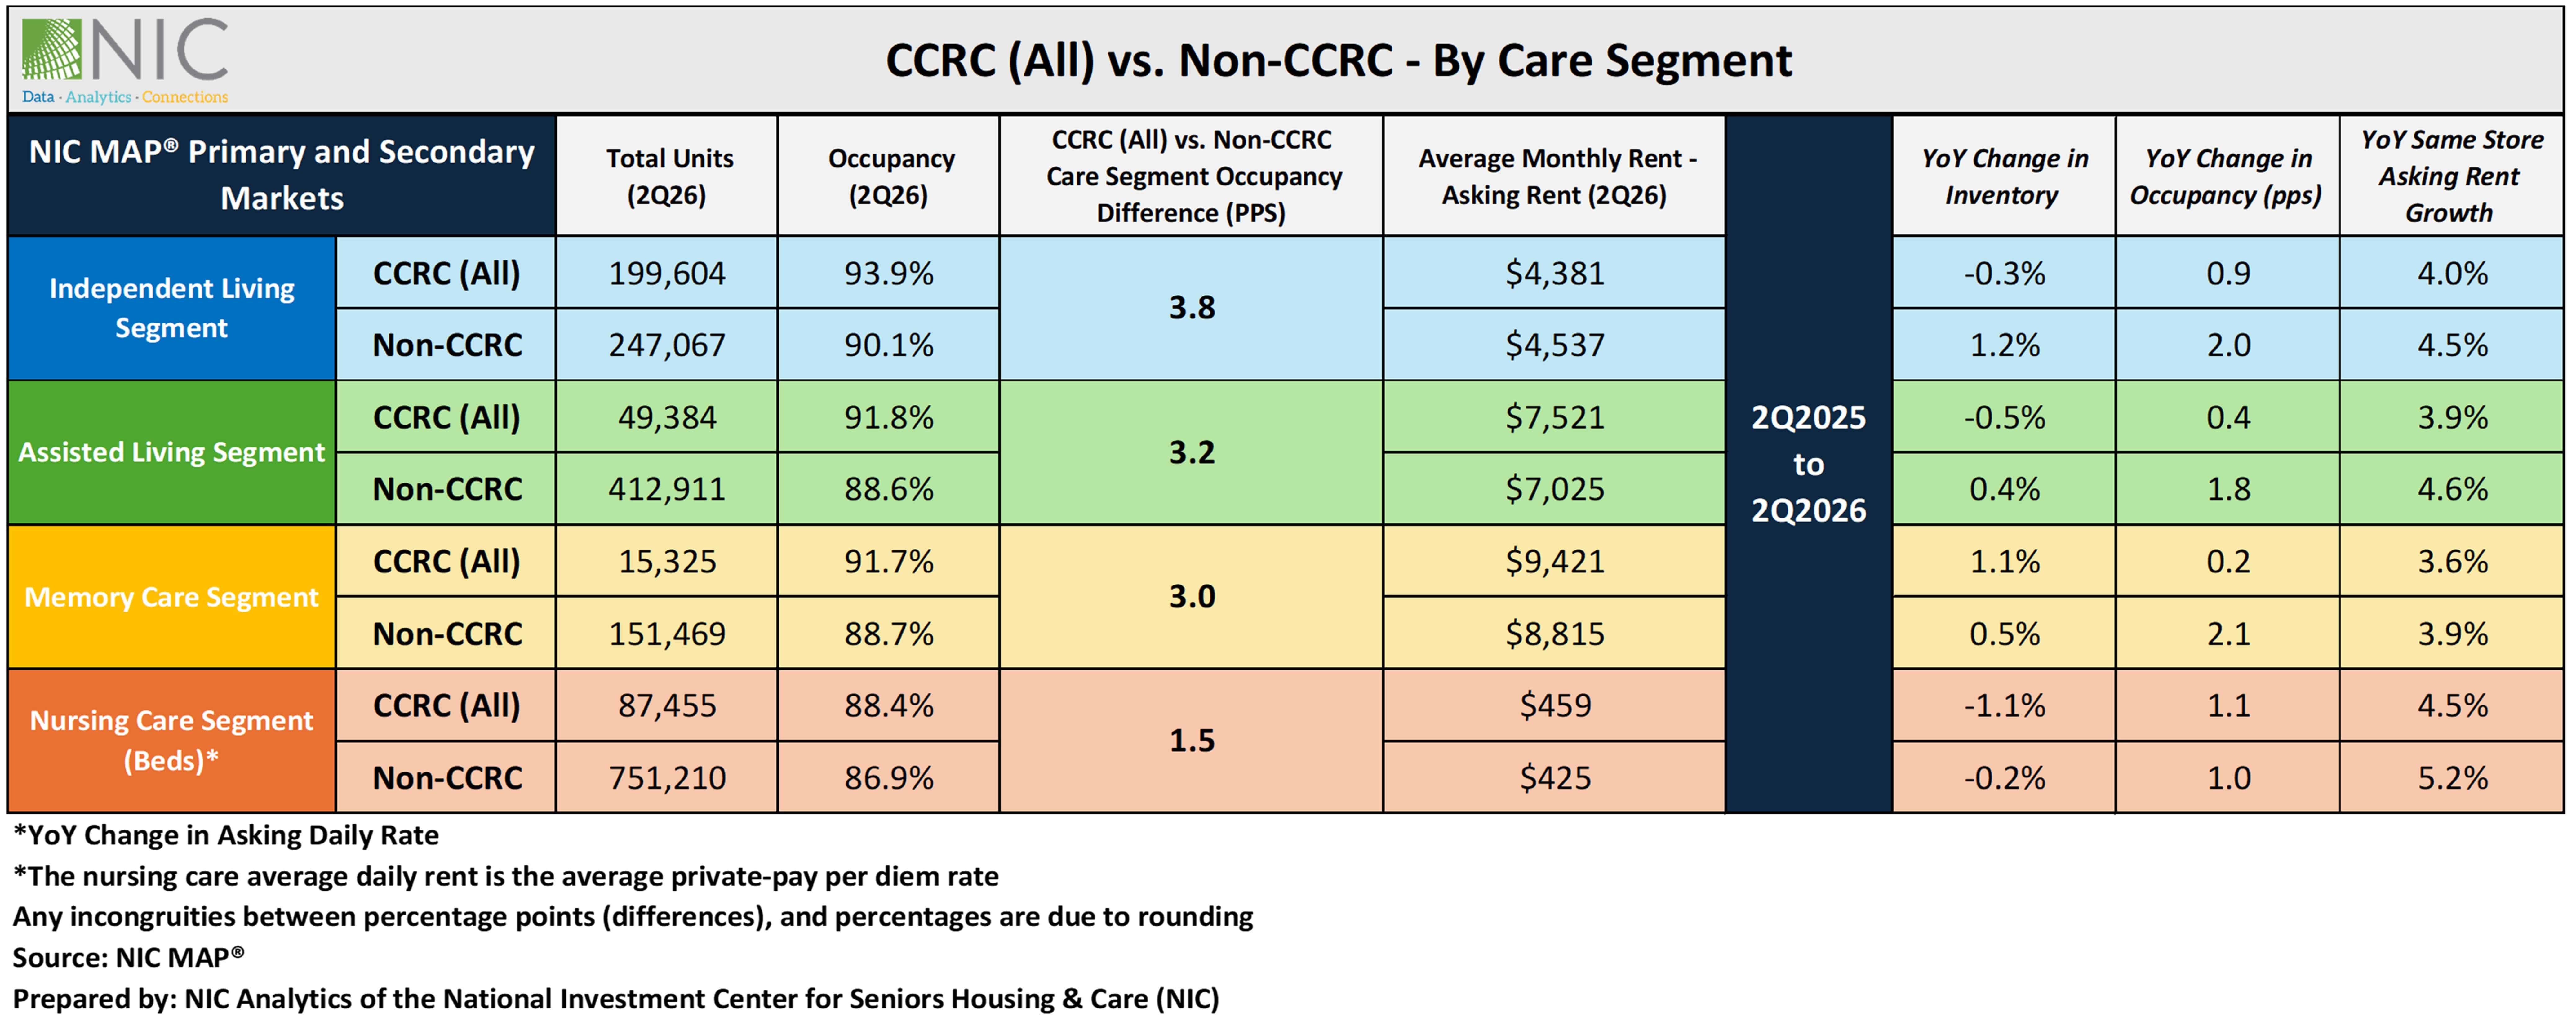
Occupancy. Consistent with prior quarterly results, CCRCs continued to outpace non-CCRCs in occupancy rates across all care segments. The largest occupancy difference between CCRCs and their non-CCRC counterparts in the second quarter of 2026 was in the independent living segment (3.8pps), with the smallest gap in the nursing care segment (1.5pps). The independent living segment recorded the highest occupancy rate among both CCRCs (93.9%) and non-CCRCs (90.1%).
Non-CCRCs recorded higher year-over-year occupancy change in all care segments except for the nursing care segment, with memory care recording the highest change from the past year (2.1pps). While CCRCs overall have higher occupancy, the occupancy growth has been slower compared to non-CCRC communities.
Asking Rent. The average monthly asking rent (in dollars) for CCRCs continues to be higher than that of non-CCRCs across all care segments except for the independent living segment. Non-CCRCs experienced stronger year-over-year rent growth in all care segments with nursing care segment showing the highest growth (5.2%).
Note, these figures represent asking rates and do not reflect any discounts that may be applied. The nursing care average daily rent is the average private pay per diem rate.
Inventory. Compared to the level a year ago, nursing care inventory declined in both CCRCs (1.1%) and non-CCRCs (0.2%), the largest drops among the care segments. Among CCRCs, positive inventory growth was only seen in memory care segment (1.1%), while assisted living and independent living edged down slightly by 0.5% and 0.3 respectively.
For non-CCRCs, the strongest year-over-year inventory growth was recorded in independent living (1.2%) and memory care (0.5%) segments, while nursing care declined.
Negative inventory growth can occur when units or beds are temporarily or permanently taken offline or converted to another care segment, offsetting any newly added supply.
Memory Care Led CCRC Absorption in 2Q 2026
The exhibit below presents year-over-year absorption rates across all care segments within 1,036 Continuing Care Retirement Communities (CCRCs) in the 99 NIC MAP Primary and Secondary Markets.
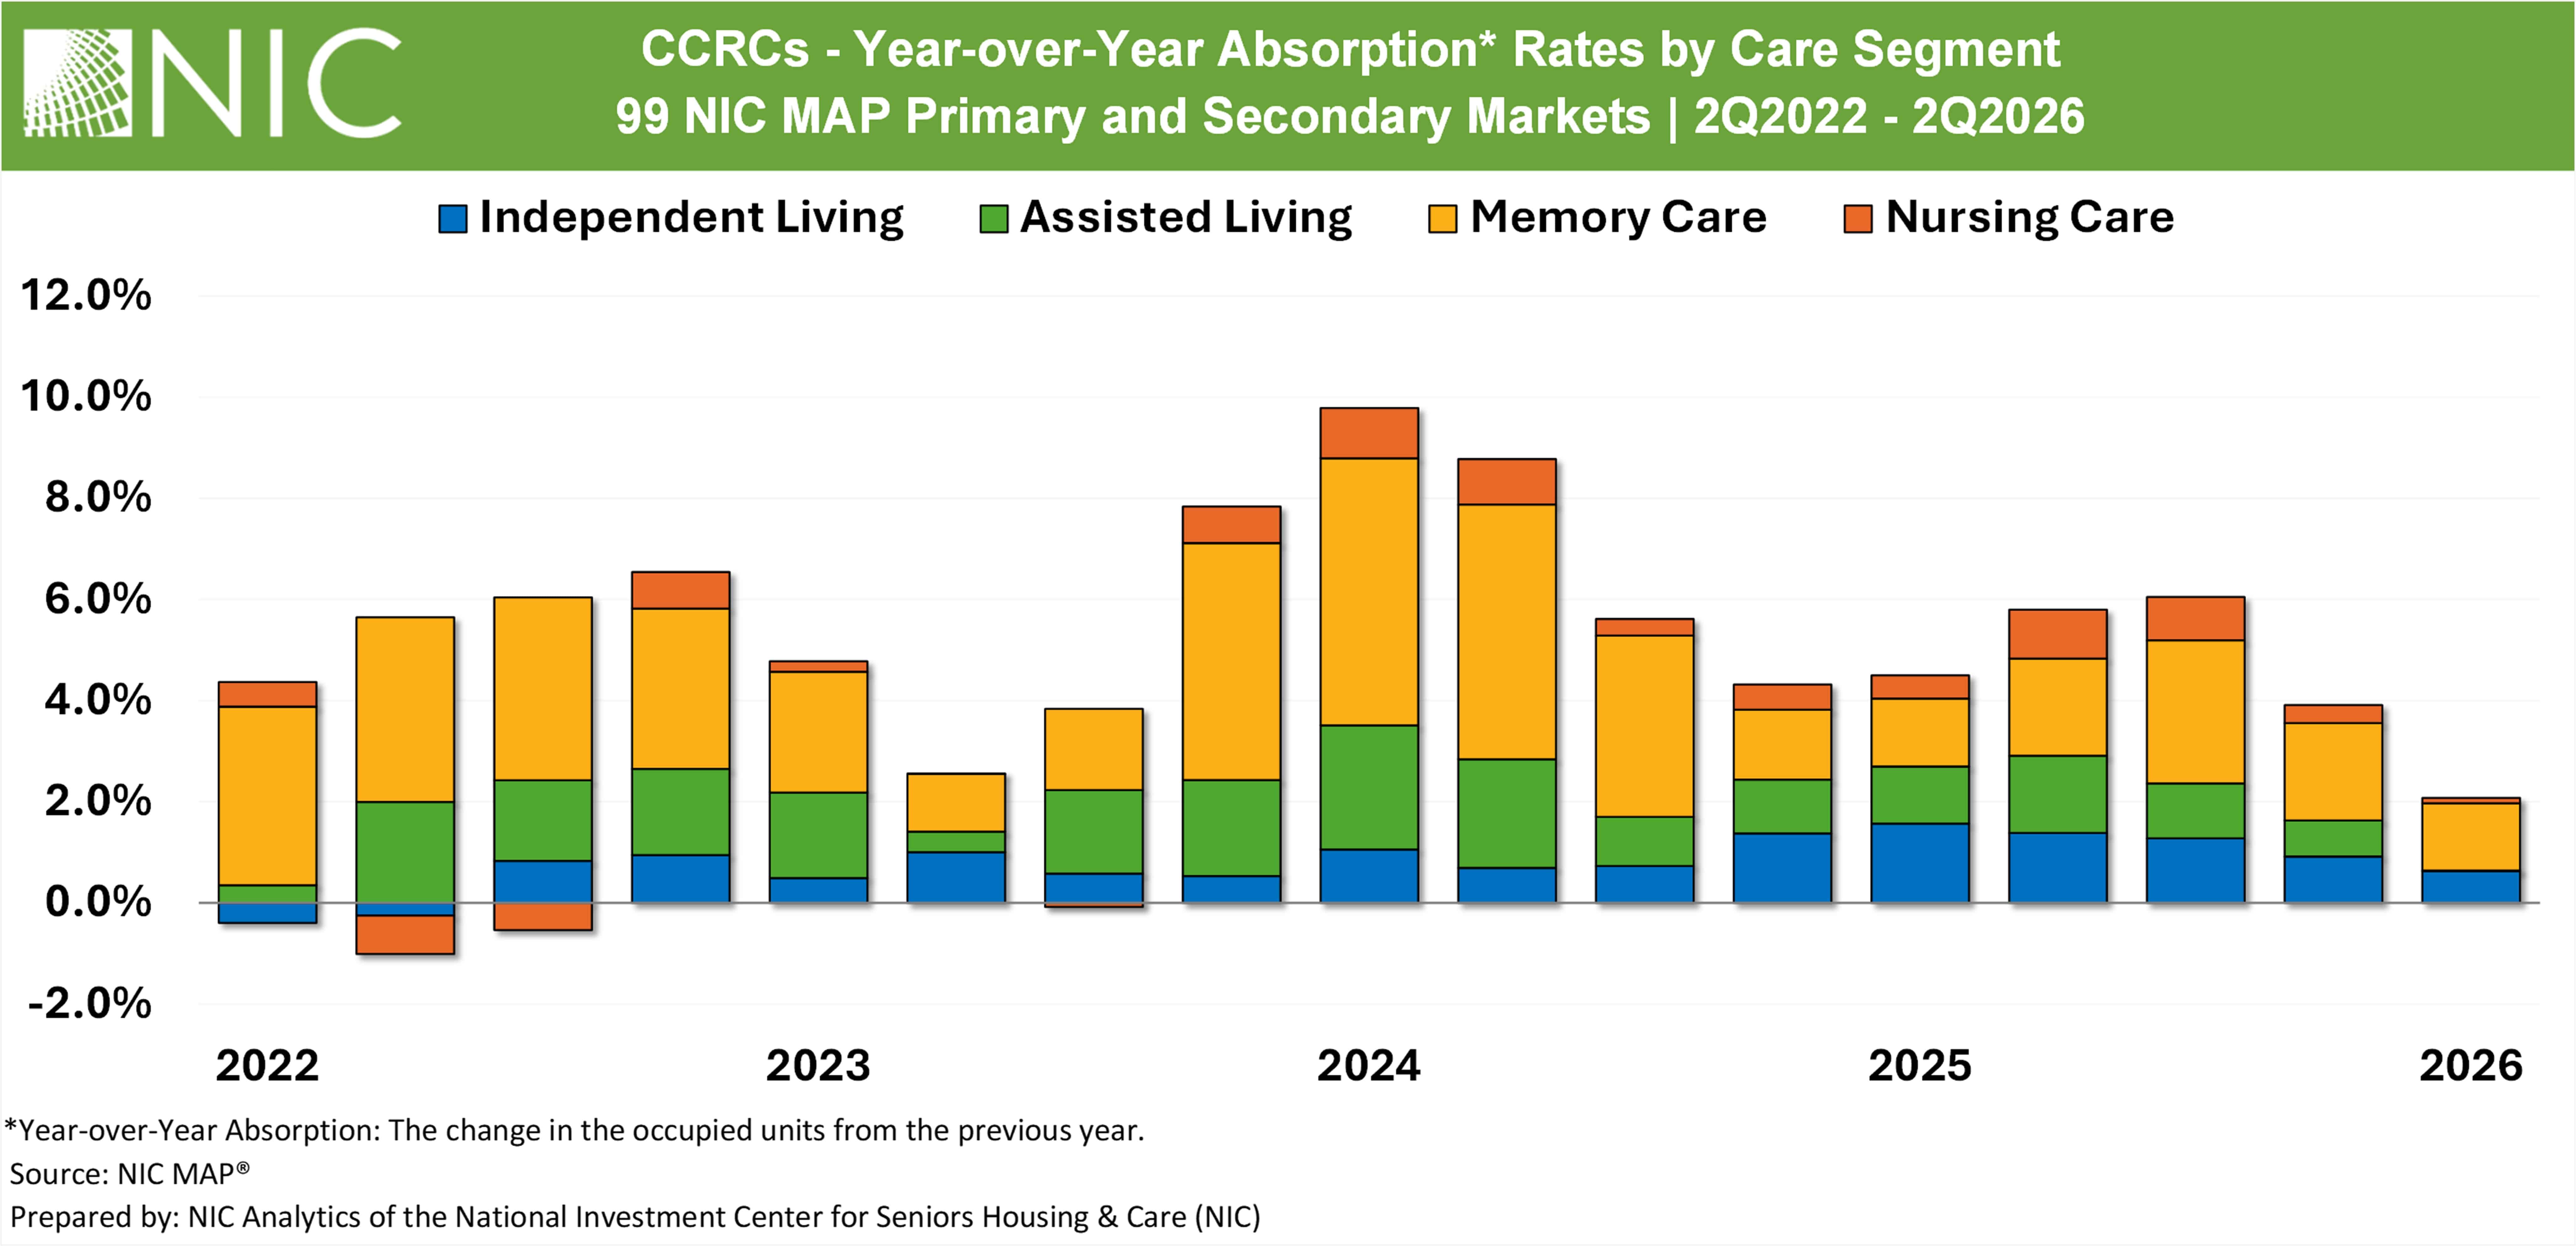
Absorption. Memory care segment continued to post the strongest year-over-year absorption rate among CCRC care segments in the second quarter of 2026, as it has in most quarters since the second quarter of 2022. In the second quarter of 2026, the memory care segment led year-over-year absorption within CCRCs at 1.3%, followed by independent living (0.6%) and nursing care (0.1%), while assisted living was essentially flat (0.02%). Memory care has led absorption among CCRC care segments for four consecutive quarters. Compared with year-earlier levels, absorption moderated in three of the four segments; independent living from 1.6%, assisted living from 1.1%, and nursing care from 0.5% while memory care held near its second quarter of 2025 rate of 1.3%. Assisted living absorption was at its lowest level since the first quarter of 2022.
In conclusion, memory care within CCRCs continues to stand out as a strong performer, driven by leading absorption rates and steady inventory expansion. This ongoing trend highlights the critical role of memory care services, reinforcing their position as a durable and growing segment of the senior housing market.
Look for future articles from NIC to delve into the performance of CCRCs.
###