The Economic Outlook and Its Impact on the Industry

Two of the nation’s most influential economic thinkers, Paul Krugman and Lawrence H. Summers, will face-off in person at this year’s NIC Fall Conference during a lively main stage debate.

Two of the nation’s most influential economic thinkers, Paul Krugman and Lawrence H. Summers, will face-off in person at this year’s NIC Fall Conference during a lively main stage debate. Both have strong, often differing opinions about the economy and the path forward. The discussion will be moderated by Angela Mago, president Key Commercial Bank & KeyBank Real Estate Capital.

Krugman is a Nobel Prize winning economist and professor emeritus of Princeton University’s Woodrow Wilson School. Summers is the former Secretary of the U.S. Treasury and president of Harvard University, and served in many U.S. executive branch administrations.

To provide context for the upcoming discussion, NICs chief economist, Beth Mace, recaps the big issues driving the economy, and topics likely to be addressed at the upcoming Fall Conference session.

Growth Outlook

As of the second quarter, real GDP in the U.S. had surpassed its pre-pandemic level, rising at a fast 6.5% annualized clip. That said, growth is likely to be much slower in the coming months as the vast pandemic-related fiscal stimulus starts to wane, pent-up demand begins to fade, and as the COVID-19 Delta variant takes its toll. It will be interesting to hear the broad views Krugman and Summers will have on the shape of the post-pandemic recovery.

Inflation

Since the recovery from the pandemic has begun, inflation has increased due to supply chain disruptions and reopening effects. The policy question has become whether this inflation growth is transitory or will become more permanently embedded in consumer and business expectations.

Labor Pains: Short or Longer Term?

Increasingly, we hear from employers of all industries, and importantly, seniors housing and nursing care are among these industries, that finding workers is a limiting factor to business expansion. Certainly, one part of the discussion on labor shortages is around what is causing so many low wage workers to stay out of the labor force now.

Interest Rates

Federal Reserve Chairman Jerome Powell recently said that interest rate hikes are not on the Fed’s radar immediately. But the markets may not agree with the pace and timing of expected interest rates increases. As the economy starts to improve, what should we expect to see with interest rates?

Send Us Your Questions

For more on the 2021 NIC Fall Conference opening session with Krugman and Summers, look for an interview with Paul Krugman in the September edition of the NIC Insider newsletter, coming September 9. As session moderator Angela Mago prepares for the discussion, she wants to know what topics industry stakeholders want to hear about. Send your questions now to submityourquestions@nic.org.

Learn more about the 2021 NIC Fall Conference and register here. 

 

Enhanced Transparency with the New NIC Lending Trends Report

The NIC Lending Trends report provides Q1 2021 data plus five years of data of seniors housing and nursing care loan volumes and loan balances from debt providers.

The NIC Analytics team recently released the inaugural NIC Lending Trends report. The timely report provides first quarter 2021 data as well as nearly five years of data of senior housing and nursing care loan volumes and loan balances from a range of debt providers.

The new quarterly report currently tracks over $85 billion in senior housing and care loans including construction loans, mini-perm/bridge loans, and permanent loans. It includes delinquency rates, same-store growth metrics and indexed volumes.

NIC Analytics has been collecting data for more than five years with the goal of further enhancing transparency of capital market trends in the senior housing and care sector. These data are not to be interpreted as a census of all senior housing and skilled nursing lending activity in the U.S. but rather reflect lending activity from participants included in the survey sample only.

Highlights of the 1Q2021 report can be found below, with the full report available for download on nic.org. The next quarterly NIC Lending Trends Report, including second quarter 2021 data, is scheduled for release in early November.


Takeaways from 1Q21 NIC Lending Trends Report

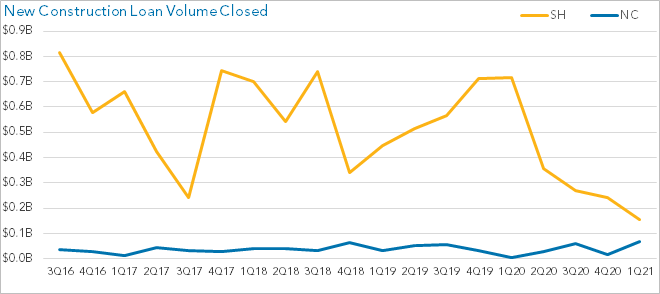
  • The issuance of closed new construction loans remained relatively weak for senior housing in 1Q2021 and was at its lowest level since the data series has been reported starting in mid-2016. Growth was negative for the fourth consecutive quarter on a same-store quarter-over-quarter basis. Lenders’ interest in many development projects was put on hold due to uncertainties associated with the pandemic. Anecdotally, and since the introduction and widespread use of vaccinations at the end of 2020, lender interest in the sector has improved and data in future quarters may prove this out. For nursing care, the volume of new construction loans closed saw an increase in 1Q2021 from 4Q2020 but remains at very low levels and is in line with historic patterns.

Source: NIC Lending Trends Report, NIC Analytics

  • Volume of new mini-perm/bridge loans closed was strong for nursing care in 1Q2021, reaching the second highest recorded volume in the time series. Lending has been increasing since the second quarter of 2020 and remained near its 4Q2020 peak. New mini-perm/bridge loans closed for senior housing were flat in 1Q2021 at relatively low levels compared with recent years.
  • New permanent loan issuance for senior housing was weak in 1Q2021 and was at its lowest level in the recorded time series since mid-2016. New permanent loans for senior housing saw a drop of 45.6% on a same-store basis from 4Q2020. Nursing care permanent loan issuance was also weak and has been so for the past several quarters.

Quarterly updates to the NIC Lending Trends Report will be available on nic.org. 

Interested in participating? NIC very much appreciates our data contributors. This report would not be possible without them. If you would like to participate and contribute your data, please email us at analytics@nic.org. The information provided as part of the Lending Trends survey will be kept strictly confidential. Data acquired from this survey will only be reported in the aggregate, and therefore, the resulting aggregated data will not be attributed to you or your company upon distribution. As a thank you for providing data, data contributors receive the Lending Trends report in advance of public publication.

Senior Living Thought Leader Randy Bufford: “We Need to Invest in People”

What’s ahead for senior housing and care? Randy Bufford has some thoughts on the topic. As Founder and Chairman of Trilogy Health Services, Bufford is one of the thought leaders attending the 2021 NIC Fall Conference in Houston.

What’s ahead for senior housing and care?

Randy Bufford has some thoughts on the topic. As Founder and Chairman of Trilogy Health Services, Bufford is one of the thought leaders attending the 2021 NIC Fall Conference in Houston. The Conference is NIC’s first in-person convening of leaders in senior housing and care since the pandemic began.

NIC recently talked to Bufford in advance of the event to get his take on the industry’s outlook. Many industry leaders plan to attend the Conference to share ideas with others experiencing the same challenges, while also building the relationships that will help them succeed in the future.

Bufford identified five senior living trends to watch:

  1. Labor shortage. “This is the most difficult labor market I’ve ever seen in my 39 years in the industry,” said Bufford. “We need to invest in people.” Trilogy’s approach is to put employees first. “Great staffing leads to great customer service,” he added. Bufford’s advice: Focus on retention. For Trilogy, that means a holistiRandy Bufford Headshot Prof (1)c approach including training programs and apprenticeships to create a career path, a servant leader culture that demonstrates that the company cares about them, and frequent, strategic wage increases. Trilogy, which has 124 communities, raises employee wages gradually, every quarter. Bufford calls it the company’s quarterly wage investment, a program to boost the pay of the lowest paid workers. Caregiver positions today pay $15 an hour and up. “Make those investments wisely and the industry should be able to solve these staffing challenges,” he said.
                        “We need to invest in people.”

  2. Private units. As one of the largest builders of new skilled nursing facilities in the country, Trilogy has switched its prototype design to all private rooms. The pandemic only highlighted the need for greater infection control which is easier to achieve with private rooms. “Dual occupancy units in skilled nursing should be changed,” he said.
  3. Advances in technology. Telehealth is likely here to stay. Remote visits got a big boost when Medicare expanded coverage of telehealth services during the pandemic. Many expect the coverage to continue when the health emergency ends—a net plus for the industry. Also, monitoring devices will continue to be refined to help improve resident health and reduce labor costs.
  4. Innovative infection controls. The pandemic highlighted the need for new approaches. Trilogy launched The SHIELD program, as a comprehensive view of infection control, applying the latest disinfection and cleaning tools. The communities are also equipped with a UV light system that destroys 99.99% of surface and airborne pathogens. Trilogy continues to experiment with special ventilation and filtration products to determine whether they can help limit the spread of viruses. “We’ve learned a lot of tough lessons during the pandemic, but they’re good lessons,” said Bufford.
  5. The intersection of demography and affordability. Overall, Bufford is bullish on the industry as the number of seniors who need help continues to grow. But the rising older population, especially among those seeking an affordable housing option, is colliding with the labor shortage. Bufford sees a possible solution by engaging families in caregiving since they already provide a lot of care services at home. The idea would be to move those relationships to a senior living community where the family would help provide care in return for a reduced cost of services. “The operators that win will be those that innovate in their approach to find ways to provide better care, more efficiently,” predicted Bufford.

Much Attention to Strong July Employment Report: Jobs Up by 943,000

The Labor Department reported that nonfarm payrolls rose by a strong 943,000 in July 2021 and an upwardly revised 938,000 in June. The consensus estimates for July had been for a gain of 858,000. Nonfarm payrolls are now up by 16.7 million since April 2020 but remain down by 5.7 million or 3.7% from pre-pandemic levels of February 2020.

The Labor Department reported that nonfarm payrolls rose by a strong 943,000 in July 2021 and an upwardly revised 938,000 in June. The consensus estimates for July had been for a gain of 858,000. Nonfarm payrolls are now up by 16.7 million since April 2020 but remain down by 5.7 million or 3.7% from pre-pandemic levels of February 2020. The data show that the U.S. recovery from the pandemic remains in place and that the hindrance on hiring from labor shortages may be easing. Its noteworthy, however, that the data collection period for the July report occurred in the first half of the month, prior to growing concerns about the COVID-19 Delta variant.

Today’s report is especially important as the Federal Reserve wants to see “substantial progress” in the economy before it shifts monetary policy to a tighter regime of higher interest rates and fewer asset purchases.   The July jump in jobs along with the significant upward revisions in June and May payrolls point to an improving labor market, a key consideration for the Fed in evaluating “substantial progress”. Further, the 4.0% annual increase in average hourly earnings will fuel concerns about inflation.

Indeed, average hourly earnings for all employees on private nonfarm payrolls rose by $0.11 in July to $30.54, a gain of 4.0% from a year earlier, up from 3.7% in June. The data suggests that rising demand for labor associated with the recovery from the pandemic is putting upward pressure on wages. That said, the Labor Department warns that the pandemic has affected the ability to fully interpret the wage data due to the wide swings in employment trends. 

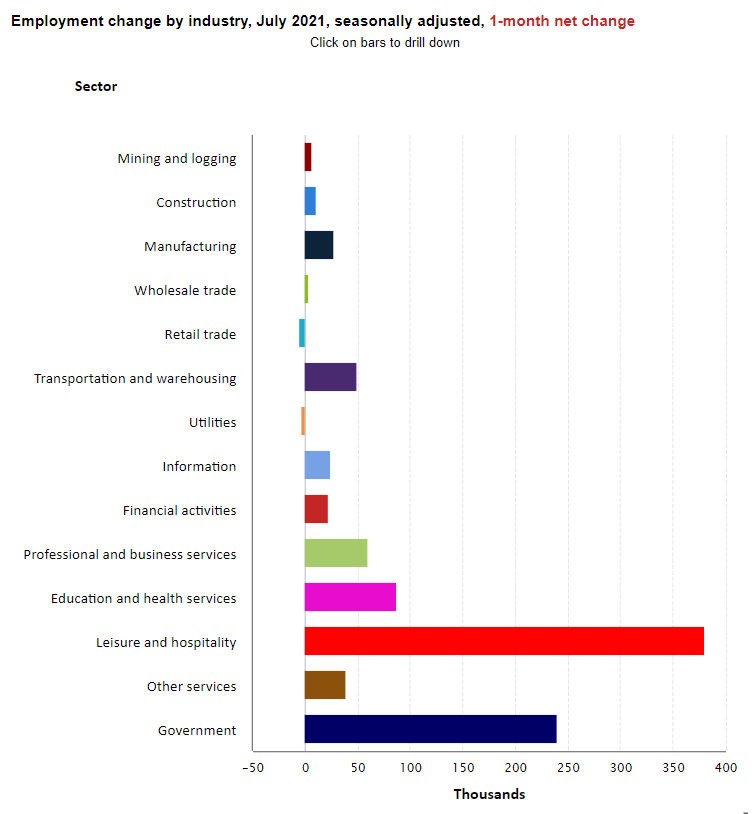
Notable job gains occurred in leisure and hospitality (380,000), local government (221,000), and professional and business services (60,000). Health care added 37,000 jobs in July. Job gains in ambulatory health care services (32,000) and hospitals (18,000) more than offset a loss of 13,000 jobs in nursing and residential care facilities. Health care employment is down by 502,000 since February 2020.  

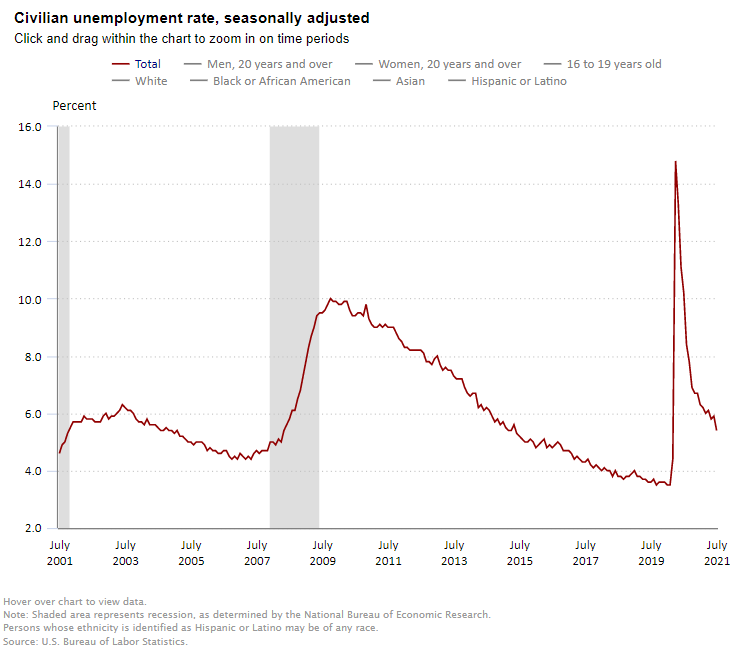
Separately and from a different survey, the Labor Department reported that the unemployment rate fell by 0.5 percentage point to 5.4% in July and the number of unemployed persons fell by 782,000 to 8.7 million. The jobless rate is now 1.6 percentage points above the pre-pandemic level of 3.5% seen in February 2020, but well below the 14.7% peak seen in April 2020. The underemployment rate or the U-6 jobless rate was 9.2% down from 9.8% in June 2021. This figure includes those who have quit looking for a job because they are discouraged about their prospects and people working part-time but desiring a full work week.  

The number of long-term unemployed (those jobless for 27 weeks or more) decreased by 560,000 to 3.4 million but is 2.3 million higher than in February 2020, suggesting that this continues to be a very challenging time for many Americans. Long-term unemployed persons account for 39.3% of the total number of unemployed persons.

The labor force participation rate, which is a measure of the share of working age people who are employed or looking for work was steady at 61.7% in July and has remained within a narrow range of 61.4% to 61.7% since June 2020. The participation rate is 1.6 percentage points lower than in February 2020. Many workers have dropped out of the labor force since the pandemic began to take care of family members or out of fear of working and catching the virus.  

The change in total nonfarm payroll employment for May was revised up by 31,000 from a gain of 583,000 to 614,000 and the change for June was revised up by 88,000 from 850,000 to 938,000. With these revisions, employment in May and June combined is 119,000 higher than previously reported. Monthly revisions result from additional reports received from businesses and government agencies since the last published estimates and from the recalculation of seasonal factors. 

CCRC Care Segment Performance 2Q 2021

The analysis leverages NIC MAP® data, powered by NIC MAP Vision, an affiliate of NIC. NIC MAP data tracks occupancy, asking rents, demand, inventory, and construction data for independent living, assisted living, memory care, skilled nursing, and continuing care retirement communities (CCRCs, also referred to as life plan communities) for more than 15,000 properties across 140 metropolitan areas.

The following analysis examines current conditions and year-over-year changes in inventory, occupancy, and same-store asking rent growth—by care segments within CCRCs (CCRC segments) compared to non-CCRC segments in freestanding or combined communities to focus a lens on the relative performance of care segments within CCRCs during the second quarter of 2021.

The analysis leverages NIC MAP® data, powered by NIC MAP Vision, an affiliate of NIC. NIC MAP data tracks occupancy, asking rents, demand, inventory, and construction data for independent living, assisted living, memory care, skilled nursing, and continuing care retirement communities (CCRCs, also referred to as life plan communities) for more than 15,000 properties across 140 metropolitan areas. NIC MAP Data currently tracks 1,208 not-for-profit and for-profit entrance fee and rental CCRCs in these 140 combined markets (1,134 in the 99 combined Primary and Secondary Markets).

Current CCRC Occupancy by Payment Type and Profit Status

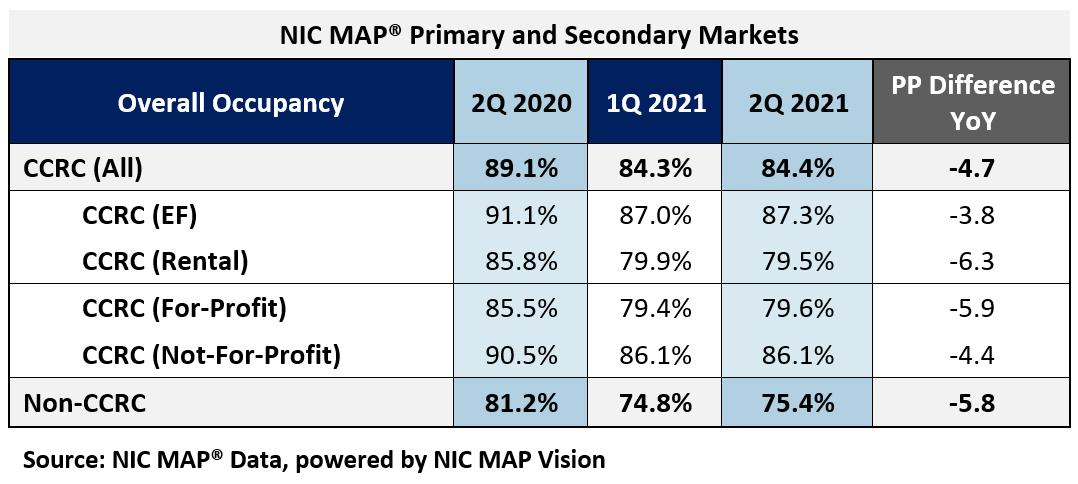
From 2Q 2020 to 2Q 2021, the cumulative drop in CCRC occupancy was 4.8 percentage points from 89.1% to 84.4%. For context, CCRC occupancy in the second quarter fell 7.1 percentage points from pre-pandemic levels (1Q 2020). Non-CCRC occupancy averaged 75.4% in 2Q 2021—a very wide 9.0 percentage points lower than CCRC occupancy. On a year-over-year basis, entrance fee CCRC occupancy (87.3%) was 7.8 percentage points higher than rental CCRCs (79.5%), and not-for-profit CCRC occupancy (86.1%) was 6.5 percentage points higher than for-profit CCRCs (79.6%).


CCRCs vs. Non-CCRCs: Care Segment Detail

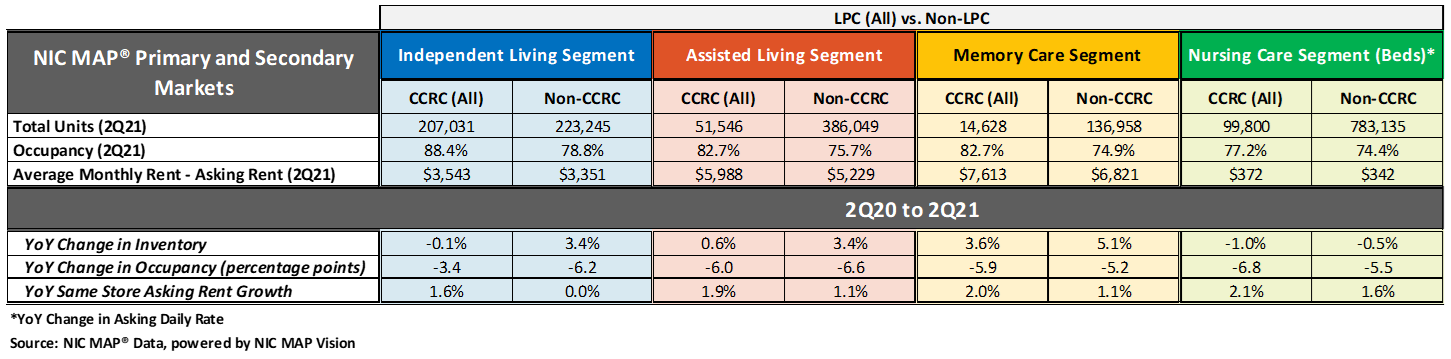
The table below compares each of the care segments—independent living, assisted living, memory care and nursing care—in the Primary and Secondary Markets. The table shows the 2Q 2021 total open units, occupancy and average monthly asking rent—and year-over-year changes for CCRCs and non-CCRCs.

[click to enlarge]

Independent living occupancy nearly 10 percentage points higher than non-CCRC

The CCRC independent living care segment had the highest 2Q 2021 occupancy (88.4%), followed by CCRC assisted living and memory care (82.7%, respectively). The difference in 2Q 2021 occupancy between CCRCs and non-CCRCs was the highest for the independent living segment (9.6 percentage points), and the lowest for the nursing care segment (2.8 percentage points).

While overall occupancy declined from year-earlier levels for each of the care segments, CCRCs had lesser declines in overall occupancy than non-CCRCs. The differences are in part due to the relative influence of the majority inventory mix. The CCRC independent living care segment (which represents 55.5% of CCRC units) garnered the highest occupancy in the second quarter of 2021 (88.4%), as well as the smallest year-over-year drop in occupancy, falling 3.4 percentage points. The current nursing care segment occupancy rate in non-CCRCs, which represents 51.2% of non-CCRC units, was much lower at 74.4%, and fell 5.5 percentage points year-over-year.

The highest year-over-year asking rent growth was in the CCRC nursing care and memory care segments (2.1% and 2.0, respectively). The lowest was noted for non-CCRCs in the independent living care segment (0.0%). Note, these figures are for asking rates and do not consider any discounting that may be occurring.

A long-term phenomenon, CCRCs had lower rates of inventory growth (year-over-year change in inventory) by segment than non-CCRCs. Negative inventory growth was reported for CCRCs in the nursing care segment (-1.0%). Negative inventory growth can occur when units/beds that are temporarily or permanently taken offline or converted to another care segment outweigh added inventory.

Wide disparity in regional CCRC median occupancy performance

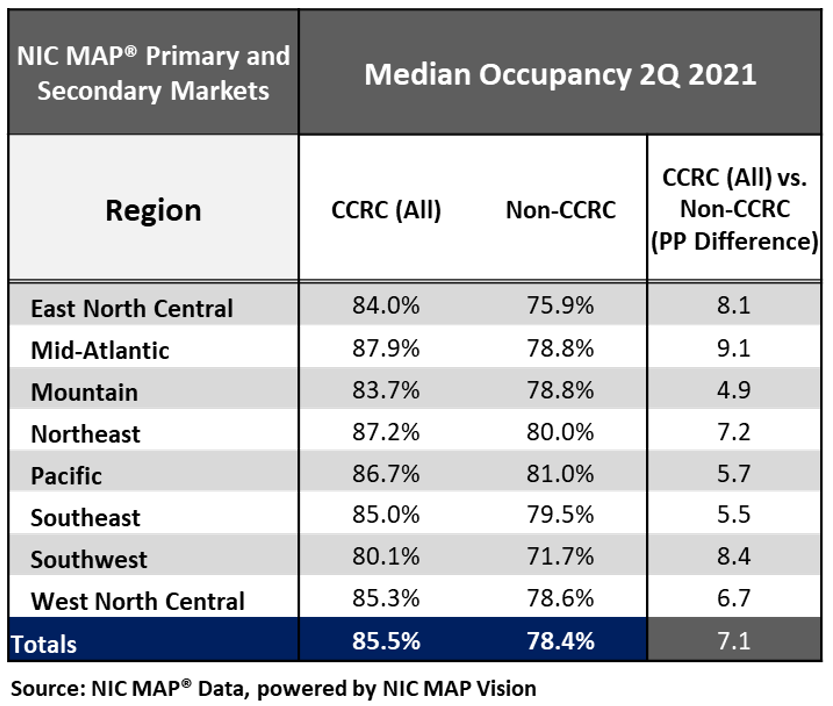
For benchmarking purposes, some investors and operators prefer to measure themselves against the median occupancy rate, assuming that the properties that support a higher median rate are of higher institutional quality. The table below illustrates the median occupancy rates in each region.

In the second quarter of 2021, three out of eight regions had median CCRC occupancy higher than the national median rate (Mid-Atlantic, Northeast and Pacific).

The strongest CCRC median occupancy rate is in the Mid-Atlantic region and the weakest is in the Southwest region. It is notable that the difference between the Southwest’s CCRC median occupancy rate (80.1%) and the Mid-Atlantic’s CCRC median occupancy rate (87.9%) is nearly eight percentage points underscoring the wide disparity in CCRC occupancy performance.

Look for future blog posts from NIC to delve deep into the performance of CCRCs.


Interested in learning more?

To learn more about NIC MAP data, powered by NIC MAP Vision, and about accessing the data featured in this article, schedule a meeting with a product expert today.


*This blog was originally published in Ziegler Investment Banking, Senior Living Finance Z-News.