Identifying Trends in CMS Skilled Nursing Penalties
The primary tool CMS has for enforcing care standards at skilled nursing properties are civil monetary penalties, fines for facilities out of compliance.
Updated November 23, 2021 (original blog posted June 29, 2021).
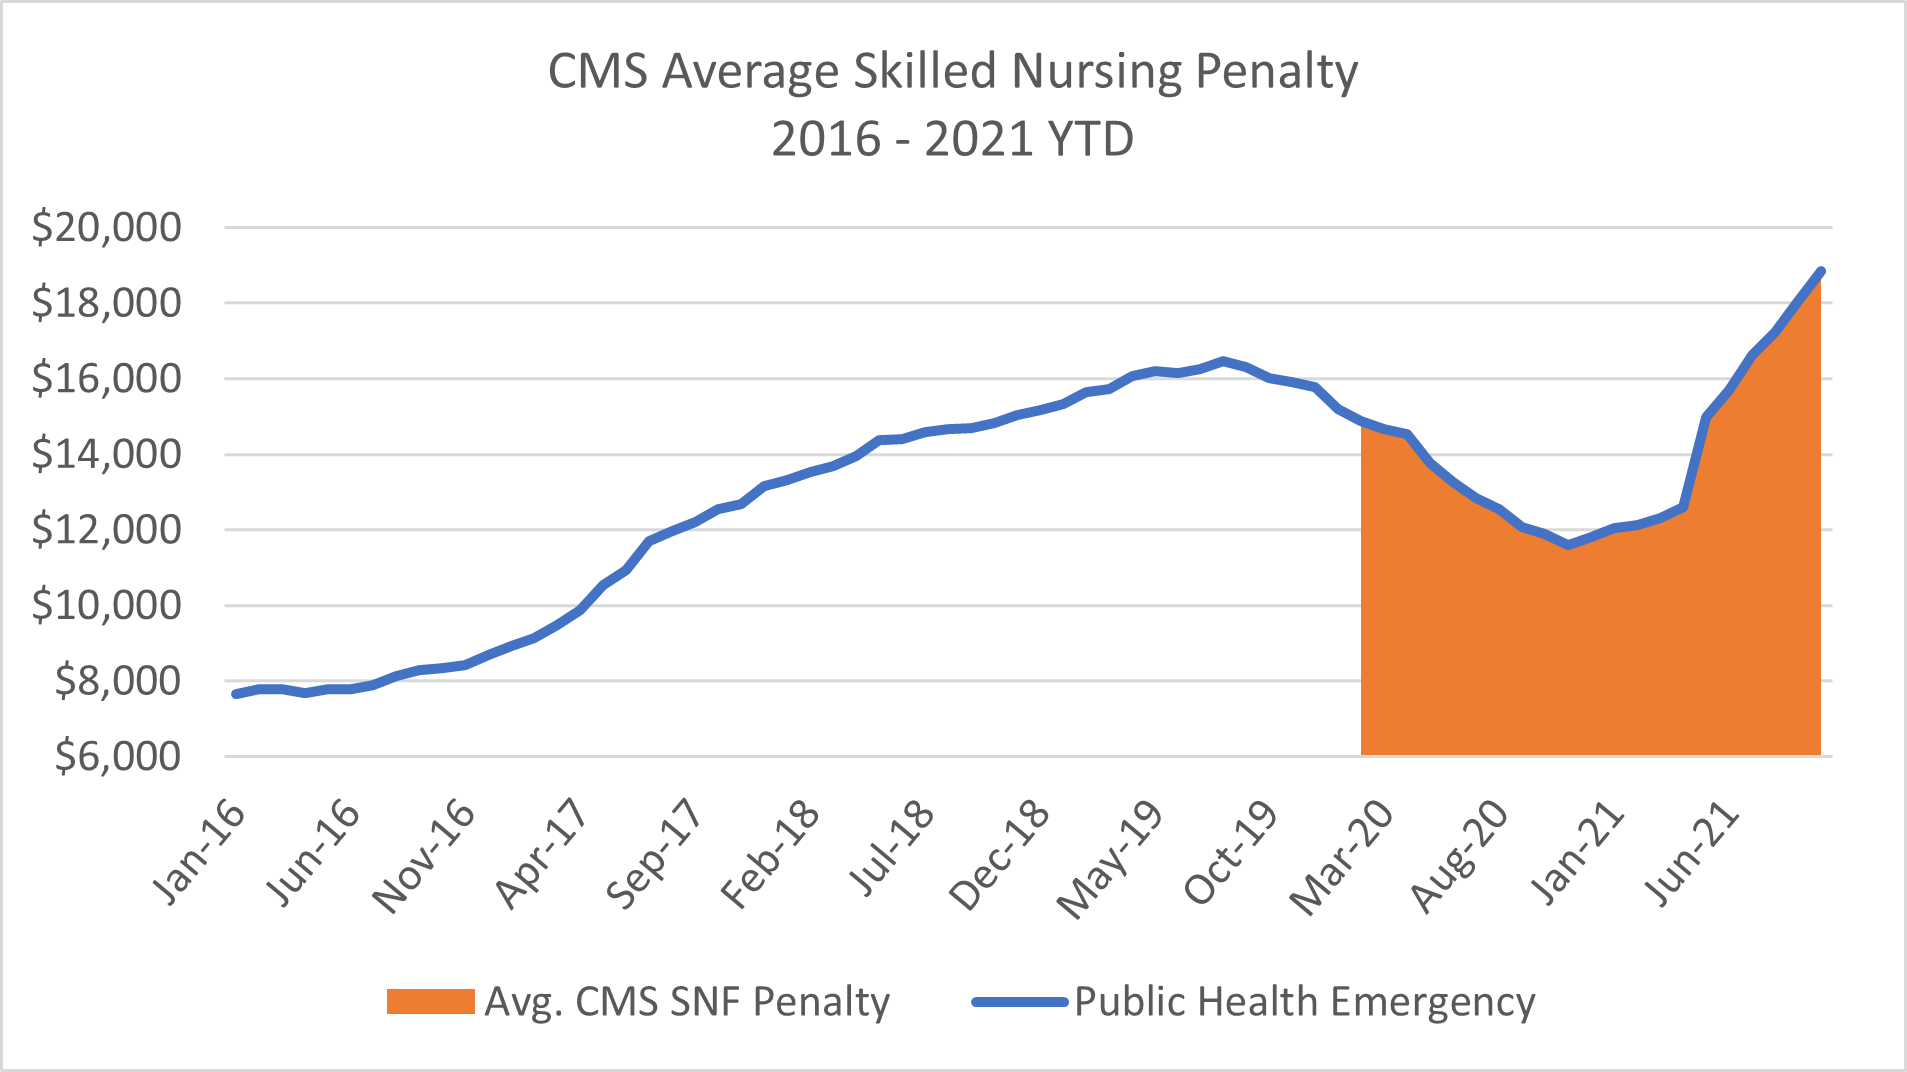
The primary tool CMS has for enforcing care standards at skilled nursing properties are civil monetary penalties (CMPs), which are essentially fines for facilities found to be out of compliance with CMS care standards. Based on a national average, CMS penalties for skilled nursing properties had been on the rise from 2016 to the third quarter of 2019.
As the country began to grapple with the COVID-19 pandemic, and the public health emergency was announced, the national average of CMS penalties declined. This was likely a reflection of the more collaborative, less-punitive surveys that took place while surveyors – the CMS regulatory staff who assess compliance with Medicare health and safety regulations – and operators alike learned about COVID-19, it’s spread, and the best practices regarding infection control, PPE stock, and sanitation protocols.
After a downward trend in average CMS skilled nursing penalty during the first ten months of the Public Health Emergency, this metric has now shifted, trending upwards for the past 11 months. The most recently released data from CMS’ Provider Data Set, shows the average skilled nursing penalty at $18,551 for October 2021. This is $2,080, or 12.6%, higher than the pre-Public Health Emergency high mark of $16,471 reported in August 2019.
Two key changes occurred during the COVID-19 Public Health Emergency. First, the understanding about COVID-19 and how to best protect residents grew dramatically. This understanding occurred at many levels – the seniors housing and care sectors, the industry’s regulatory bodies, as well as federal, state, and local governments that all had to get up to speed quickly on best practices regarding the novel coronavirus.
Once that learning curve had been achieved, average CMS skilled nursing penalties began to rise steeply. The rise in average penalty coincided with early vaccination efforts for skilled nursing residents and staff and continued to increase to encourage operators to meet higher staffing ratios, newly identified infection control practices, and sanitation protocols, among other criteria.
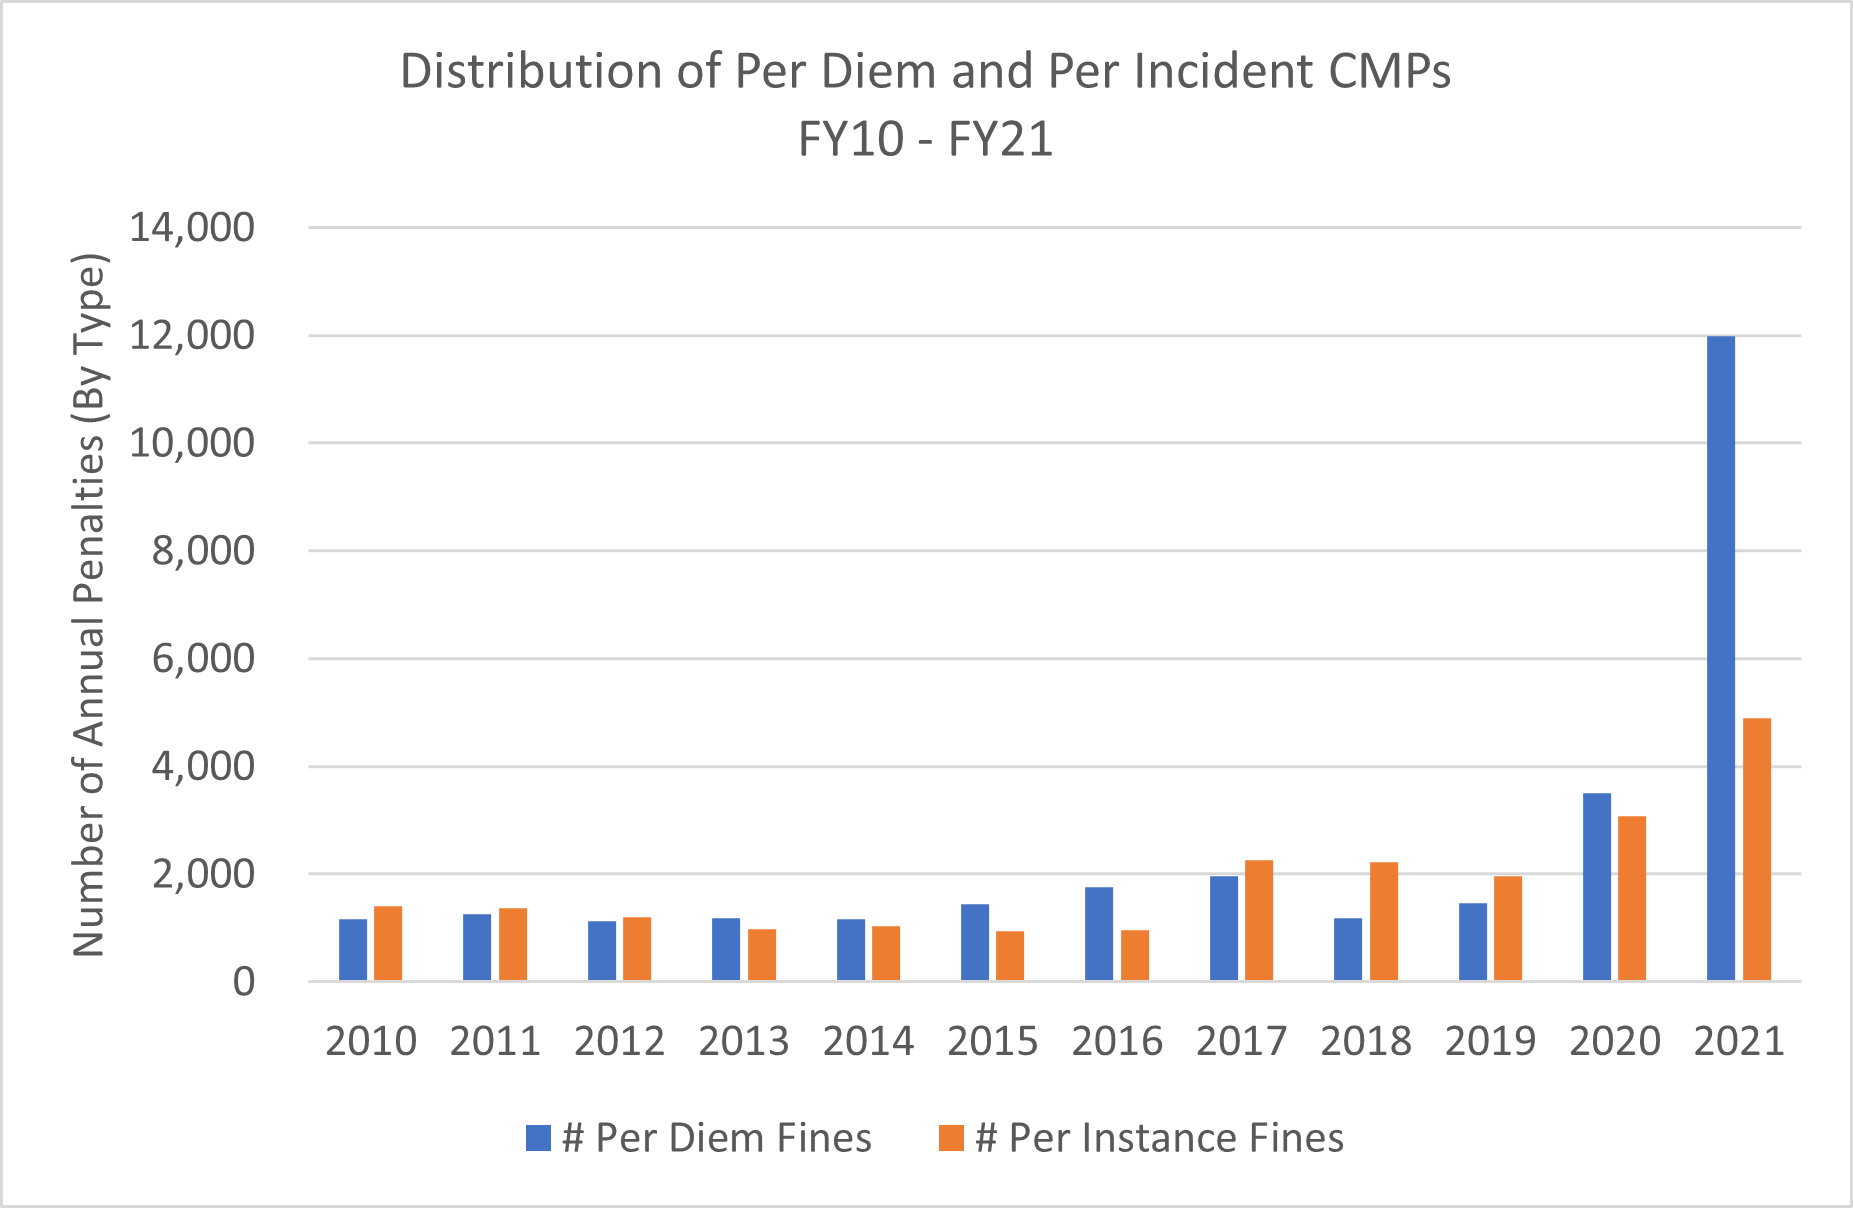
In addition to the increasing average CMS skilled nursing penalty, another significant trend has materialized in 2021 – a steep rise in per diem, or per-day, penalties. Skilled nursing properties can be penalized through the imposition of a CMP for either the number of days that a facility has been out of compliance with a federal requirement (per-day or per-diem), for each episode of noncompliance (per-instance), or CMS can deny payments for new admissions.
In 2017, guidelines were changed to set per-instance CMPs, rather than per-day, as the default penalty. Per-day penalties are often applied retrospectively and can accumulate to significant fines. Although per-day penalties remained the recommended approach for major violations, their overall use has been reasonably limited until 2021.
With a new federal government administration and new leadership at both CMS and HHS, we may be witnessing the return of a stricter survey process. While penalties from CMS are an essential tool for ensuring skilled nursing properties are complying with care standards and are protecting their residents, both the approach to surveying and severity of enforcement may be changing.
Senior Housing Delinquencies Decline in 2Q2021, and Other Lending Trends
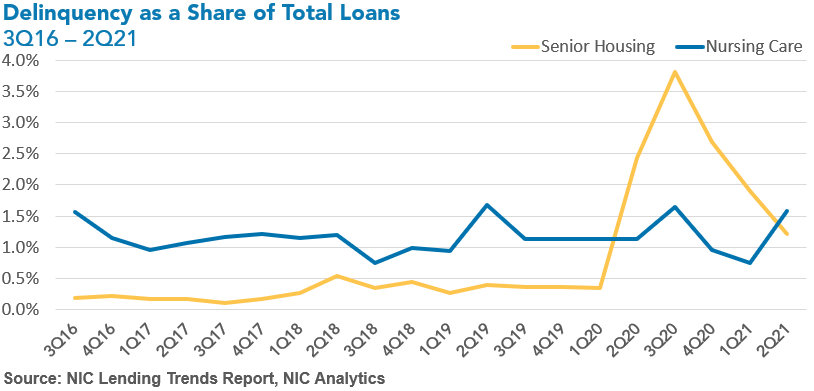
Delinquent loans, which include loans in forbearance for some lenders, had a marked improvement for senior housing during the second quarter.
NIC Analytics recently released the 2Q2021 NIC Lending Trends report, a free report available now. The quarterly report tracks over $86.9 billion in senior housing and nursing care loans including construction loans, mini-perm/bridge loans, and permanent loans from the third quarter of 2016 through the second quarter of 2021. The NIC Lending Trends Report helps to deliver on NIC’s mission to enable access and choice by further enhancing transparency of capital market trends in the senior housing and care sector.
Below are a few key takeaways from the NIC Lending Trends Report for second quarter 2021. Access the full report on nic.org.
Takeaways from the 2Q21 report.
Delinquent loans, which include loans in forbearance for some lenders, had a marked improvement for senior housing during the second quarter. Delinquencies as a share of total loans for senior housing declined for the third consecutive quarter following the recorded peak of 3.8% in 3Q2020 and stood at 1.2% in the second quarter. However, nursing care delinquencies as a share of total loans increased from 0.8% in 1Q2021 to 1.6%.
The volume of new closed construction loans increased in 2Q2021 for both senior housing and nursing care as lenders became more comfortable in development activity following four quarters of slowing activity related to the pandemic. Newly closed construction loans jumped 46.7% for senior housing on a same-store quarter-over-quarter basis, the highest recorded quarterly increase since 4Q2017. For nursing care, the same-store quarter-over-quarter growth was even larger at 71.4%, but this was off of a relatively small base. Note that second quarter 2021 data includes construction refinancingsrefinancing for some lenders.
New permanent loan issuance for senior housing increased in 2Q2021, with a same-store increase of 46.3%, the largest same-store quarter-over-quarter increase since 3Q2019. Nursing care permanent loan issuance slipped lower in 2Q2021, hitting its recorded low point since the beginning of the time series in mid-2016. On a same-store quarter-over-quarter basis new permanent loans were down -25.5% in 2Q2021, the largest same-store drop since 1Q2020.
These data are not to be interpreted as a census of all senior housing and skilled nursing lending activity in the U.S., but rather reflect lending activity from participants included in the survey sample only.
The 3Q2021 NIC Lending Trends Report is scheduled for release in early February 2022.
Interested in participating? We very much appreciate our data contributors. This report would not be possible without them. If you would like to participate and contribute your data, please email us at analytics@nic.org. The information provided as part of the survey will be kept strictly confidential. Individual responses will be combined with those of all other respondents. Data acquired from this survey will only be reported in the aggregate, and therefore, the resulting aggregated data will not be attributed to you or your company upon distribution. As a thank you for providing data, data contributors receive this report early before publication on the website.
The 2021 NIC Fall Conference Was a Home Run in Houston
Networking was facilitated during the event with dedicated networking areas. Small groups gathered where NIC placed convenient seating and working areas.
With over 2,400 registrations, the year’s most important senior housing and care conference proved yet again to be a ‘can’t-miss’ event for industry leaders. Despite a lingering pandemic, and strictly observed safety protocols, including required proof of vaccination, as well as hundreds of cancelled flights nationwide, ‘the NIC’ made a triumphant return to in-person networking and thought leadership. Attendees, nearly 70% of whom are in senior executive roles, were, for the first time in 20 months, able to convene to build relationships, make deals, and share the latest data and insights, in person and face-to-face.
Changes to the structure of the event, including the replacement of sit-down table service dining with more flexible, convenient, and safe ‘NIC Market Café’ offerings proved to be popular. Networking was facilitated not only with events, but with large, comfortable dedicated networking areas, featuring passed food and cocktails. Every day, smaller groups could be seen gathering throughout the beautiful Marriott Marquis Houston, where NIC had placed a multitude of convenient seating and working areas suitable for more intimate discussions.
There was no shortage of food, drink, and pampering throughout the event, which took full advantage of the entirety of the beautiful 5-year-old hotel located downtown, just a block from the Houston Astros’ baseball stadium, Minute Maid Park. Some attendees managed to find tickets for Game Six of the 2021 World Series, a coincidental, but, for baseball fans, exciting and memorable treat. Others found time to conduct business poolside, taking advantage of 80-degree sunny days, and a giant Texas-shaped lazy river, as well as an infinity pool with views of the Houston skyline.
A more streamlined program of educational sessions provided attendees both with more time to network, and a more focused program, defined by the most relevant and timely issues facing senior housing leaders today. Sessions were very well attended in a hall featuring a wide variety of comfortable seating options, as well as more productivity-oriented tables set up with ac power outlets and chargers. Many attendees enjoyed sitting in living room-style comfy chairs and couches. Live streaming areas provided additional options to take in the ten-session program. Below are a few highlights and quotes from the sessions, all of which were made available to attendees in high quality video.
As Monday’s first session, “The Investment Market for Active Adult,” kicked off the program, NIC President & CEO Brian Jurutka made a few remarks, saying, “Welcome back!” to a standing room only (but socially distanced) room. The highly anticipated discussion focused on an emerging property type gaining increased interest among investors and developers.
In “Capital for Operations: Aligning Incentives,” a panel of seasoned industry veterans discussed the importance of aligning incentives to manage increased costs, fund growth, and improve operating efficiencies, as well as the value of building relationships with quality operations teams. “The one thing investors know: the quality of services delivered in the facility is directly correlated to the financial performance,” said Brian Beckwith, CEO, Arcus Healthcare Partners.
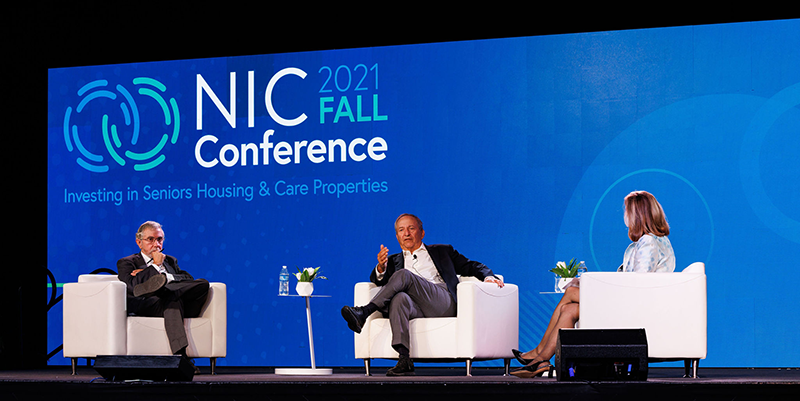
Two of America’s most accomplished and respected economists discussed macroeconomics even as the Federal Open Market Committee (FOMC) was meeting in Washington, DC. In “Macroeconomic and Capital Market Trends: A Conversation with Paul Krugman and Dr. Lawrence H. Summers” Nobel prize-winning economist Paul Krugman and Former Secretary of the U.S. Treasury Dr. Lawrence H. Summers delivered a master class, and a few opposing, but enlightening, views, on the state of the U.S. economy to kick off another day of relevant, actionable insights at ‘the NIC.’
Both economists appeared concerned about the prospect of high inflation rates as they debated the impact of likely Federal Reserve Board responses. NIC has released a short video of the exchange on its LinkedIn and Youtube accounts, and every registrant is being provided with access to every session’s complete video recording.
The “Policy Impact and Outlook: A Conversation with Industry Leaders” session focused on policy with leaders of the industry’s key associations. “Overwhelmingly, COVID has not had an impact on the consumer’s likelihood to move into one of these communities. I think it is a testament to [our] ability to get out there and change the perception of what was really happening in these buildings,” noted the President of the American Senior Housing Association, David Schless.
As the sector is beginning to experience anticipated occupancy growth, NIC brought a panel of experts together to discuss recovery. “Demand at your Doorstep: Who is Recovering Faster and Why?” featured a presentation of the very latest data and analysis from NIC Senior Principal, Lana Peck, revealing that, while a recovery does appear to be on the horizon, not everyone will necessarily get there at the same time.
Despite acknowledging challenges, the panel provided plenty of reason to view the sector positively. “If you look at this industry, it was created for a need to take care of the elder population. That’s not going to change. There is a need for this product,” Sunday said, adding, “This industry has proven that it comes out stronger after disruptions.”
NIC’s middle day of sessions concluded with “Debt Market Trends and The Pace for Deal Making.” Lee Delaveris, Vice President, KeyBank Real Estate Capital; Imran Javaid, Managing Director, BMO Harris Bank; Kelly Sheehy, Principal and Managing Director, Artemis Real Estate; and moderator Aaron Becker, Senior Managing Director, Lument; discussed their expectations for inflation and interest rates, the pace of deal making in today’s market, how to look at performance, and the increased demand for bridge products.
The third and final day continued to draw attendees into three final sessions. Robert Kramer, Co-Founder & Strategic Advisor, NIC, and Founder & Fellow, Nexus Insights, began the “Rethinking Community: Places That Will Attract Future Older Adults” session with his observations on how and why the industry must adapt to meet the needs and expectations of a new generations of older adults. On the emerging active adult segment, he said, “Senior housing is care driven…a push market…you’re pushed into it because of your health. Active adult is a pull market.”
Following NIC Senior Principal Ryan Brooks’ presentation of the latest data on the ‘forgotten middle,’ innovators in the space discussed how they are developing solutions, in “Solving for the ‘Forgotten Middle’ Market.”
Tana Gall, President, Merrill Gardens and Truewood by Merrill, and Pilar Carvajal, CEO & Founder, Innovation Senior Living, shared how they are delivering care at reduced cost, renovating or repurposing existing buildings, achieving economies of scale, and more.
NIC concluded the final day of sessions with an entertaining, yet highly informative, take on the popular ‘Weekend Update’ segment of Saturday Night Live. “Property Valuations for Seniors Housing and Skilled Nursing,” featured co-hosts Ben Firestone, Executive Managing Director & Co-Founder, Blueprint, and Zach Bowyer, Managing Director, JLL, and a number of experts, all of whom came up to the stage one by one for ‘interviews’ on their particular perspectives.
Despite concerns over labor, Bowyer reflected a general sense of optimism, which could be felt through the entire program of educational sessions, and many discussions in hallways and meeting rooms. He said, “From an operational standpoint, the industry has transitioned from emergency response to recovery. Stabilized occupancy is rebounding. We’re seeing resurgence of demand, strong economic growth, and strong home sales.” Predicting occupancy rate re-stabilization within the next couple of years, he said, “that’s light at the end of the tunnel.”
Even as some attendees return home, NIC is planning its next major event, the 2022 NIC Spring Conference, to be held March 23–25, 2022, in Dallas, TX. Sign up to be notified when registration opens.
Subscribers to the NIC Insider and this blog will be able to read more in-depth articles and posts on key themes and discussions which occurred at the 2021 NIC Fall Conference. Subscribe today!
CCRC Care Segment Performance 3Q 2021
We examine current conditions and yearly changes in inventory, occupancy, and same-store asking rent growth by egments within CCRCs compared to non-CCRC
The following analysis examines current conditions and year-over-year changes in inventory, occupancy, and same-store asking rent growth—by care segments within CCRCs (CCRC segments) compared to non-CCRC segments in freestanding or combined communities to focus a lens on the relative performance of care segments within CCRCs during the third quarter of 2021.
NIC MAP® data, powered by NIC MAP Vision, tracks occupancy, asking rents, demand, inventory, and construction data for independent living, assisted living, memory care, skilled nursing, and life plan communities (CCRCs) for more than 15,000 properties across 140 metropolitan areas. NIC MAP data currently tracks 1,188 not-for-profit and for-profit entrance fee and rental CCRCs in these 140 combined markets (1,112 in the 99 combined Primary and Secondary Markets).
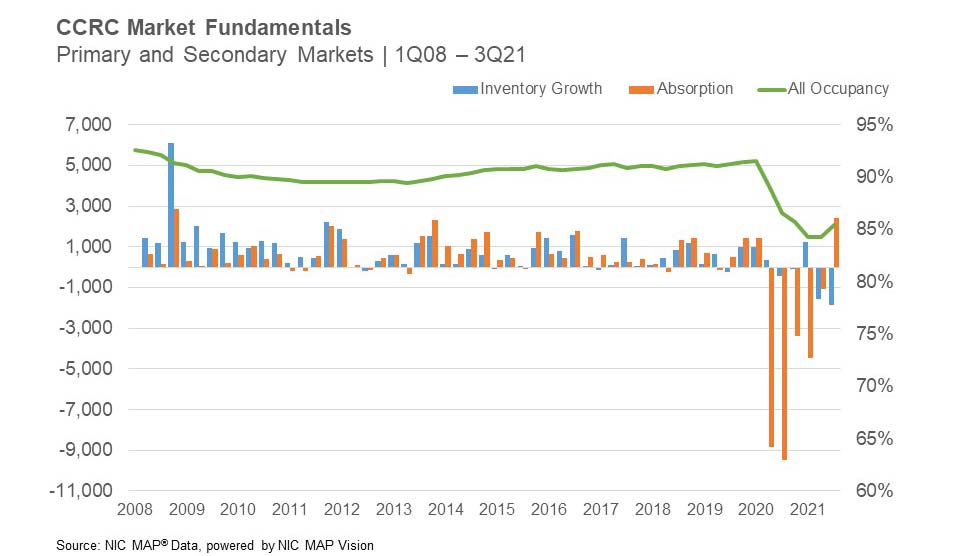
3Q 2021 CCRC Market Fundamentals
After five quarters of negative absorption (change in occupied stock or a measure of demand) during the pandemic, CCRC unit absorption rebounded in the third quarter of 2021 to the strongest pace since 4Q 2008. This (and negative inventory growth) helped push occupancy up to 85.4%, which is 1.1 percentage points above its pandemic period low during the previous quarter, but still 6.2 percentage points below its pre-pandemic occupancy rate in the first quarter of 2020 (91.6%).
Non-CCRC occupancy averaged 77.1% in 3Q 2021—8.3 percentage points lower than CCRC occupancy. On a year-over-year basis, entrance fee CCRC occupancy (88.0%) was 6.9 percentage points higher than rental CCRCs (81.1%), and not-for-profit CCRC occupancy (87.0%) was 6.0 percentage points higher than for-profit CCRCs (81.0%).
CCRCs vs. Non-CCRCs: Care Segment Detail
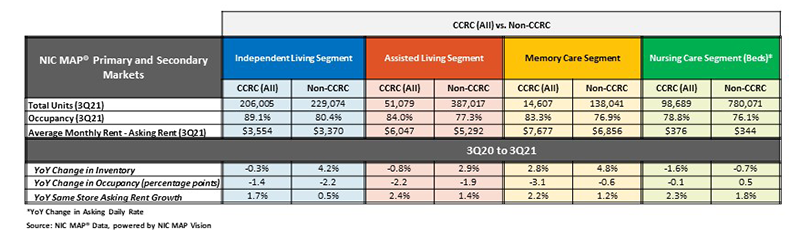
The table below compares each of the care segments—independent living, assisted living, memory care and nursing care—in the Primary and Secondary Markets tracked by NIC MAP Vision. The table shows the 3Q 2021 total open units, average occupancy, average monthly asking rent—and year-over-year changes for CCRCs and non-CCRCs.
CCRCs: Stronger Occupancy and Rent Growth, Weaker Inventory Growth Than Non-CCRCs
The CCRC independent living care segment had the highest 3Q 2021 occupancy (89.1%), followed by CCRC assisted living and memory care (84.0% and 83.3%, respectively). The difference in 3Q 2021 occupancy between CCRCs and non-CCRCs was the highest for the independent living segment (8.7 percentage points), and the lowest for the nursing care segment (2.8 percentage points).
The highest year-over-year asking rent growth was in the CCRC assisted living segment, followed by nursing care and memory care (ranging from 2.4% to 2.2%). The lowest was noted for non-CCRCs in the independent living care segment (0.5%). Note, these figures are for asking rates and do not consider any discounting that may be occurring.
Negative inventory growth was reported for CCRCs in the independent living, assisted living and nursing care segments. CCRCs have had historically lower rates of inventory growth (year-over-year change in inventory) by segment than non-CCRCs. Negative inventory growth can occur when units/beds are temporarily or permanently taken offline or converted to another care segment outweigh added inventory. The highest year-over-year inventory growth was reported for the non-CCRC memory care and independent living care segments (4.8% and 4.2%, respectively).
All the New CCRC Units Under Construction are in Five Markets
Comparatively very little development of CCRCs has occurred in recent years (the median age of CCRCs is 35 years). Approximately 60% of existing CCRC units in the Primary and Secondary Markets are at properties that have been developed since 1980.
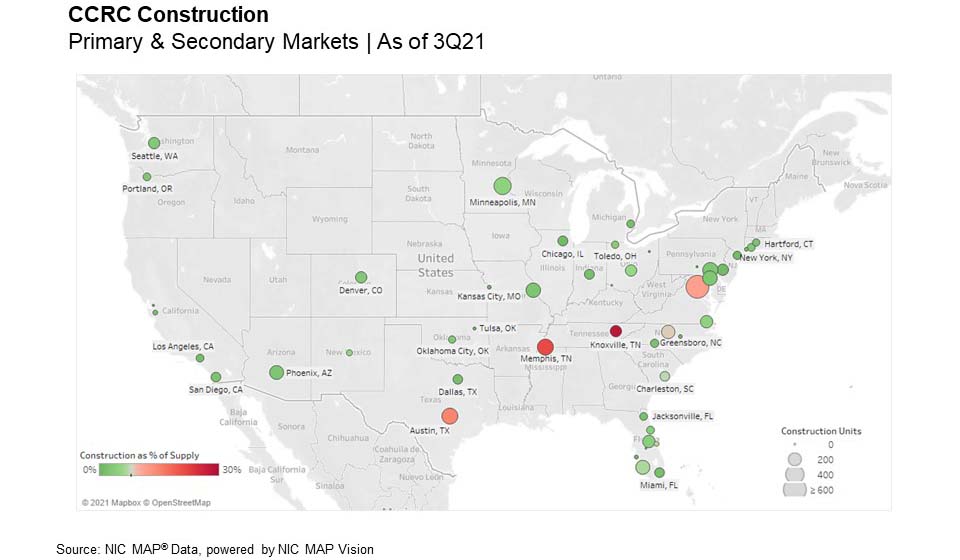
As shown below, considering all CCRC units under construction (both new and expansion units, not-for-profit and for-profit) 76% are located in four markets: Washington D.C., Austin, Memphis, and Knoxville. Construction as a share of existing inventory is highest in two Tennessee markets: Knoxville (29% or 149 units) and Memphis (21% or 299 units).
Setting aside expansion projects, the share of new CCRC units under construction in the Primary and Secondary Markets was 39% in 3Q 2021, (61% are expansions on existing properties). All the new CCRC units under construction are located in just five markets: Washington D.C., Memphis, Minneapolis, Baltimore, and Orlando. Nearly three-quarters of for-profit new CCRC construction (71% or 1,400 units) and one-half of not-for-profit new CCRC construction is in Washington, D.C. (51% or 378 units).
Look for future blog posts from NIC to delve deep into the performance of CCRCs.
Interested in learning more?
To learn more about NIC MAP data, powered by NIC MAP Vision, and about accessing the data featured in this article, schedule a meeting with a product expert today.
*This blog was originally published in Ziegler Investment Banking, Senior Living Finance Z-News.
Stronger Employment Report : October Jobs Up By 531,000
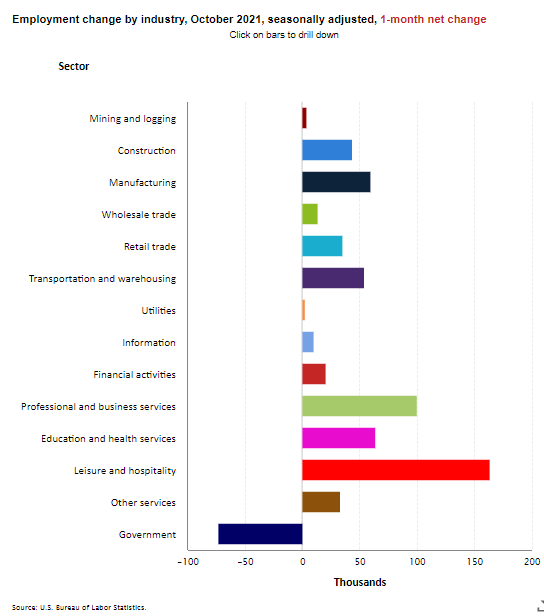
The Labor Department reported that nonfarm payrolls rose by 531,000 in October 2021. The consensus had been for an increase of 312,000. This was an acceleration from September when jobs grew by an upwardly revised 312,000 (originally reported as 194,000) and from August when jobs increased by 483,000, up from 366,000 as originally reported.
The Labor Department reported that nonfarm payrolls rose by 531,000 in October 2021. The consensus had been for an increase of 312,000. This was an acceleration from September when jobs grew by an upwardly revised 312,000 (originally reported as 194,000) and from August when jobs increased by 483,000, up from 366,000 as originally reported. Through October, the year-to-date monthly average job gain has been 582,000. Nonfarm payrolls have now increased by 18.2 million since its pandemic trough in April 2020 but are still down by 4.2 million or 2.8% from their pre-pandemic level in February 2020.
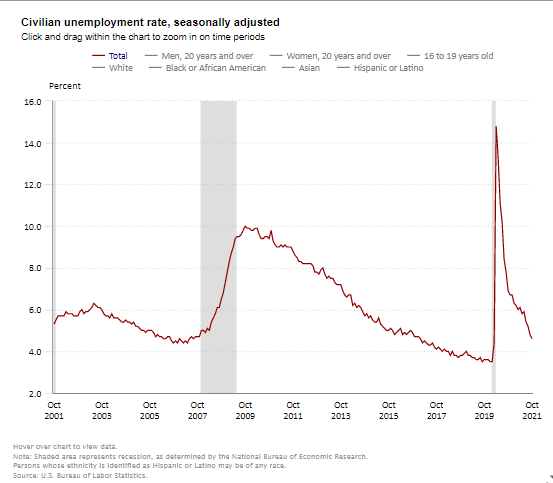
Separately and from a different survey, the Labor Department reported that the supply of labor as measured by the labor force rose by a muted 104,000 in October, well short of population growth. With the household measure of employment rising by 359,000, the jobless rate fell to 4.6% from 4.8% in September. The labor force is 3.0 million below the February 2020 level. Many had speculated that the labor force would increase since enhanced unemployment benefits had largely expired, and schools largely reopened. The jobless rate is now 1.1 percentage points above the pre-pandemic level of 3.5% seen in February 2020, but well below the 14.7% peak seen in April 2020.
The underemployment rate or the U-6 jobless rate was 8.3% down from 8.5% in September 2021. This figure includes those who have quit looking for a job because they are discouraged about their prospects and people working part-time but desiring a full work week.
The data show that the U.S. recovery from the pandemic continues. The COVID-19 Delta variant likely weighed on the economy in August and September as lower job numbers suggested. Employment in the leisure and hospitality industry increased by 164,000 in October and has risen by 2.5 million thus far in 2021, but it is still down by 1.4 million or 8.2% from February 2020.
Health care added 37,000 jobs in October with most of the gain occurring in home health care services (up 16,000) and nursing care facilities (up 12,000). Employment in the broad health care sector is down by 460,000 since February 2020.
Today’s report is important as the Federal Reserve wants to see “substantial progress” in the economy as it shifts monetary policy and notably today’s report is important because it gives the Fed a gauge on the path of wage growth and inflation.
Indeed, average hourly earnings for all employees on private nonfarm payrolls rose by $0.11 in October to $30.96, a gain of 4.9% from a year earlier, the strongest year-over-year gain February 2021. With the mix of job gains in October skewed towards low-wage workers, the 4.9% gain may be understating wage growth. The data suggests that rising demand for labor associated with the recovery from the pandemic is putting upward pressure on wages.
Soon after their Federal Open Market Committee meeting (FOMC) in Washington D.C. this week, the Fed announced that they are ready to shift gears and are relaxing their aggressive bond buying program, a necessary precursor to allow the Fed to increase interest rates more freely when and if they view inflation as too serious a threat to stable economic growth. Moving too fast on an interest rate increase could crush the path of economic growth and moving too slowly could cause inflation to become embedded in the economy. Such a discussion has not been the focus of policy makers and pundits for more than 30 years.
We use cookies on our website to give you the most relevant experience by remembering your preferences and repeat visits. NIC's privacy policy can be viewed here. By clicking “Accept”, you consent to the use of ALL the cookies.
This website uses cookies to improve your experience while you navigate through the website. Out of these cookies, the cookies that are categorized as necessary are stored on your browser as they are essential for the working of basic functionalities of the website. We also use third-party cookies that help us analyze and understand how you use this website. These cookies will be stored in your browser only with your consent. You also have the option to opt-out of these cookies. But opting out of some of these cookies may have an effect on your browsing experience.
Necessary cookies are absolutely essential for the website to function properly. This category only includes cookies that ensures basic functionalities and security features of the website. These cookies do not store any personal information.
Functional cookies help to perform certain functionalities like sharing the content of the website on social media platforms, collect feedbacks, and other third-party features.
Performance cookies are used to understand and analyze the key performance indexes of the website which helps in delivering a better user experience for the visitors.
Analytical cookies are used to understand how visitors interact with the website. These cookies help provide information on metrics the number of visitors, bounce rate, traffic source, etc.
Advertisement cookies are used to provide visitors with relevant ads and marketing campaigns. These cookies track visitors across websites and collect information to provide customized ads.