Relatively Weak September Employment Report: Jobs Up by 195,000
The Labor Department reported that nonfarm payrolls rose by a disappointing 195,000 in September 2021. The consensus had been for an increase of 500,000. This was a deceleration from August when jobs grew by an upwardly revised 366,000 (originally reported as 235,000) and from July when jobs increased by 1,091,000, up from 1,053,000 as originally reported.
The Labor Department reported that nonfarm payrolls rose by a disappointing 195,000 in September 2021. The consensus had been for an increase of 500,000. This was a deceleration from August when jobs grew by an upwardly revised 366,000 (originally reported as 235,000) and from July when jobs increased by 1,091,000, up from 1,053,000 as originally reported. The three-month moving average of nonfarm payrolls was 550,000 as of September, versus 806,000 in August and 889,000 in July, still strong but signaling some slowing in momentum. Nonfarm payrolls remain down by 5.0 million from pre-pandemic levels of February 2020.
Interestingly, the labor force contracted by 183,000 and was 3 million less than at its pre-pandemic level. Many had speculated that the labor force would increase since enhanced unemployment benefits had largely expired and schools largely reopened.
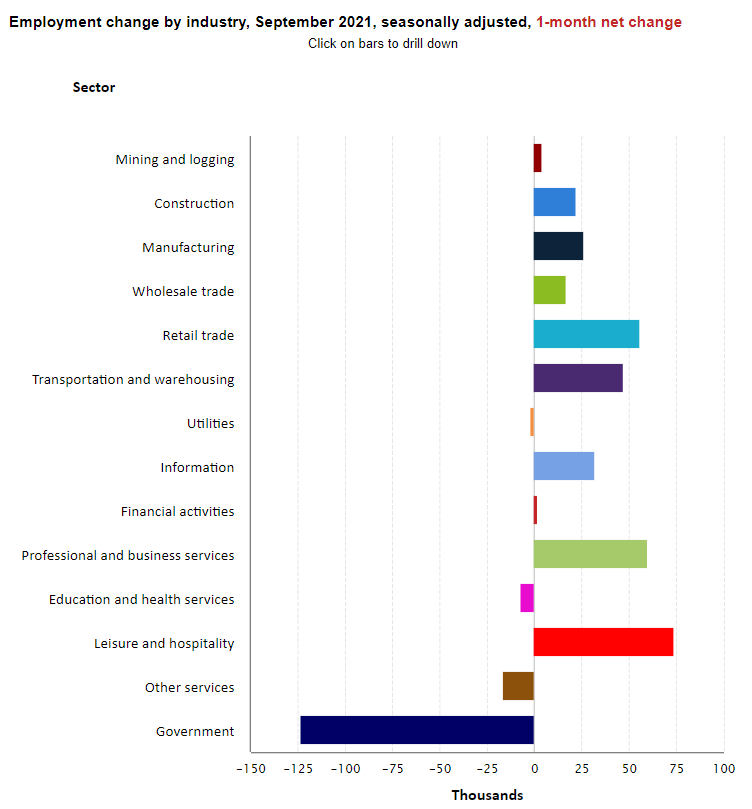
The data show that the U.S. recovery from the pandemic continues, but at a slower pace. The COVID-10 Delta variant may be weighing on the economy as evidenced by the limited growth in the high-contact leisure and hospitality sectors (up only by 74,000) which had been expanding rapidly prior to August. Businesses may be holding off hiring and workers may be holding off taking jobs amid heightened fear of the Delta variant.
Today’s report is important as the Federal Reserve wants to see “substantial progress” in the economy before it shifts monetary policy and begins “tapering” when it will purchase fewer long-term securities for its balance sheet and before it starts to shift toward a higher interest rate regime. While disappointing from what the markets had anticipated, the report is likely strong enough that the Fed will begin tapering its asset purchases next month. That said, the growing evidence of upward pressure on wages suggests that the Fed will remain concerned about inflationary pressures.
Indeed, average hourly earnings for all employees on private nonfarm payrolls rose by $0.19 in September to $30.85, a gain of 4.6% from a year earlier and up from a revised 4.3% in August. September marked the fifth consecutive month of increases. The data suggests that rising demand for labor associated with the recovery from the pandemic is putting upward pressure on wages. The large annual increase also occurred despite the return of lower-wage leisure and hospitality workers which theoretically should be depressing the overall increase. That said, the Labor Department warns that the pandemic has affected the ability to fully interpret the wage data due to the wide swings in employment trends.
Job levels continued to contract for nursing and residential care facilities which fell by 38,000. Overall employment in health care is down by 524,000 since February 2020, with nursing and residential care facilities accounting for about 80% of that loss.
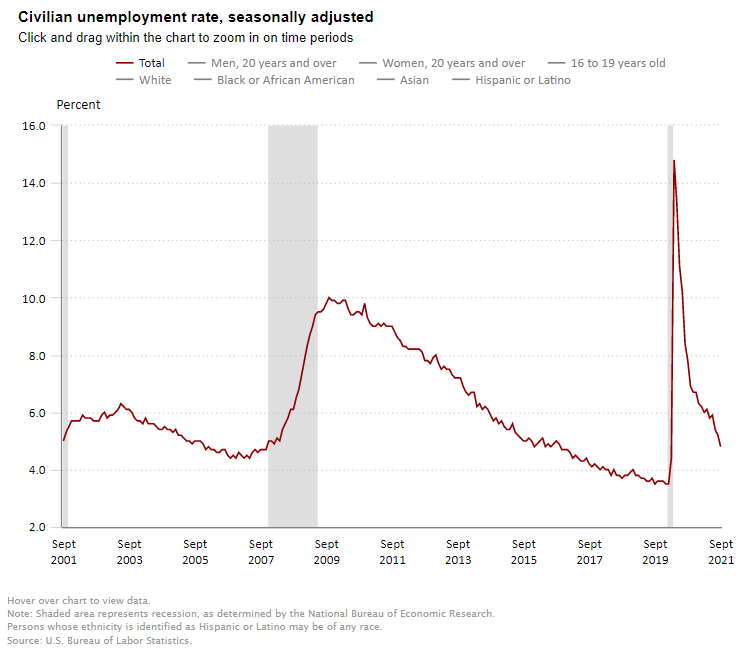
Separately and from a different survey, the Labor Department reported that the unemployment rate fell by 0.4 percentage point to 4.8% in September and the number of unemployed persons fell to 7.7million, still higher than the 5.7 million persons prior to the pandemic. The jobless rate is now 1.3 percentage points above the pre-pandemic level of 3.5% seen in February 2020, but well below the 14.7% peak seen in April 2020. The underemployment rate or the U-6 jobless rate was 8.5% down from 8.8% in August 2021. This figure includes those who have quit looking for a job because they are discouraged about their prospects and people working part-time but desiring a full work week.
Looking Forward and Looking Up: A Conversation with LTC’s Wendy Simpson
For the first time in a while, Wendy Simpson, chairman and CEO at LTC Properties, is looking forward to the next earnings call for the publicly traded REIT. Business is looking up at the Westlake Village, California-based company after a difficult year for the entire industry.
For the first time in a while, Wendy Simpson, chairman and CEO at LTC Properties, is looking forward to the next earnings call for the publicly traded REIT. Business is looking up at the Westlake Village, California-based company after a difficult year for the entire industry.
NIC Chief Economist Beth Mace recently talked with Simpson about LTC’s approach to financing solutions. They discussed the last 18 months and the outlook for LTC and the industry. Overall, Simpson is optimistic. Why? She credits LTC’s employees, its board of directors, the stability of its balance sheet, and the dedicated people throughout the industry who stepped forward in a crisis.
Here’s more detail in a recap of their conversation:
Mace: LTC Properties is a real estate investment trust (REIT) investing in seniors housing and health care primarily through sale-leasebacks, mortgage financing, joint ventures, construction financing and structured finance solutions including preferred equity, bridge, and mezzanine lending. How does your structure as a REIT better position you than other lenders and private equity groups in financing solutions for both senior housing and skilled nursing properties?
Simpson: We strive to provide options for our operators. The best way to understand our approach is to contrast it with other sources. Unlike private equity, LTC is a long-term holder. We’re not looking to recycle an asset in 5-7 years. Our rates are generally lower than private equity because we’re not looking for a residual value. We strive to have assets that appreciate, but the value appreciation is greatly enhanced by the performance of the operator. Contrasting LTC to banks, they are often the first to step back when a sector has problems. And we haven’t stepped back from these asset classes. We keep a solid balance sheet so we can offer structured financing solutions. When banks step back, we sometimes can salvage the deal. We have different goals than other possible financing sources. We hope to be the solution for the operators’ financial goals and structures.
Mace: Many REITS have embraced RIDEA structures (an acronym that stands for the REIT Investment Diversification and Empowerment ACT) where REITs can participate in the actual net operating income if there is an involved third-party manager. Most of your structures at LTC are triple net leases (NNN) with annual rent payments and escalations, and joint ventures (JVs) as opposed to RIDEA structures. Why is this?
Simpson: Early on, when RIDEA emerged as a structure, we ran some acquisition options, and we couldn’t understand why investors in the RIDEA structure were paying real estate multiples for the operations. We did understand that the upside was the ability to invest in an underperforming asset and benefit from the addition of a quality operator. To do that, an investor needs people who understand operations and we didn’t have anyone with operations experience. You really have to delve into operations to be part of the RIDEA structure. We would have had to hire people and carry that overhead to make a big investment in RIDEA. Historically, we haven’t been big enough to have a concentration in this new line of business. Also, I’m a firm believer that operators have more incentive if the bottom line is all theirs. We just don’t see the same incentive in the RIDEA structure for the operators.
Mace: The industry has been challenged during the pandemic, but throughout the crisis, it has stepped up to the myriad problems ranging from securing PPE in the early days of March 2020 to the recognition of the importance of socialization even during periods of physical distancing to the distribution of vaccines in December 2020. Unlike some industries, it never closed. It has shown itself to be responsive, flexible adaptable, and proactive. What types of challenges have you incurred during these turbulent times? And what creative financing solutions has LTC implemented for your clients and prospective clients?
Simpson: From our point of view our challenge was revenue insecurity. Operators had massive issues. We established connections with operators to find PPE and share the status of government relief programs. We were a cheerleader to provide rent abatements and other deferrals for operators. We also stepped up financially to support our operators by providing a level of rent abatement in 2021 which gave them additional cash to help defray the costs of the impact of the pandemic. We’re pleased with the opportunities we see in shorter-term financing and bridge lending as we ramp up revenues from the properties with new operators. Inside LTC, we were able to work virtually, so we didn’t miss a step on auditing or quarterly reports.
Mace: LTC Properties was established in 1992. You joined the company in 2000 and took the helm as CEO and President in 2007 and were appointed Chair of the Board in 2013. How has LTC changed in those years? What are you most proud of?
Simpson: We began in 1992 as a skilled nursing home lender providing mortgages for skilled nursing homes. Our founder Andre Dimitriadis said it was like shooting fish in a barrel. No one else was lending in the space except banks and they were lenders, not investors. More healthcare REITS were established in the mid-1990s and LTC began buying, developing, and investing in assisted living assets and operators. For most of our history, we’ve been equity investors in skilled nursing and private pay senior housing. In 2022, we’re looking to invest more dollars in financing vehicles as a nod to our early history. What I’m most proud of is our employees and board. We have a meeting coming up and I have a chart showing employment history. I lead the chart since I had a 1995 board position and became an employee in 2000. Our average tenure is 10 years, pulled down only by some great recent hires. Financially, I’m most proud of our balance sheet. While it’s nail biting right now, we have maintained and not cut our dividends during this period of stress in the industry. Even though we have remained small, we’re stable and secure. We’re open about the challenges we’ve had with our operators, but we’ve worked with them and kept our shareholders and market analysts informed.
Mace: As the leader at LTC, what does the future look like?
Simpson: For the first time in six quarters, I’m somewhat looking forward to our earnings call in October. I think we have a pretty bright 2022. It’s nice to be looking up and 2022 seems like a much better year.
Mace: Are you optimistic for the recovery of the sector in the remaining part of 2021 and into 2022?
Simpson: I‘m optimistic. It’s amazing what people did during the ravages of the pandemic. How can you not be optimistic when you are working with people like that?
Mace: What are some of the challenges that need to be overcome? Anything keep you up at night?
Simpson: Another variant or wave of COVID-19 would slow the recovery. If there was another variant the industry has the protocols to stem the amount of damage that might be done. I don’t think it would be like 2020, but it would slow the recovery. I also worry about our operators being able to get staff. It’s universal. I haven’t talked to an operator yet that doesn’t have trouble getting and retaining staff. And it’s not about money. Many places are paying $15 an hour. I hope with the expiration of the extra $300 in unemployment and the opening of school that people will come back to work. There’s still some insecurity relative to childcare because parents worry that schools might close.
Mace: Anything else you’d like our readership to know about LTC?
Simpson: LTC does well bonding with operators. We really want to get to know them and be part of their culture. We’re not just providing structured finance products. Our operators see us as partners that they can work with. That’s important for people to know. We want to be part of the financing solution.
How Did Senior Housing Properties Perform over the Past Year? Occupancy Migration from 2Q20 to 2Q21
The highest performing senior housing properties in 2Q20, as measured by occupancy, generally remained highly occupied a year later, while properties with the lowest occupancies in 2Q20 tended to remain in the bottom.
Summary.The highest performing senior housing properties in 2Q20, as measured by occupancy, generally remained highly occupied a year later, while properties with the lowest occupancies in 2Q20 tended to remain in the bottom.
Properties in the middle of the pack in 2Q20 saw large drops
in occupancy over the one-year course of the pandemic studied in this analysis and had not shown signs of recovery as of 2Q21.
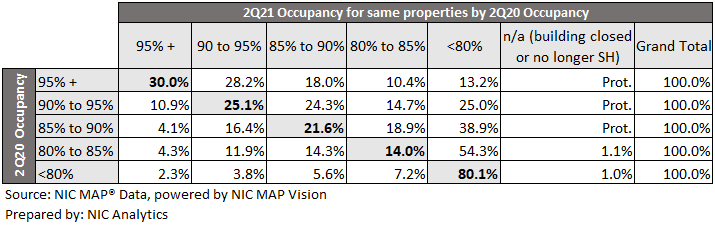
Methodology.We categorized seniors housing properties in the NIC MAP® Primary Markets that were open in 2Q20 and 2Q21 into occupancy cohorts to investigate how properties in different categories performed over the last year. The property count for this analysis totaled 5,072 properties. Notably, some properties closed since 2Q20, some are no longer seniors housing, or were temporarily under renovation in 2Q21. Those properties are captured in the n/a column in the table below. Rows in the table below represent the occupancy band of the corresponding properties in 2Q20 and the columns represent their 2Q21 band.
Highly occupied properties in 2Q20 tended to be highly occupied in 2Q21. Of the group that were 95%+ occupied in 2Q20, 30.0% were in that same occupancy band for 2Q21 and 28.2% were in the 90% to 95% category. This suggests that the high property level performers in 2Q20 tended to be fairly resilient (or did take occupancy hits but still were able to recover). However, even for that 95%+ cohort in 2Q20, 41.6% dropped to below 90% in 2Q21, so that group of properties wasn’t completely protected from pandemic-related occupancy declines with 13.2% slipping into the under 80% occupancy group.
Of the 340 properties that were at or above 95% occupancy in 2Q20 and 2Q21, two thirds of this group were majority assisted living properties, with the remaining one third being majority independent living. The average age of these properties was 26.4 years in 2Q21. The average size of these properties was 126 units, which is nearly the same as the average property size of seniors housing in the NIC MAP Primary Markets (128 units). The top 5 metros in which these 340 properties were located included New York (26 properties, 8.2% of open properties in the New York metro in 2Q20), Portland (23, 12.1%), Los Angeles (22, 6.9%), Minneapolis (22, 8.1%), and San Francisco (21, 13.5%).
Of the 320 properties that were at or above 95% occupied in 2Q20 but dropped to between 90% and 95% in 2Q21, the average property age was 25.1 years old, and the average unit count was 162 units in 2Q21. Of this group 57% were majority assisted living and 43% were majority independent living. The top 8 metros these properties were located in included New York (24), Detroit (22), Minneapolis (20), Chicago (20), and San Francisco, Seattle, and Washington (17 each).
Of the 149 properties in that were in the 95%+ group in 2Q20 but declined to below 80% in 2Q21, the majority were majority assisted living (87%) with only 13% being majority independent living. The average property size was smaller at 91 units and the average age of property was 23 years old. Los Angeles was the metro area that had the most properties that dropped from the 95%+ group to the <80% group at 18 properties. The other four metros in the top five were Chicago (15 properties), Dallas (11), Miami (10) and San Francisco (7).
The middle of the pack in 2Q20 took some hits and haven’t quite recovered yet. For both the 85% to 90% and the 80% to 85% groups in 2Q20, the biggest shifts were into the < 80% category in 2Q21. The average age of property for the 313 properties in the 85% to 90% cohort that dropped into the < 80% group was 24.1 years in 2Q21 and the average property size was 116 units. For the 341 properties in the 80% to 85% cohort that dropped into the < 80% group the average age was 23 years old and the average unit count was 132 units. The 80% to 85% cohort that dropped to < 80% only had a 1% increase in inventory from 2Q20 to 2Q21 and the 85% to 90% cohort had less than 1%, so the declines in occupancy were due to negative absorption as a result from the pandemic rather than inventory growth from expansions.
Properties with low occupancy in 2Q20 tended to continue to have low occupancy in 2Q21. Of the <80% cohort in 2Q20, 80.1% of those properties remained in the under 80% cohort in 2Q21, continuing to struggle. Only a mere 2.3% of the <80% in 2Q20 cohort managed to grow occupancy to 95%+.
Of the 1,145 properties that were in the <80% group in 2Q20 that stayed in the <80% group in 2Q21 had an average age of 18 years, partially reflecting that properties that were still in lease up in 2Q20 most likely fell into this category. The average property size of this group was 115 units. They were also primary majority assisted living (80% of the properties) with only 20% being majority independent living. This group only had a mere 0.3% of inventory growth so inventory growth was not a contributing factor to these properties remaining low.
Removing the group of properties in the <80% group in both 2Q20 and 2Q21 that were under 2 years old in 2Q20 and looking only at the subgroup of properties that would meet NIC’s definition of stabilized in both 2Q20 and 2Q21, the occupancy of those properties dropped from 68.6% in 2Q20 to 64.6% in 2Q21. This shows that this group of properties is continuing to struggle in 2021.
Conclusions. Many of the highly occupied properties in 2Q20 were still highly occupied in 2Q21 and many of the lower occupied properties in 2Q20 still had low occupancy in 2Q21. Many properties in the middle bands for occupancy suffered occupancy declines and have not yet begun to recover.
Wipfli and Mueller Prost Combine Teams, Expand Healthcare Services
Wipfli and Mueller Prost, two accounting and consulting firms known for their specialized healthcare services, announced in June that they were combining into a single firm.
Top 20 firm helps turn obstacles into opportunities.
To learn about the direction of the growing firm, Ryan Brooks, NIC senior principal, healthcare strategy, recently talked with three Wipfli healthcare service leaders: Tiffany Karlin, partner, consulting services and director of healthcare; John Oeltjen, partner, risk management services; and Shasta McClary-Brocious, healthcare billing supervisor and reimbursement consultant.
Here’s a recap of that conversation:
Brooks: As an organization focused on providing assurance, accounting, tax, and consulting solutions, can you tell me about the range of services that you provide specifically for senior living providers?
Karlin: I’d like to answer that question by pointing out three key services we’re providing – and how we’re different from other firms.
First, we provide core services, starting with tax and accounting services. But our core services, along with our of our consulting services, are provided by healthcare specialists with a deep understanding of the senior living and skilled nursing industry.
That specific experience and knowledge means we’ve also been able to handle back-office services, such as billing, accounting, Medicare and Medicaid cost reports, and CFO duties for healthcare clients. We have teams specialized in these services, and our expertise runs deep.
Second, our M&A consultants are helping healthcare leaders navigate the changing merger and acquisition market. We focus heavily on business valuation and transition, and succession planning which involves everything from due diligence and negotiations to helping source buyers from Wipfli’s connections in private equity. Our new, expanded team also includes associates from Wipfli Financial Advisors and Wipfli Corporate Finance. They all work together to maximize financial results and minimize risk.
Third, we’re entering a world of reimbursement optimization with value-based payments. Operators of skilled nursing, assisted living, continuing care, and affordable housing properties are asking what the future will look like and whether they’re positioned correctly. We focus on the full continuum of care, including FQHC health clinics, hospitals, home health, hospice. So, we can consult on partnership opportunities, operations, clinical matters, and financial considerations.
Brooks: Wipfli has expanded the firm several times over the last two years. Can you tell our readers what’s next and how Wipfli leaders are positioning for additional growth?
Karlin: Wipfli has always had a strong strategy of going to market by industry, recognizing that our clients don’t need cookie cutter, off-the-shelf solutions. Wipfli’s teams understand the nuances between manufacturing, tribal casinos, nonprofit organizations and — of course — healthcare, to name a few. The business intelligence, accounting, compliance or cyber needs, for example, are so different for every industry and that need for specialized knowledge is only increasing with all the new challenges due to the pandemic.
Oeltjen: We’ve already seen a lot of excitement among our clients because now with Wipfli we can offer a greater depth and breadth of services. And that holds true in the M&A arena. More and more clients want additional business services. For example, we might be conducting due diligence as part of the M&A service, but the client may ask us to look at whether the billing systems and processes are reliable. Our organizational performance specialists were able to evaluate one client’s ability to change as part of our due diligence. It’s not that expensive and it’s often overlooked when a deal is being done, but it’s the type of assessment our team performs all the time.
Brooks:What changes do you see in the merger and acquisition market for healthcare? How are these changes affecting the services you provide?
Oeltjen: Even before the pandemic started, more venture capital, private equity funds and institutional investors were trying to determine how they can be more active in healthcare and, in particular, the senior healthcare arena. The pandemic slowed the process a bit, but now investors are back. They see a tremendous opportunity to help drive profits in the healthcare space by differentiating services through technology and new methods of service delivery.
Karlin: Nonprofits are looking at consolidation and partnerships too. My East and West coast clients wonder whether large health centers will be a thing of the past, though the Midwest is still focused on this model. Also, home health was already popular with investors before the pandemic. Entrepreneurs see what’s going on and want to be in that market. As a good business partner it is our responsibility to help our clients but also to point out how they need to be prepared. Do they have an administrator who knows how to operate this business? Do they understand the market? We sit down with them to assess the risk before they dive in.
Brooks: Are you seeing a greater demand for due diligence services considering the COVID-19 pandemic?
Oeltjen: Yes, there has been an uptick in demand, the amount of new activity has been significant compared to past years. That being said, COVID-19 has slowed the demand for due diligence services. There was latent demand and now investors think capital gains tax rates will go higher. The deal pace is explosive, along with a general increase in the sophistication of investors in this market.
Karlin: There has been a pause due to COVID-19 as operators waited to see if more government support would be forthcoming from the Provider Relief Fund (PRF). They wondered if they should sell now or see if they would get more help. There is another consideration. Operators must hold the monies from the PRF and Paycheck Protection Program (PPP) until it is forgiven. A change in ownership raises the question of who gets the money when it’s needed to care for residents and expenses are rising. Changing rules have created a lot of chaos. For example, a client acquired a property in 2019 but the Tax ID # still listed the previous owner. Technically, the new owner can’t have the money even though he operated the property all of 2020. Those are extreme challenges. It’s rather complicated and there are a lot of unknowns about how to get a deal done under those circumstances, causing healthcare leaders to consider hiring firms like ours, with expertise in regulations.
Brooks: Prior to the COVID-19 pandemic, Wipfli conducted an analysis on the impact ICD-10 coding played in the new Patient-Driven Payment Model (PDPM) for skilled nursing providers. CMS has delayed PDPM adjustments until 2023, but what should skilled nursing providers know now prior to these adjustments being implemented? What should they be preparing for?
McClary-Brocious: I’ve been talking with quite a few providers. From a clinical perspective, it’s all about documentation. We have to make sure documentation is being completed and reviewed. Documentation has to capture all of the changes being made to the Minimum Data Set (MDS) process. Providers need to conduct their own due diligence internally and make sure their documentation supports all the ICD-10 codes now being reported on the MDS.
The other thing to consider is benchmarking. Compare the facility to the surrounding market and the national market. Is the facility accepting patients at the same acuity level as other facilities? Is the facility accepting higher acuity patients to maximize reimbursement? A comparison provides a better understanding of whether any adjustment in PDPM could impact the facility.
Also, looking again at documentation, studies from CMS show a 30% drop in therapy overall. Group therapy minutes grew 30% and then leveled off with COVID-19 because of social distancing. CMS did recognize that patient care didn’t suffer from this reduction in minutes. But we’ve been putting specific codes on claims to let CMS know that it was a COVID-19-related claim. That will make it easier for CMS to pull those dates of service and conduct post payment audit reviews, which is when the agency will request that documentation. So, now is the time to make sure everything is in order before CMS conducts an audit.
Lastly, providers need to re-examine their therapy contracts. PDPM shifted the whole payment system. We are no longer looking at volume-based care. It’s now all value-based care. Therapy contracts have to be based on value.
Brooks: CMS revised their survey process to ensure skilled nursing properties are properly prepared to respond to the COVID-19 crisis. What are the biggest concerns for skilled nursing properties regarding survey and certification issues? What is the value of bringing in a consultant to prepare for an upcoming survey?
McClary-Brocious: The value piece is simple. The operator is ensuring that a neutral party is testing the facility on that process. The consultant does a trial run to look at infection control as a surveyor would do. The survey process is detailed in 100 slides that are available to everyone. A consultant can actually test whether the process has been implemented correctly. A consultant can also prepare the operator to implement corrections.
Karlin: Everything in this environment is about staffing, staffing, staffing. The staffing shortage is here and won’t go away anytime soon. With survey mandates and continued discussions about workplace vaccine mandates for skilled nursing workers, we will continue to face staffing concerns.
Current staff also must also meet the daily safety requirements around COVID-19. They are working longer hours, and staff burnout is a major concern. Some stats show that we could be expecting a loss of one-third of the care delivery teams. Operators need to get their teams fully engaged.
An external firm like ours can provide outside perspective and a second opinion, but also mitigate some level of risk and regulatory exposure. Hiring a consultant shows the leadership team is committed to the staff. The consultant serves as a resource for the staff to support their journey. Hopefully, we will see a light at the end of the tunnel in regard to staffing, but we’re going to have to think outside the box to meet staffing ratios.
Brooks: Is there anything else you’d like our readers to know?
Karlin: These are unique times — where the challenges are great, but so are the opportunities. We can seize those opportunities, if we elevate ourselves from the day-to-day details to recognize what possible opportunity looks like. I would encourage owner/operators to take that moment. Take that opportunity to collaborate with like-minded individuals in the industry to figure out how to improve the staffing situation. What new products, such as telehealth, have changed the way we do business?
This is a scary time, but it has also brought the senior service market to the forefront. This is our chance now to sculpt the conversation. We can say, look at us. We not only survived the pandemic. We handled it well. We have a high vaccination rate, and we’re looking into the future about how to deliver care better. Operators can leverage consultants, other partnerships, and technology to thrive into the future and show the population how strong an industry this really is.
2Q2021 NIC MAP Seniors Housing Actual Rates Report Key Takeaways
The NIC MAP® Data Service, powered by NIC MAP Vision, released national monthly data through June 2021 for actual rates and leasing velocity. This report includes national data as well as data for Atlanta, Philadelphia, and Phoenix.
The NIC MAP® Data Service, powered by NIC MAP Vision, recently released national monthly data through June 2021 for actual rates and leasing velocity. This report includes national data as well as data for Atlanta, Philadelphia, and Phoenix.
A few of the key takeaways from the 2Q2021 NIC MAP® Seniors Housing Actual Rates Report are listed below. These key takeaways are based on data included in the Segment Type report. Care segments refer to the levels of care and services provided to a resident living in an assisted living, memory care or independent living unit. Full access to the reports and other takeaways is available to NIC MAP Data Service clients.
For all three care segments (independent living, assisted living, and memory care) move-ins outpaced move-outs for four consecutive months from March 2021 through June 2021, showing continued improvement.
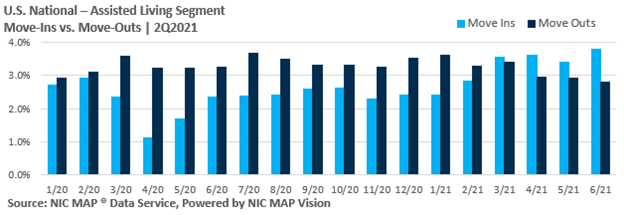
Move-ins for the independent living and assisted living care segments reached their recorded highs in the time series in June 2021. Independent living reached 2.8% of inventory and assisted living reached 3.8% of inventory.
Move-ins for the memory care segments were also high in 2Q2021 at 4.4% of inventory in June 2021, down from the recorded high of 4.7% of inventory in March of 2021.
Move-outs slowed in 2Q2021. For the independent living segment, move-outs were at 1.9% of inventory in June 2021. The last time move-outs for independent living were as low as 1.9% was in January 2020. Move-outs for assisted living segments reached the recorded low in the time series of 2.8% in June 2021. Move-outs peaked at 3.7% in July 2020 during the pandemic. Move-outs for memory care segments were at 3.1% for both April and June of 2021, the lowest it has been since September 2018 when it was 3.1%. For memory care, move-outs peaked at 5.3% in July 2020.
Average initial rates for residents moving into independent living, assisted living and memory care segments were below average asking rates, with monthly spreads largest for memory care.
The average discount in initial rates for memory care units was 8.6% ($564) in June 2021, up from 6.1% one year earlier in June 2020. This discount of 8.6% equates to 1.0 month on an annualized basis, whereas 6.1% equated to 0.7 month.
It should be noted that some operators are providing concessions to incentivize move-ins rather than discounts. Examples of concessions could include a free TV upon move-in or a kitchen upgrade. These types of concessions would not be captured in the discounts reported here.
The Actual Rates Data Initiative is driven by the need to continually increase transparency in the seniors housing sector and achieve greater parity to data that is available in other real estate asset types. Now more than ever, with impacts of the COVID-19 pandemic on the sector, having access to accurate data on the actual monthly rates that a seniors housing resident pays as compared to property level asking rates helps the sector achieve this goal.
About the Report
The NIC MAP Seniors Housing Actual Rates Report provides aggregate national data from approximately 300,000 units within more than 2,600 properties across the U.S. operated by 25 to 30 seniors housing providers. The operators included in the current sample tend to be larger, professionally managed, and investment-grade operators as we currently require participating operators to manage 5 or more properties. Note that this monthly time series is comprised of end-of-month data for each respective month.
While these trends are certainly interesting aggregated across the states, actual rates data is even more useful at the metro level. NIC MAP Vision is continuing to work towards reporting more markets.
Interested in Participating?
The Actual Rates Data Initiative is an effort to expand seniors housing data and we are looking for operators who have five or more properties to participate. We have expertise in extracting data from industry leading software systems, such as Yardi, PointClickCare, Alis, and MatrixCare, and can facilitate the process for you.
Your organization benefits through:
More informed benchmarking, strategic planning, and day-to-day business operations,
Increased transparency, aligning with other commercial real estate assets in terms of data availability, and
Enhanced investment and efficiency across the sector.
To learn more about NIC MAP data, powered by NIC MAP Vision, and about accessing the data featured in this article, schedule a meeting with a product expert today.
We use cookies on our website to give you the most relevant experience by remembering your preferences and repeat visits. NIC's privacy policy can be viewed here. By clicking “Accept”, you consent to the use of ALL the cookies.
This website uses cookies to improve your experience while you navigate through the website. Out of these cookies, the cookies that are categorized as necessary are stored on your browser as they are essential for the working of basic functionalities of the website. We also use third-party cookies that help us analyze and understand how you use this website. These cookies will be stored in your browser only with your consent. You also have the option to opt-out of these cookies. But opting out of some of these cookies may have an effect on your browsing experience.
Necessary cookies are absolutely essential for the website to function properly. This category only includes cookies that ensures basic functionalities and security features of the website. These cookies do not store any personal information.
Functional cookies help to perform certain functionalities like sharing the content of the website on social media platforms, collect feedbacks, and other third-party features.
Performance cookies are used to understand and analyze the key performance indexes of the website which helps in delivering a better user experience for the visitors.
Analytical cookies are used to understand how visitors interact with the website. These cookies help provide information on metrics the number of visitors, bounce rate, traffic source, etc.
Advertisement cookies are used to provide visitors with relevant ads and marketing campaigns. These cookies track visitors across websites and collect information to provide customized ads.

 Tiffany Karlin, partner, consulting services and director of healthcare; John Oeltjen, partner, risk management services; and Shasta McClary-Brocious, healthcare billing supervisor and reimbursement consultant.

 processes are reliable. Our organizational performance specialists were able to evaluate one client’s ability to change as part of our due diligence. It’s not that expensive and it’s often overlooked when a deal is being done, but it’s the type of assessment our team performs all the time.