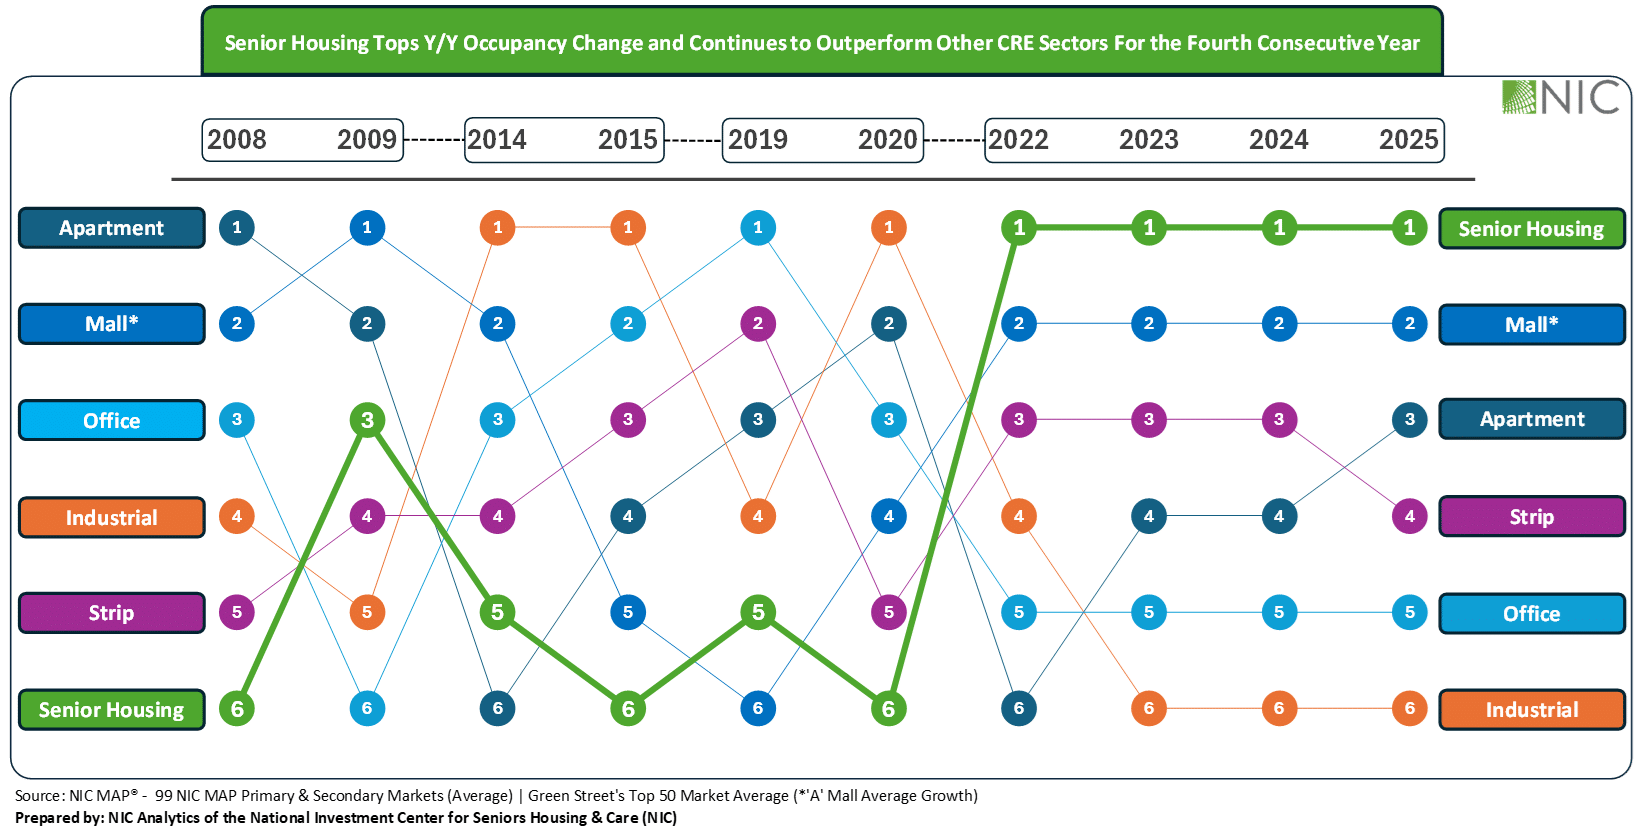
Another Strong Quarter for Senior Housing: Seven Straight Quarters of Outperformance

22 Senior Housing Properties Added to the NCREIF Property Index in 2Q

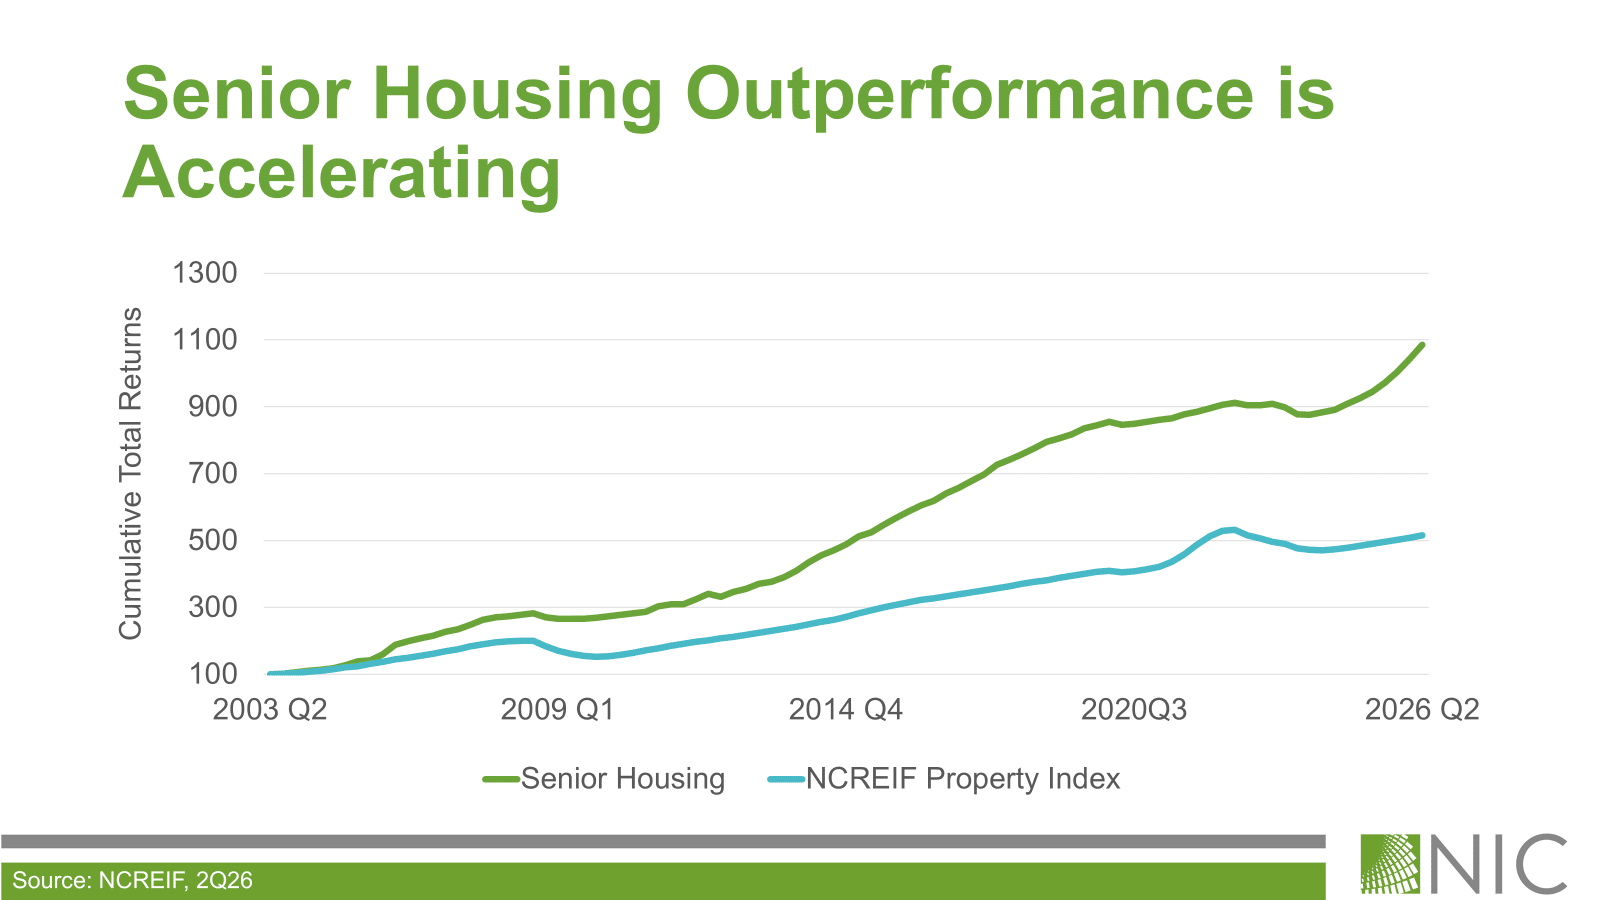
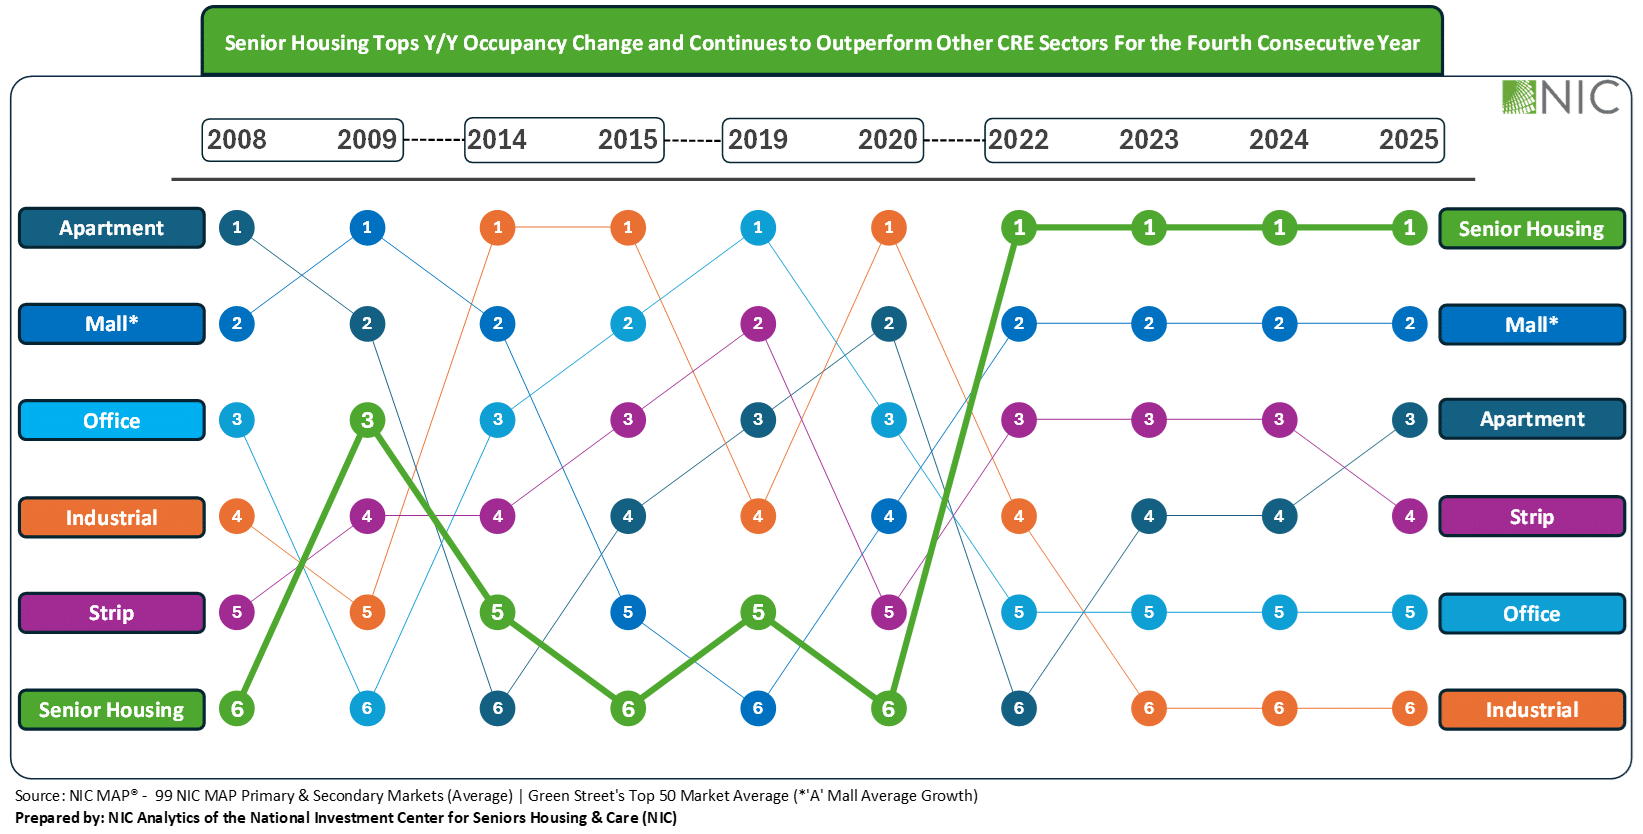
Senior housing investment performance in the second quarter of 2026 maintained the prior quarter’s momentum, posting a total return of 3.9% and bringing year-to-date returns to 8.0%. Overall, senior housing during the quarter outperformed the broader NCREIF Property Index’s (NPI) total return of 1.3% by 262 basis points, marking the seventh consecutive quarter of index outperformance.

Breaking out return contribution, senior housing capital appreciation in the second quarter was once again 2.5%. The capital appreciation return is the change in value net of any capital expenditures incurred during the quarter. Senior housing income return in the second quarter was also positive, once again yielding 1.4%. Both appreciation and income remained near their highest quarterly gains since 2017.

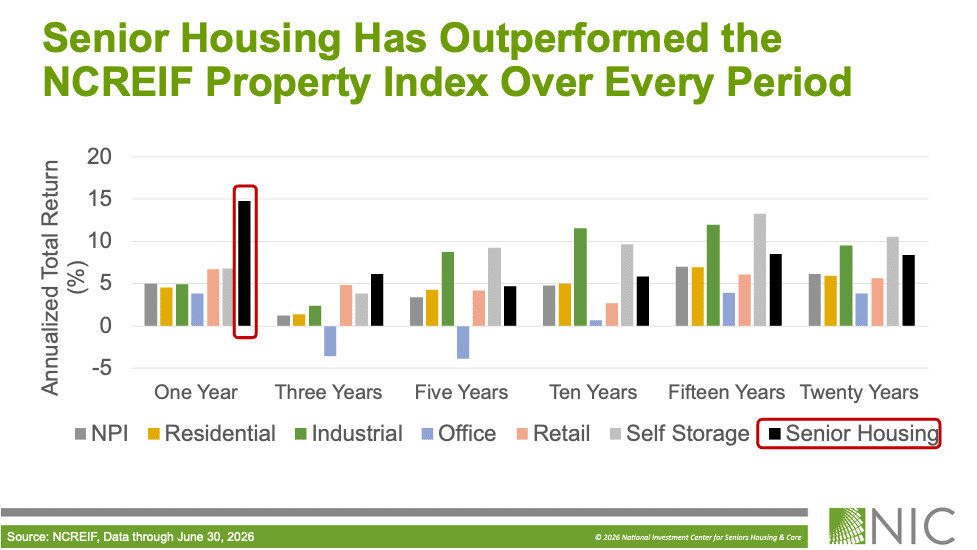
Over the one-year period, senior housing once again strongly outperformed all NCREIF Property Type Subindexes, posting the only double-digit total return at 14.8%, which was nearly ten percentage points above the NPI’s total return of 5.0% and well ahead of the next highest returns of 6.8% for self storage and 6.7% for retail properties. Over the longer run, senior housing has outperformed the NPI over the three-, five-, 10-, 15-, and 20-year periods.

These performance measures reflect the returns of 241 senior housing properties valued at $16.0 billion in the second quarter. Compared to the prior quarter, 22 senior housing properties were added to the index on a net basis, an increase of 24 assisted living properties and a decrease of two independent living properties. Overall, the number of senior housing properties tracked within the NPI has grown significantly from the 56 properties initially tracked in 2003, a reflection of increased institutional investment in the property type.

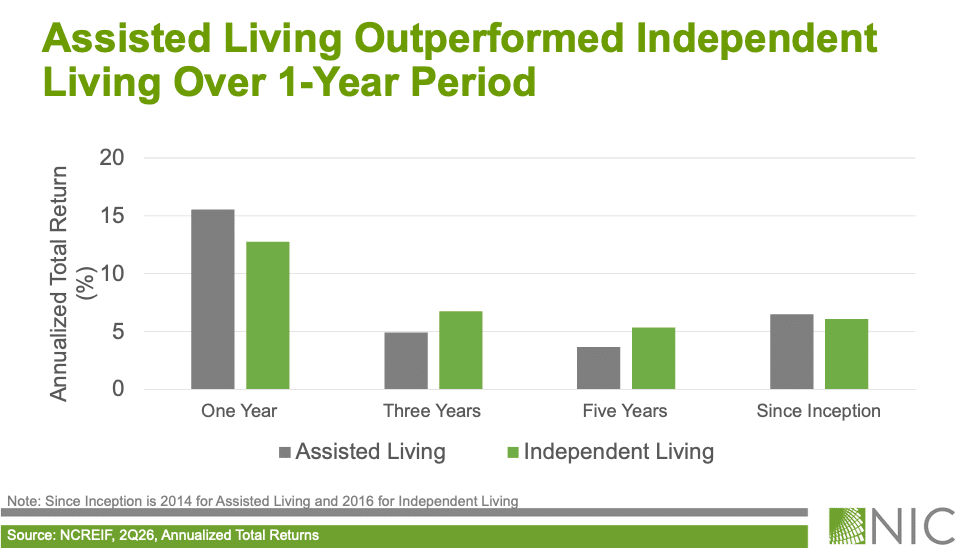
By senior housing property subtype in the second quarter, year-to-date, and one-year periods, assisted living outperformed independent living. Over the three- and five-year periods, however, independent living outperformed assisted living, likely driven by higher occupancy rates and lower labor costs. As of the second quarter of 2026, the gap in occupancy rates between independent living and assisted living narrowed to its smallest spread since 2014, and total returns for assisted living pulled ahead of independent living.

Over the long run, assisted living total returns have been comparable to independent living since their NCREIF inception periods of 2014 for assisted living and 2016 for independent living. Looking ahead, returns for the two property subtypes will likely continue to vary over certain time periods given that independent living is a choice-based product type while assisted living is driven by needs-based demand.

Turning to market fundamentals, as demand for senior housing has outpaced new supply, occupancy rates have climbed higher. Senior housing occupancy for the 31 Primary Markets tracked by NIC MAP gained 0.4 percentage points to 89.9% in the second quarter of 2026. This was the 20th consecutive quarter of increasing occupancy rates. At the current pace of development and demand, senior housing occupancy is on track to surpass 90% occupancy well before the end of the year, further tightening availability across many markets.

Total Return
Period NCREIF Property Index (NPI) Senior Housing Assisted Living Independent Living
2Q 2026 1.29 3.91 4.57 2.37
YTD 2.54 7.97 8.48 6.26
One Year 4.99 14.80 15.54 12.74
Three Years 1.22 6.10 4.92 6.76
Five Years 3.36 4.67 3.65 5.36
Ten Years 4.76 5.86 5.34 N/A
Fifteen Years 7.01 8.51 N/A N/A
Twenty Years 6.12 8.39 N/A N/A
Income
Period NCREIF Property Index (NPI) Senior Housing Assisted Living Independent Living
2Q 2026 1.17 1.40 1.48 1.30
YTD 2.33 2.85 3.03 2.64
One Year 4.71 5.69 6.02 5.31
Three Years 4.70 5.16 5.06 5.24
Five Years 4.45 4.49 4.21 4.82
Ten Years 4.49 4.80 4.62 N/A
Fifteen Years 4.82 5.37 N/A N/A
Twenty Years 5.11 5.81 N/A N/A
Appreciation
Period NCREIF Property Index (NPI) Senior Housing Assisted Living Independent Living
2Q 2026 0.12 2.51 3.09 1.08
YTD 0.20 5.05 5.37 3.57
One Year 0.27 8.73 9.12 7.15
Three Years -3.36 0.91 -0.12 1.47
Five Years -1.06 0.17 -0.54 0.53
Ten Years 0.26 1.03 0.70 N/A
Fifteen Years 2.12 3.03 N/A N/A
Twenty Years 0.97 2.47 N/A N/A
Source: NCREIF, Data through June 30, 2026

Welcoming NIC’s Newest Board Members and 2026–2027 Officers 

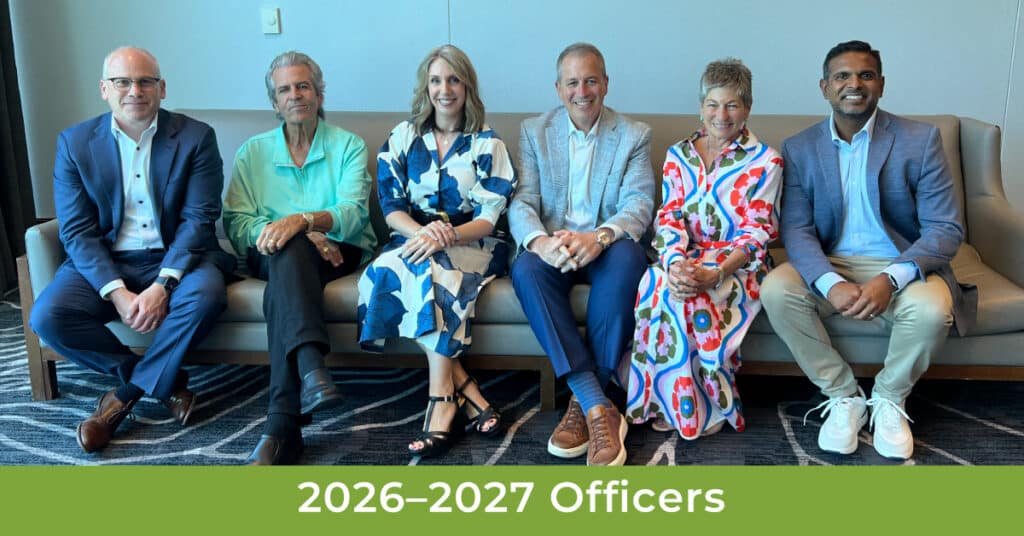
As demand for senior housing continues to climb, NIC has added additional expertise to the leadership guiding its work. As of July 1, 2026, NIC has added four new voices to its board and confirmed its officer slate for the 2026–2027 term, a lineup that reflects NIC’s ongoing engagement with industry leaders to help advance access and choice for older adults. 

NIC’s board chair, Ken Segarnick, principal at KCS Growth Partners, LLC, put it well: “This is an exciting moment for NIC, and for the senior housing and care sector. We are adding extraordinary talent to our board — individuals who have not only shaped their corners of the industry, but who have already demonstrated their dedication to NIC’s work through years of active involvement. I am energized by what this team will accomplish together, and I am committed to building on the strong foundation we have as we work to advance quality and innovation while expanding access and choice for older adults.” 

Meet the New Board Members 

Jamie Cobb, CFO of Columbia Pacific Advisors, joins NIC with deep financial expertise. He’s been a fixture on the Spring Conference Program Committee for years, contributing to timely and relevant content that educates the industry on where things are headed. 

Ben Firestone, CEO & Co-Founder of Blueprint Healthcare Real Estate Advisors, is one of NIC’s own success stories — a graduate of NIC’s Future Leaders Council (FLC) and former member of the Fall Conference Program Committee. His work in senior housing capital markets and transactions makes him a natural fit for the board. 

Tana Gall, President of Merrill Gardens, brings the operator’s perspective to the table. She is a longstanding NIC volunteer who currently co-chairs the Fall Conference Program Committee and serves as vice chair of the Operator Advisory Board. 

NIC’s Newest Advisor 

Colette Dafoe, Partner at Nixon Peabody LLP, joins the board in an advisory capacity as a subject matter expert. Dafoe is an FLC alumna and currently chairs the FLC Advisory Committee, bringing legal expertise alongside her long-standing involvement in NIC’s leadership development activities. 

NIC’s 2026–2027 Officers 

  • Board Chair: Ken Segarnick, Principal, KCS Growth Partners, LLC 
  • Vice Chair: John Rijos, Co-founder/Operating Partner, Chicago Pacific Founders & Founder/Chairman, CPF Living Communities 
  • Second Vice Chair: Lynne Katzmann, Founder & CEO, Juniper Communities 
  • Secretary: Bre Grubbs, Chief Strategy Officer, Leisure Care 
  • Treasurer: Matt Ruark, Senior Vice President, KeyBank 
  • Assistant Treasurer: Vikas Gupta, Chief Investment Officer, Omega Healthcare Investors, Inc. 

With Gratitude to Outgoing Leadership 

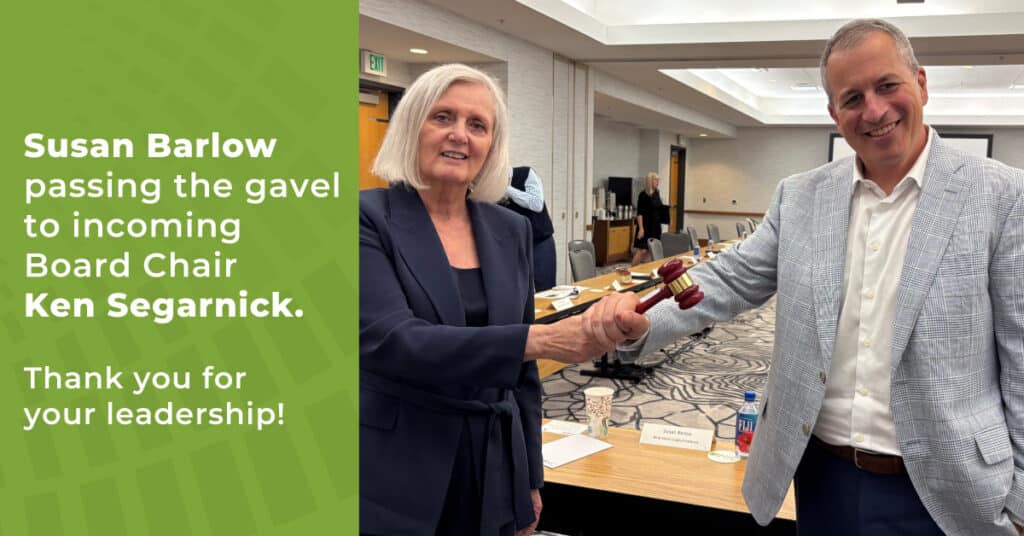
NIC extends its sincere thanks to immediate past board chair Susan Barlow, whose leadership guided the organization over the last three years. Barlow will remain on the board, continuing to lend her experience going forward. 

NIC is equally grateful to the three directors who have rolled off the board: Jack Callison, Imran Javaid, and Mercedes Kerr. Their contributions and dedication over the course of their service have helped shape NIC’s direction and strengthen its mission. 

Volunteers who dedicate their time and talent to NIC’s board, committees, and advisory groups contribute directly to NIC’s mission at a pivotal time — investor interest in senior housing remains strong, and the need for more options for older adults has never been more urgent.  

A Closer Look at Freestanding Nursing Care Communities 

This analysis examines the supply-demand dynamics, regional occupancy patterns, and rate growth trends among 5,461 freestanding nursing care communities across the 99 NIC MAP Primary and Secondary Markets as of the first quarter of 2026. 

Fundamentals of Freestanding Nursing Care Communities 

Occupancy Continues to Rise 

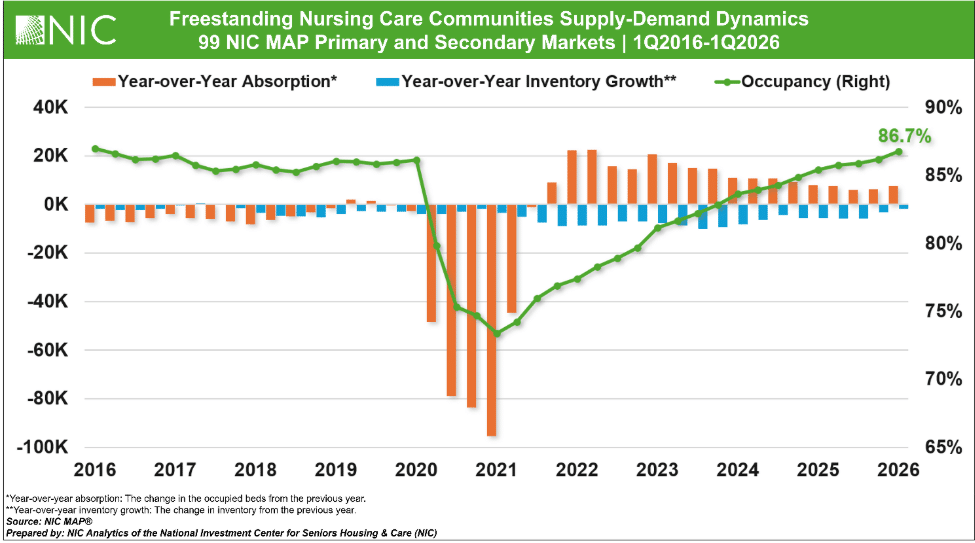
The occupancy rate for freestanding nursing care communities reached 86.7% in the first quarter of 2026 across the 99 Primary and Secondary Markets. After reaching a series low of 73.4% in the first quarter of 2021, occupancy increased for 20 consecutive quarters, gaining a cumulative 13.3 percentage points through the first quarter of 2026. This sustained improvement reflects strengthening demand fundamentals, supported by positive absorption and continued inventory contraction. At 86.7%, freestanding nursing care occupancy is now at its highest level since 2016. 

Demand Remains Resilient 
After moderating from the elevated levels recorded in 2022 and 2023, often attributed to the post-pandemic recovery, year-over-year absorption for freestanding nursing care communities across the 99 Primary and Secondary Markets stood at 1.3% (7,738 newly occupied beds) in the first quarter of 2026, compared to 3.7% (20,692 newly occupied beds) in the first quarter of 2023. Despite the moderating demand, the continued positive absorption pattern for 18 consecutive quarters through early 2026 suggests that demand remains resilient across the nursing care sector. This is a marked difference in the demand levels seen in the quarters leading up to the pandemic. 

Supply Contraction Slows 
Across the 99 Primary and Secondary Markets, year-over-year inventory growth for freestanding nursing care communities has remained negative, reflecting a prolonged period of supply reduction. The contraction was especially significant from 2021 through 2024, when year-over-year inventory declines often ranged from approximately 6,000 to 10,000 beds. More recently, however, the pace of decline has slowed, with year-over-year inventory declines narrowing from negative 0.8% (-5,512 beds) in the first quarter of 2025 to negative 0.2% (-1,704 beds) in early 2026. 

Regional Occupancy Patterns 
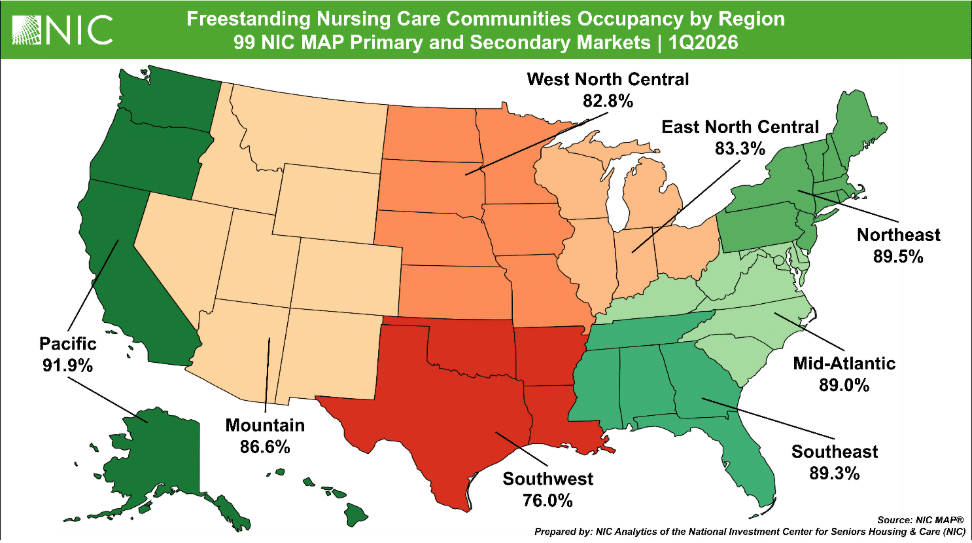
The following map shows regional occupancy rates for freestanding nursing care communities across the 99 Primary and Secondary Markets in the first quarter of 2026.  

The Pacific region recorded the highest occupancy at 91.9%, supported by strong performance across several California markets. The Northeast, Southeast, and Mid-Atlantic regions also posted relatively strong occupancy, each reaching approximately 89% or higher.  

By contrast, the Southwest region had the lowest occupancy at 76.0%, well below all other regions, with several Texas and Oklahoma markets reporting relatively lower occupancy. The East North Central and West North Central regions also reported below-average occupancy among the 99 Primary and Secondary Markets, at 83.3% and 82.8%, respectively, while the Mountain region was closer to the national average (86.7%) with 86.6% of beds occupied in the first quarter. 

Overall, the regional pattern suggests that freestanding nursing care occupancy is strongest in several coastal regions, while parts of the Southwest continue to lag. 

Year-over-Year Rate Growth Surpassed 5% 
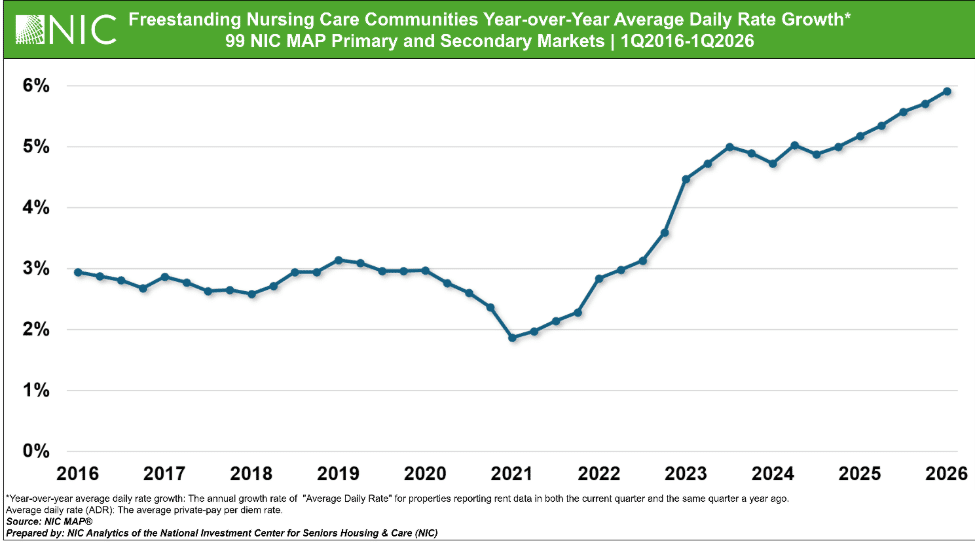
The exhibit below shows the year-over-year average private-pay daily rate growth for freestanding nursing care communities across the 99 Primary and Secondary Markets. 

In the first quarter of 2026, year-over-year rate growth for freestanding nursing care communities remained elevated at 5.9%, the highest level recorded between 2016 and 2026. After remaining relatively modest from 2016 through 2021, year-over-year rate growth began to strengthen in 2022 and has stayed elevated since 2023. More recently, the pace of growth continued to increase, rising from 4.7% in the first quarter of 2024 to 5.2% in the first quarter of 2025 and 5.9% in the first quarter of 2026, indicating sustained pricing momentum across the nursing care sector. As a result, the average daily rate reached $420 in the first quarter of 2026, representing a 27.5% increase from the first quarter of 2019. 

Look for future articles from NIC to learn more about the nursing care sector. 

Senior Housing Occupancy Climbs in Second Quarter 2026 

Senior housing occupancy reached 89.9% in the second quarter of 2026, up 0.4 percentage points, with the number of occupied senior housing units increasing to a new record level. Year-over-year inventory growth remained near record lows. Average annual asking rent growth remained above historical averages and rolling four-quarter pricing per unit for senior housing and nursing transactions were near or at historic highs.  

These and other findings on quarterly senior housing data trends were presented by NIC’s Research & Analytics team during a recent webinar with NIC MAP clients. Additionally, Ben Firestone, CEO & Co-Founder of Blueprint, joined Lisa McCracken, Head of Research & Analytics at NIC, on the webinar to discuss transaction activity and marketplace trends. Key takeaways included the following. 

Takeaway #1: Senior Housing Occupancy Rate Neared 90% 

  • The occupancy rate for senior housing rose 0.4 percentage points in the second quarter for the 31 NIC MAP Primary Markets to reach 89.9%, driven by positive net absorption outpacing the number of new units arriving online. 
  • The occupancy rate is only 10 basis points from crossing the 90% threshold for the 31 Primary Markets.  
  • The current level of 89.9% was last reached at the end of 2015, more than ten years ago. 

Takeaway #2: Gap Between Independent Living and Assisted Living Narrowed 

  • Breaking out occupancies by property type, the occupancy rate for independent living (IL) communities rose 0.3 percentage points in the second quarter to 91.3%, while the occupancy rate for assisted living (AL) communities rose 0.4 percentage points to 88.4%. 
  • The gap between AL and IL occupancy rates narrowed to only 2.9 percentage points in the second quarter, which was the smallest spread between the two rates since 2014. 

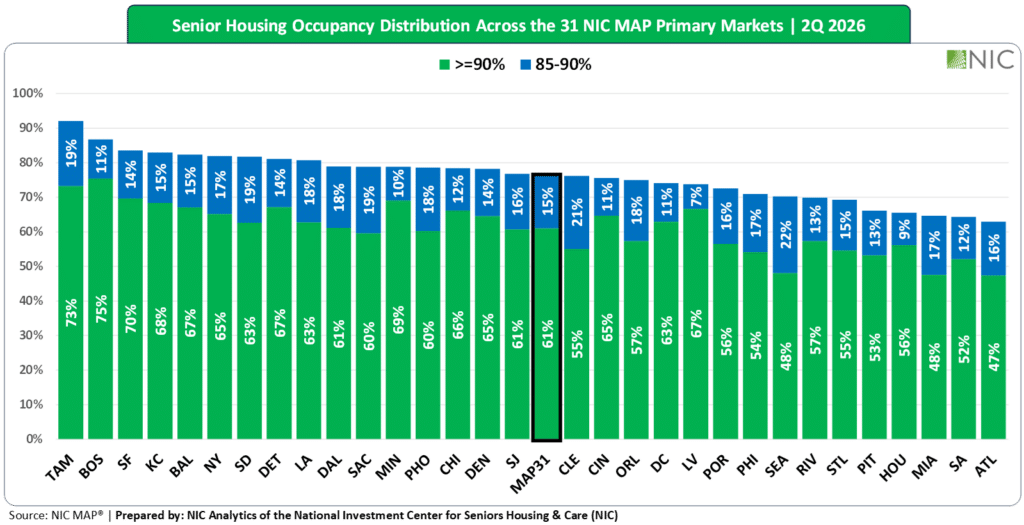
Takeaway #3: Half of Primary Markets Above 90% Occupied 

  • Fifteen of the 31 Primary Markets had occupancy rates at or above 90% in the second quarter, which was three times the number of markets above 90% only three quarters earlier.  
  • There were a few notable markets where occupancy rates in the second quarter were slightly above their all-time highs, such as San Francisco (92.7%), Chicago (90.7%), and Kansas City (90.5%). 

Takeaway #4: Inventory Growth Remained Near Record Lows 

  • Turning to new supply, year-over-year inventory growth remained below 1.0% for the fifth consecutive quarter and near the time series low. 
  • Breaking out new supply by property type, independent living inventory increased 0.5% from a year earlier, well below its historical average growth of 1.5% annually. 
  • Assisted living inventory increased only 0.3% from a year earlier, well below its historical average growth of more than 3% annually. 

Memory Care – An Analysis of the Sector’s Standing and Dynamics 

In this article, we focus on the memory care sector, a senior housing segment designed for residents with Alzheimer’s or other forms of dementia, within the combined 99 NIC MAP Primary and Secondary Markets, analyzing occupancy rates as well as supply and demand dynamics across property and campus types. Note that memory care uses the NIC MAP segment-type designation, meaning the data reflect memory care units located at any type of property. 

According to the Alzheimer’s Association’s 2026 Facts and Figures report, an estimated 7.4 million Americans aged 65 and older are now living with Alzheimer’s – up from the 6.5 million estimate only three years ago, and a figure that crosses 7 million for the first time. About one in ten people aged 65 and older (11%) are affected, and roughly 74% of those living with the disease are age 75 or older. By 2030, that population is projected to rise to nearly 8.5 million. Notably, the first of the Baby Boomers turn 80 in 2026, the age cohort most directly associated with entry into memory care, and marking a demographic inflection point that the sector has anticipated for years.  

Fundamentals of the Memory Care Segment  

Occupancy. Memory care occupancy in the 99 Primary and Secondary Markets stood at 88.4% in the first quarter of 2026, up 2.1 percentage points from year-earlier levels and about 6.0 percentage points from early 2019. As background, independent living segment occupancy moved above 91% and assisted living reached about 88.6%

Supply Dynamics. Memory care inventory in the 99 Primary and Secondary Markets grew by 908 units, up 0.5% year-over-year in the first quarter of 2026. Since early 2019, inventory has increased by roughly 22.0%, or about 29,950 additional units, reflecting a more measured pace of new supply growth in recent years.  

Demand Dynamics. Demand has continued to outrun new supply across senior housing in general. Within memory care specifically, occupied units in the 99 Primary and Secondary Markets increased by 2.9%, 4209 units, year-over-year and by 30.1% since early 2019, equivalent to roughly 34,000 additional occupied units in that period. Notably, occupied units have grown faster than inventory over that span (30.1% vs. 22.0%). 

Memory Care Segment – Occupancy by Campus Type 

As of the first quarter of 2026, there were approximately 5,750 properties offering memory care services within the 99 Primary and Secondary Markets. Among them, 76% were combined properties offering at least two service types, roughly 13% were freestanding (offering memory care as the sole level of care), and 11% were continuing care retirement communities (CCRCs).  

Memory care remains most frequently offered within combined properties, typically anchored by assisted living with a dedicated secured wing or floor. As of the first quarter of 2026, memory care segments within CCRCs continued to report the highest occupancy at 91.2%, followed by combined (88.2%) and freestanding properties (87.9%). 

The exhibit below shows each campus type’s occupancy differential in percentage points relative to the memory care segment’s overall average occupancy since 2016.  

Memory care occupancy in the CCRC campus type remains above the segment benchmark throughout, with the lead widening during periods of stress. It peaked at about 9.2 points above the segment average occupancy in the first quarter of 2021, while freestanding and combined campus types trailed by 1.2 and 0.8 points

As of the first quarter of 2026, CCRCs led by about 2.8 points, with combined and freestanding slightly below the segment average occupancy at 0.2 and 0.5 points.  

With Alzheimer’s cases projected to approach 8.5 million by 2030, the sector’s ability to meet rising demand through new development will be a key theme in the years ahead. 

NIC produced a prior research piece on the Memory Care Segment in 2023. For those interested in a deeper dive into historical figures, that analysis can be accessed here