22 Senior Housing Properties Added to the NCREIF Property Index in 2Q
Senior housing investment performance in the second quarter of 2026 maintained the prior quarter’s momentum, posting a total return of 3.9% and bringing year-to-date returns to 8.0%. Overall, senior housing during the quarter outperformed the broader NCREIF Property Index’s (NPI) total return of 1.3% by 262 basis points, marking the seventh consecutive quarter of index outperformance.
Breaking out return contribution, senior housing capital appreciation in the second quarter was once again 2.5%. The capital appreciation return is the change in value net of any capital expenditures incurred during the quarter. Senior housing income return in the second quarter was also positive, once again yielding 1.4%. Both appreciation and income remained near their highest quarterly gains since 2017.
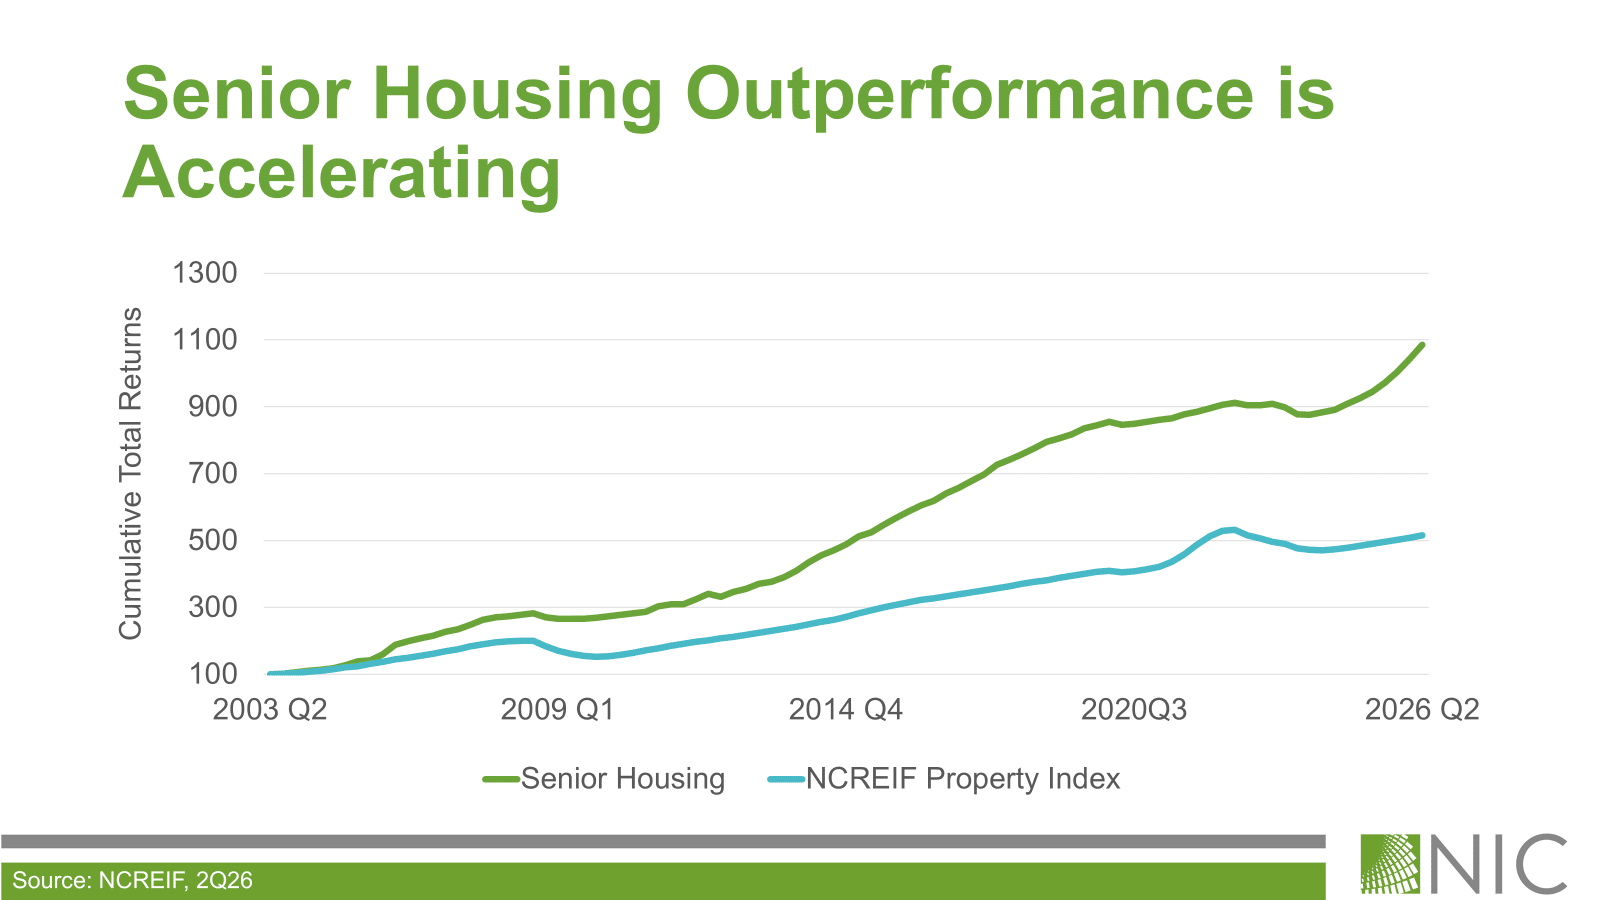
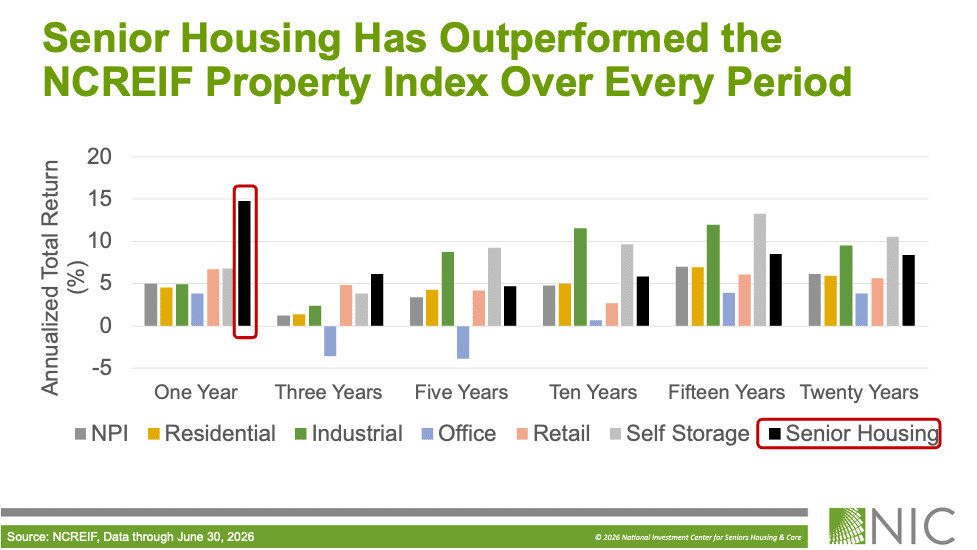
Over the one-year period, senior housing once again strongly outperformed all NCREIF Property Type Subindexes, posting the only double-digit total return at 14.8%, which was nearly ten percentage points above the NPI’s total return of 5.0% and well ahead of the next highest returns of 6.8% for self storage and 6.7% for retail properties. Over the longer run, senior housing has outperformed the NPI over the three-, five-, 10-, 15-, and 20-year periods.
These performance measures reflect the returns of 241 senior housing properties valued at $16.0 billion in the second quarter. Compared to the prior quarter, 22 senior housing properties were added to the index on a net basis, an increase of 24 assisted living properties and a decrease of two independent living properties. Overall, the number of senior housing properties tracked within the NPI has grown significantly from the 56 properties initially tracked in 2003, a reflection of increased institutional investment in the property type.
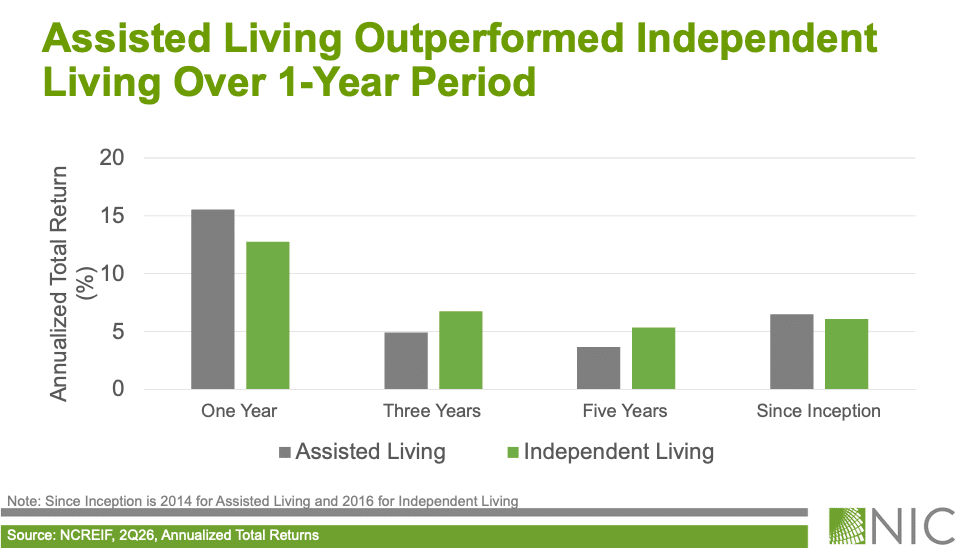
By senior housing property subtype in the second quarter, year-to-date, and one-year periods, assisted living outperformed independent living. Over the three- and five-year periods, however, independent living outperformed assisted living, likely driven by higher occupancy rates and lower labor costs. As of the second quarter of 2026, the gap in occupancy rates between independent living and assisted living narrowed to its smallest spread since 2014, and total returns for assisted living pulled ahead of independent living.
Over the long run, assisted living total returns have been comparable to independent living since their NCREIF inception periods of 2014 for assisted living and 2016 for independent living. Looking ahead, returns for the two property subtypes will likely continue to vary over certain time periods given that independent living is a choice-based product type while assisted living is driven by needs-based demand.
Turning to market fundamentals, as demand for senior housing has outpaced new supply, occupancy rates have climbed higher. Senior housing occupancy for the 31 Primary Markets tracked by NIC MAP gained 0.4 percentage points to 89.9% in the second quarter of 2026. This was the 20th consecutive quarter of increasing occupancy rates. At the current pace of development and demand, senior housing occupancy is on track to surpass 90% occupancy well before the end of the year, further tightening availability across many markets.
| Total Return | ||||
| Period | NCREIF Property Index (NPI) | Senior Housing | Assisted Living | Independent Living |
|---|---|---|---|---|
| 2Q 2026 | 1.29 | 3.91 | 4.57 | 2.37 |
| YTD | 2.54 | 7.97 | 8.48 | 6.26 |
| One Year | 4.99 | 14.80 | 15.54 | 12.74 |
| Three Years | 1.22 | 6.10 | 4.92 | 6.76 |
| Five Years | 3.36 | 4.67 | 3.65 | 5.36 |
| Ten Years | 4.76 | 5.86 | 5.34 | N/A |
| Fifteen Years | 7.01 | 8.51 | N/A | N/A |
| Twenty Years | 6.12 | 8.39 | N/A | N/A |
| Income | ||||
| Period | NCREIF Property Index (NPI) | Senior Housing | Assisted Living | Independent Living |
| 2Q 2026 | 1.17 | 1.40 | 1.48 | 1.30 |
| YTD | 2.33 | 2.85 | 3.03 | 2.64 |
| One Year | 4.71 | 5.69 | 6.02 | 5.31 |
| Three Years | 4.70 | 5.16 | 5.06 | 5.24 |
| Five Years | 4.45 | 4.49 | 4.21 | 4.82 |
| Ten Years | 4.49 | 4.80 | 4.62 | N/A |
| Fifteen Years | 4.82 | 5.37 | N/A | N/A |
| Twenty Years | 5.11 | 5.81 | N/A | N/A |
| Appreciation | ||||
| Period | NCREIF Property Index (NPI) | Senior Housing | Assisted Living | Independent Living |
| 2Q 2026 | 0.12 | 2.51 | 3.09 | 1.08 |
| YTD | 0.20 | 5.05 | 5.37 | 3.57 |
| One Year | 0.27 | 8.73 | 9.12 | 7.15 |
| Three Years | -3.36 | 0.91 | -0.12 | 1.47 |
| Five Years | -1.06 | 0.17 | -0.54 | 0.53 |
| Ten Years | 0.26 | 1.03 | 0.70 | N/A |
| Fifteen Years | 2.12 | 3.03 | N/A | N/A |
| Twenty Years | 0.97 | 2.47 | N/A | N/A |
| Source: NCREIF, Data through June 30, 2026 | ||||