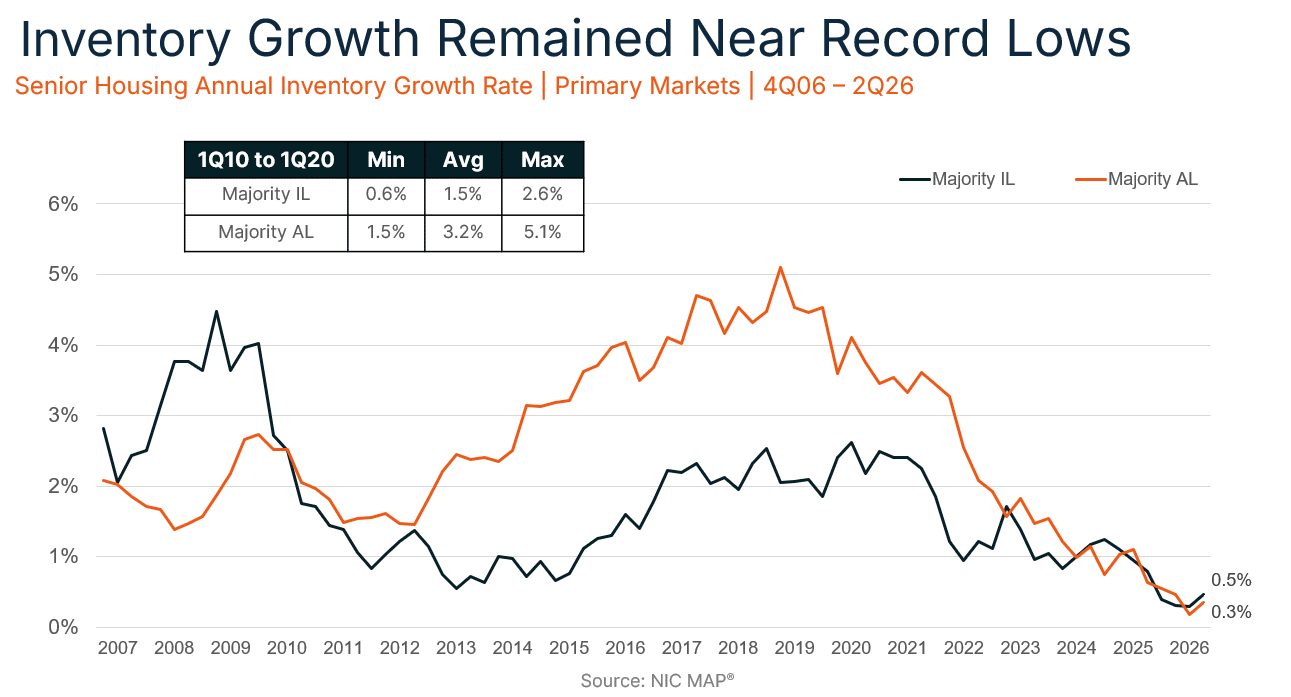
Senior housing occupancy reached 89.9% in the second quarter of 2026, up 0.4 percentage points, with the number of occupied senior housing units increasing to a new record level. Year-over-year inventory growth remained near record lows. Average annual asking rent growth remained above historical averages and rolling four-quarter pricing per unit for senior housing and nursing transactions were near or at historic highs.
These and other findings on quarterly senior housing data trends were presented by NIC’s Research & Analytics team during a recent webinar with NIC MAP clients. Additionally, Ben Firestone, CEO & Co-Founder of Blueprint, joined Lisa McCracken, Head of Research & Analytics at NIC, on the webinar to discuss transaction activity and marketplace trends. Key takeaways included the following.
Takeaway #1: Senior Housing Occupancy Rate Neared 90%
- The occupancy rate for senior housing rose 0.4 percentage points in the second quarter for the 31 NIC MAP Primary Markets to reach 89.9%, driven by positive net absorption outpacing the number of new units arriving online.
- The occupancy rate is only 10 basis points from crossing the 90% threshold for the 31 Primary Markets.
- The current level of 89.9% was last reached at the end of 2015, more than ten years ago.
Takeaway #2: Gap Between Independent Living and Assisted Living Narrowed
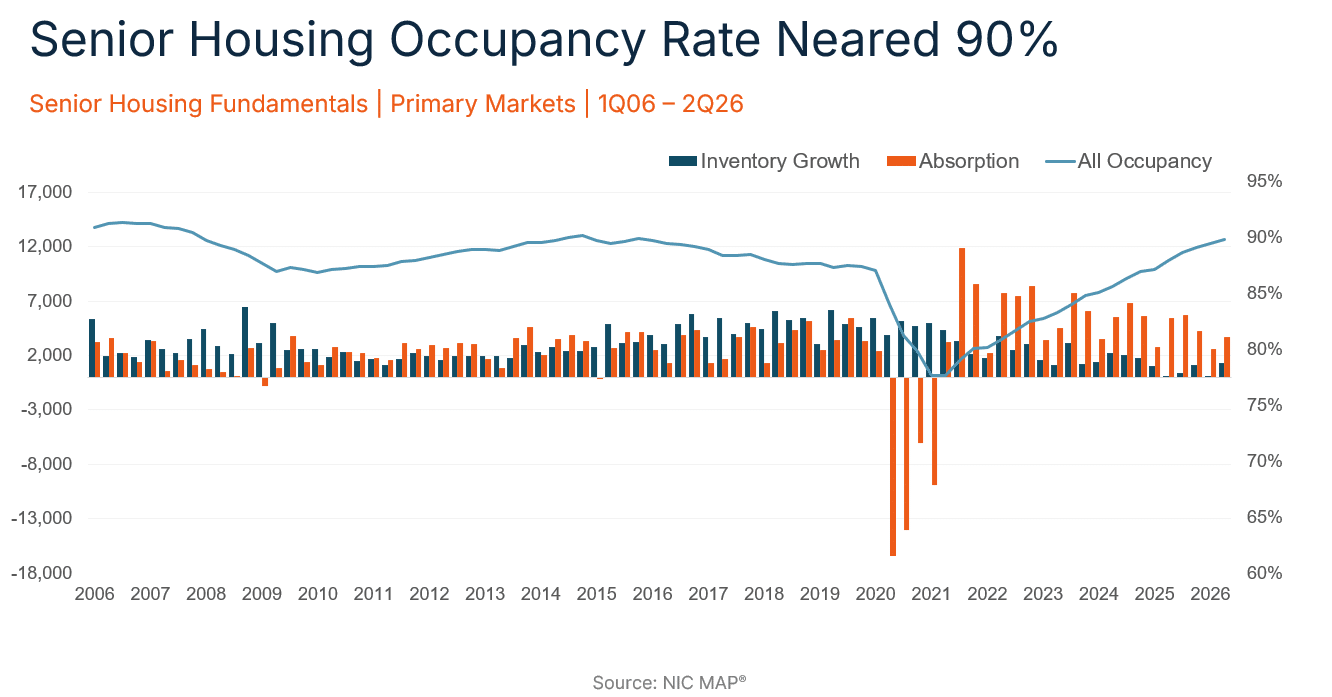
- Breaking out occupancies by property type, the occupancy rate for independent living (IL) communities rose 0.3 percentage points in the second quarter to 91.3%, while the occupancy rate for assisted living (AL) communities rose 0.4 percentage points to 88.4%.
- The gap between AL and IL occupancy rates narrowed to only 2.9 percentage points in the second quarter, which was the smallest spread between the two rates since 2014.
Takeaway #3: Half of Primary Markets Above 90% Occupied
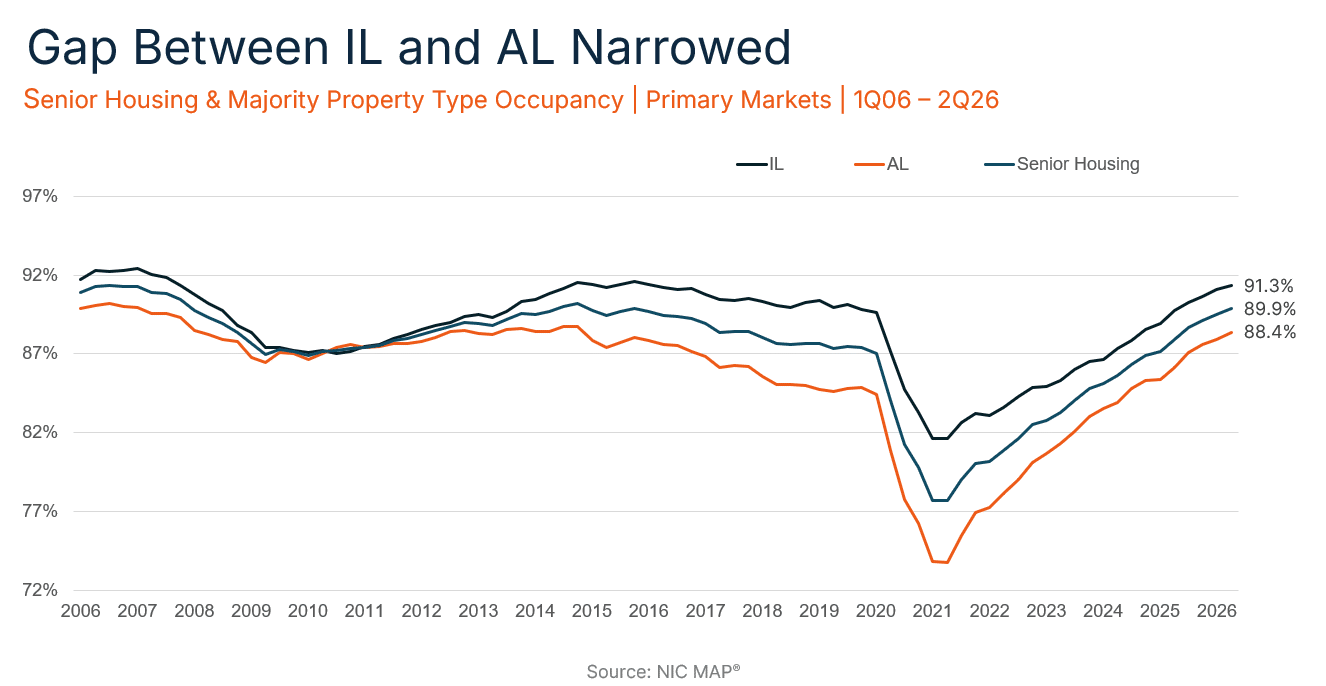
- Fifteen of the 31 Primary Markets had occupancy rates at or above 90% in the second quarter, which was three times the number of markets above 90% only three quarters earlier.
- There were a few notable markets where occupancy rates in the second quarter were slightly above their all-time highs, such as San Francisco (92.7%), Chicago (90.7%), and Kansas City (90.5%).
Takeaway #4: Inventory Growth Remained Near Record Lows
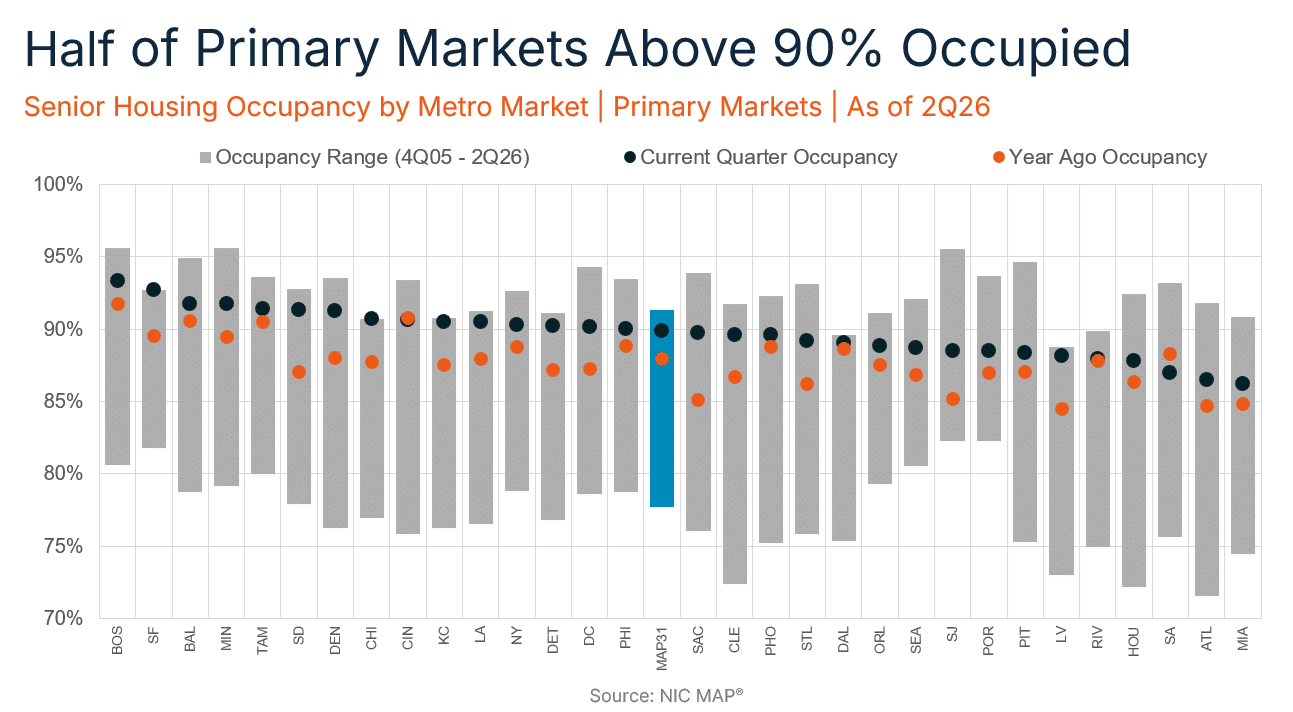
- Turning to new supply, year-over-year inventory growth remained below 1.0% for the fifth consecutive quarter and near the time series low.
- Breaking out new supply by property type, independent living inventory increased 0.5% from a year earlier, well below its historical average growth of 1.5% annually.
- Assisted living inventory increased only 0.3% from a year earlier, well below its historical average growth of more than 3% annually.