Executive Survey Insights Recap and Future NIC Surveys
NIC launched its Executive Survey Insights (ESI) series in March 2020 to provide timely insights on key property operational metrics within the senior housing and skilled nursing sectors. Since this survey series was launched, more than 50 waves of the survey captured the property market’s performance through numerous challenges – COVID-19, labor deficiencies, supply shortages, threats of a looming recession, inflation, and rising expenses.
NIC launched its Executive Survey Insights (ESI) series in March 2020 to provide timely insights on key property operational metrics within the senior housing and skilled nursing sectors during a critical time. Since this survey series was launched, more than 50 waves of the survey captured the property market’s performance through numerous challenges – COVID-19, labor deficiencies, supply shortages, threats of a looming recession, inflation, and rising expenses.
As the industry navigated these circumstances, the real-time insights captured in the ESI reports and accompanying chart packs provided industry stakeholders with perspective on these issues and ensured the narrative on senior housing and care operational trends was accurate.
Future NIC Surveys
To continuously improve transparency within our industry, NIC is pausing the ESI survey while we evaluate our surveying opportunities going forward. As the senior housing and care industry is now at a pivotal point, NIC’s forthcoming surveys will focus on the forward-looking perspectives of the industry’s leaders to provide actionable insights for developing strategies for navigating our dynamic and evolving market.
Executive Survey Insights’ Hot Topics
While we are taking the time to re-engineer our survey tools, let’s revisit a couple of the most pressing issues addressed by NIC’s Executive Survey Insights during the past few years.
Impact of COVID-19 Variants on Occupancy
A question throughout the entirety of the ESI series investigated the pace of move-ins and move-outs over the prior 30-day period. Within each wave, respondents also gave insights about the primary causes behind the changes in the pace of move-ins, including organization or state-imposed ban, resident or family member concerns, delays in lead conversions, or potential residents’ fear of an unstable economy.
Impact of Labor Shortages on FTE Recruitment
Labor shortages were an unfortunate hallmark of the COVID-19 pandemic. Questions pertaining to the severity of staffing shortages, agency utilization, and attracting and retaining employees were always of great interest.
These survey questions provided reference points on where other organizations stood and insights into strategies to address the situation and which of those strategies were most successful. For example, in June 2022, the most effective method cited for attracting new community staff was increasing wages, followed by flexible schedules, and hiring bonuses.
Upcoming NIC Launch
NIC’s ESI findings have garnered great interest from media and have provided the senior housing and care industry with timely information on relevant market trends. Keep an eye out for NIC’s launch of its new survey series in the coming months!
On-going Gains in Senior Housing Occupancy in July 2023
The all-occupancy rate for senior housing for the NIC MAP Primary Markets increased to 84.2% in the July 2023 reporting period, up 0.5 percentage point (pps) from the June 2023 reporting period on three-month rolling basis, according to intra-quarterly NIC MAP® data, released by NIC MAP Vision. From its pandemic record low of 77.8% in June 2021, senior housing all-occupancy increased by 6.4pps and is now 2.9pps from the pre-pandemic March 2020 level of 87.1%.
The occupancy recovery for senior housing will likely be sustained during the near-term given current supply and demand conditions.
The all-occupancy rate for senior housing for the NIC MAP Primary Markets increased to 84.2% in the July 2023 reporting period, up 0.5 percentage point (pps) from the June 2023 reporting period on three-month rolling basis, according to intra-quarterly NIC MAP® data, released by NIC MAP Vision. From its pandemic record low of 77.8% in June 2021, senior housing all-occupancy increased by 6.4pps and is now 2.9pps from the pre-pandemic March 2020 level of 87.1%.
Occupancy Recovery by Majority Property Type.At 85.8%, the all-occupancy rate for majority independent living (IL) properties for the NIC MAP Primary Markets increased 0.3pps from June 2023 but remained 3.8pps below March 2020 levels. For majority assisted living properties (AL), the all-occupancy rate for the NIC MAP Primary Markets was up 0.6pps to 82.5% from June 2023 and is now 2.0pps below March 2020 levels. Occupancy for AL continued to recover relatively fast compared with IL. From pandemic related low, all-occupancy for AL increased by 8.6pps, more than double the increase for IL (up 4.2pps since March 2021).
The senior housing market is demonstrating a steady recovery, with demand and occupancy continuing to rise. A new ratio developed by NIC Analytics offers further insights into these encouraging trends. This new measure offers a nuanced perspective on the balance between demand and supply and occupancy outlook. Called the absorption-to-inventory velocity (AIV), this ratio serves as an indicator of how effectively the market absorbs or leases the newly supplied units on a net basis.
In the second quarter of 2023, the AIV ratio (on a rolling 4-quarter basis) for majority assisted living was 38:10 for the Primary Markets. This means that for every 10 new units added, there was positive absorption of 38 units in the Primary Markets. The AIV ratio for majority assisted living properties reached an all-time high, far exceeding any level recorded since NIC MAP Vision began reporting data in 2005, suggesting an ongoing trend of high acuity demand in the senior housing market and that the recovery will likely be sustained during the near-term given current supply and demand conditions. In the August 2023 NIC Insider Newsletter, we explore the AIV ratio in greater detail.
The inventory of majority independent living properties for the NIC MAP Primary Markets increased by 1.2% or 4,097 units from year-earlier levels in the July 2023 reporting period. AL inventory increased by 1.3% over this same period.
Occupancy Recovery Across Select Metropolitan Markets.The all-occupancy rate for majority independent living properties increased or remained stable in 27 of the 31 Primary Markets in the July 2023 reporting period compared with June 2023. At 86.8%, Riverside IL occupancy saw the largest increase from the prior month, up 1.5pps and is now 3.2pps above March 2020 levels. San Antonio IL occupancy fell by 0.5pps in July 2023 to 86.0%, marking the largest decline from June 2023. However, this rate is still 0.8pps higher than the pre-pandemic level in March 2020.
For AL, the all-occupancy rate increased or remained stable in 28 of the 31 Primary Markets in July 2023. At 78.3%, Houston AL occupancy saw the second largest increase, up 1.3pps from June 2023. The AL occupancy rate in Miami had the largest decline and fell 0.7pps from June 2023 to 83.2%. Both Houston and Riverside occupancy rates remained 1.4pps below pre-pandemic levels.
Keep track of the most timely comprehensive review of the sector’s market fundamentals and trends. The NIC Intra-Quarterly Snapshot monthly publication, available for complimentary download on our website, continues to provide a powerful and closely watched means to stay ahead of industry trends, even as senior housing markets sustain a fast pace of evolution and adaptation, amidst an apparent recovery.
The August 2023 Intra-Quarterly Snapshot report will be released on our website on Thursday, September 14, 2023, at 4:30pm.
Interested in learning more about NIC MAP Intra-Quarterly data? To learn more about NIC MAP Vision data, schedule a meeting with a product expert today.
1Q 2023 Lending Trends: Tighter Credit Conditions Take a Toll on Lending Activity in Senior Housing and Nursing Care
NIC Analytics released the 1Q 2023 NIC Lending Trends Report today. The quarterly report, available complimentary to NIC constituents, includes data trends over six years for senior housing and nursing care construction loans, mini-perm/bridge loans, and permanent loans, from 3Q 2016 through 1Q 2023.
Takeaways from the 1Q 2023 NIC Lending Trends Report
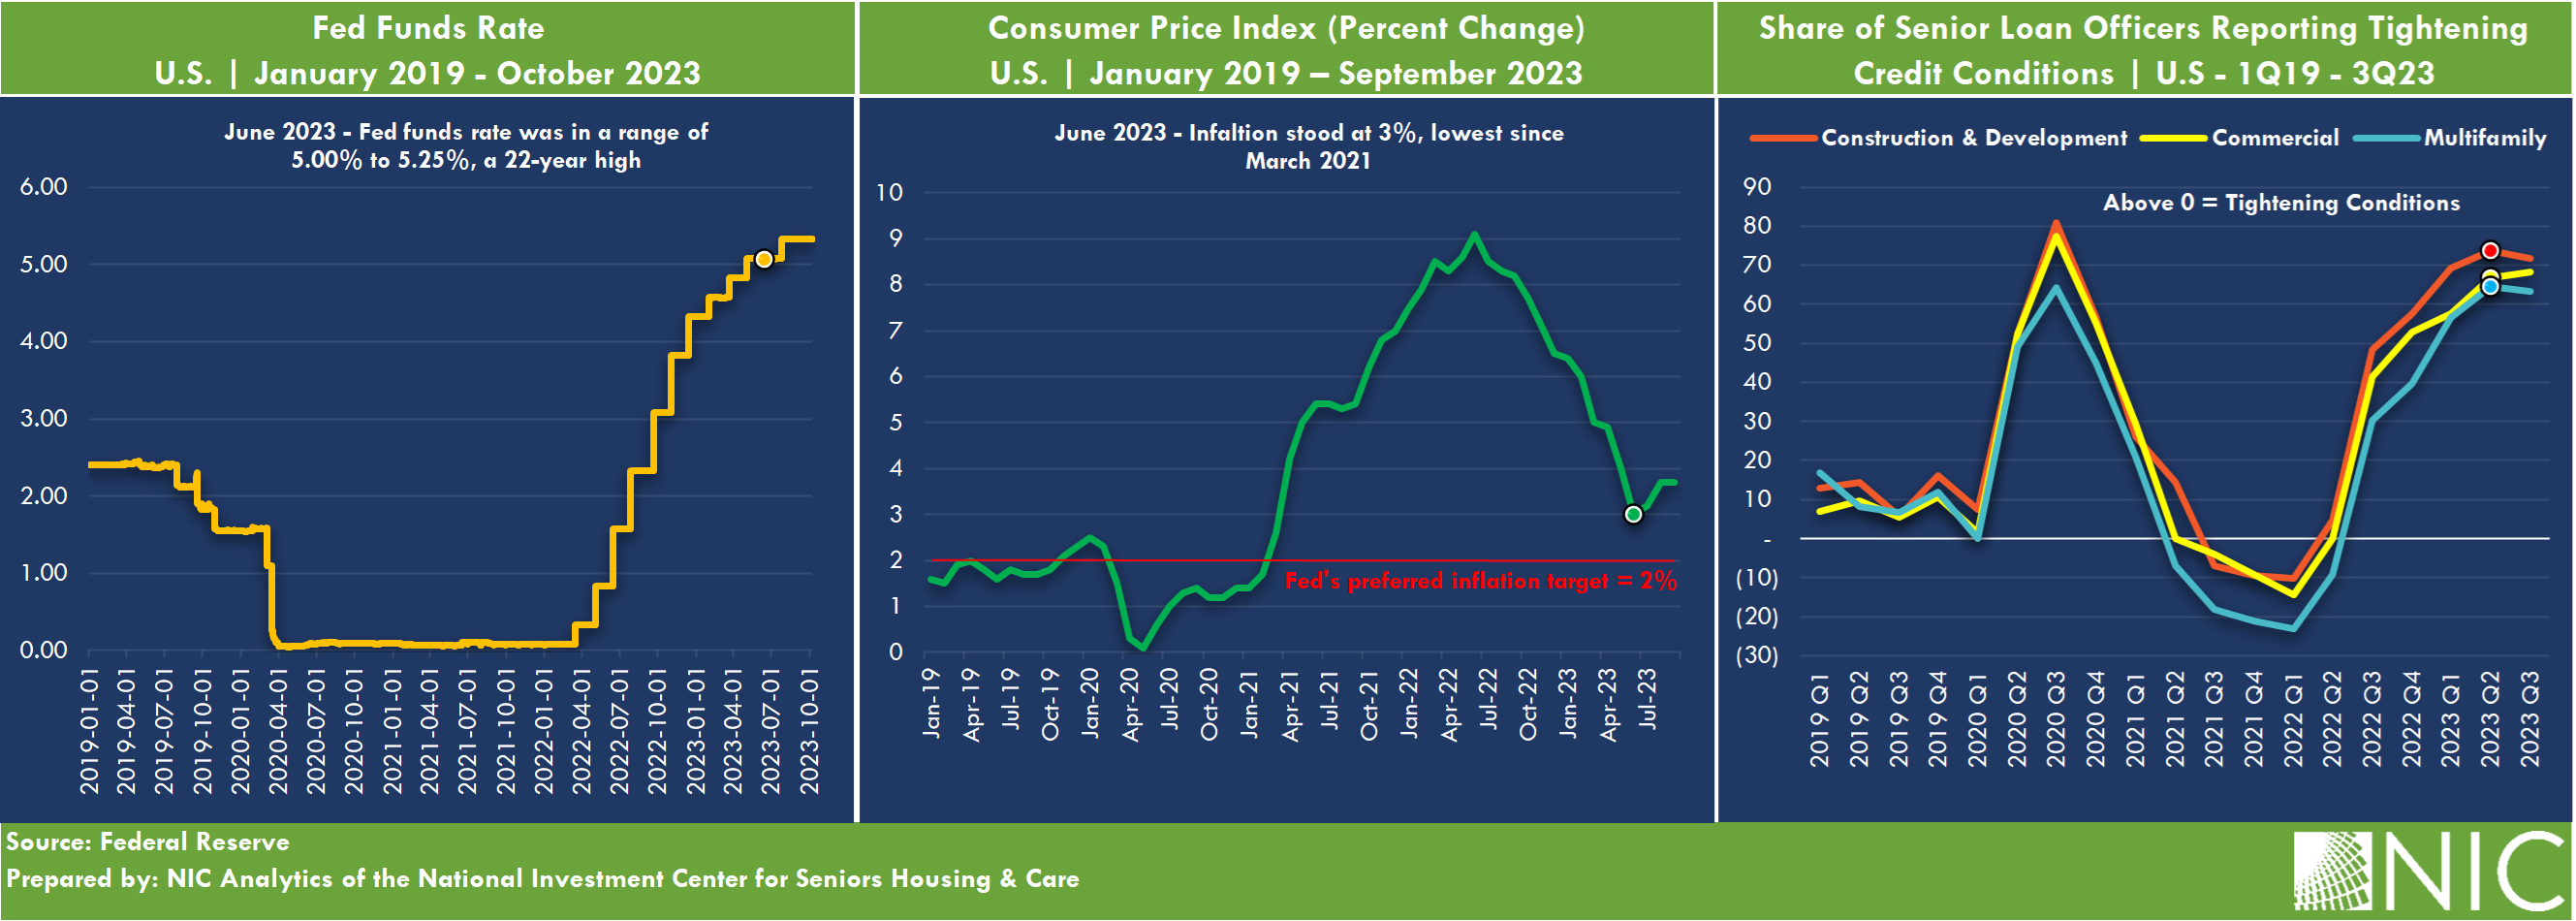
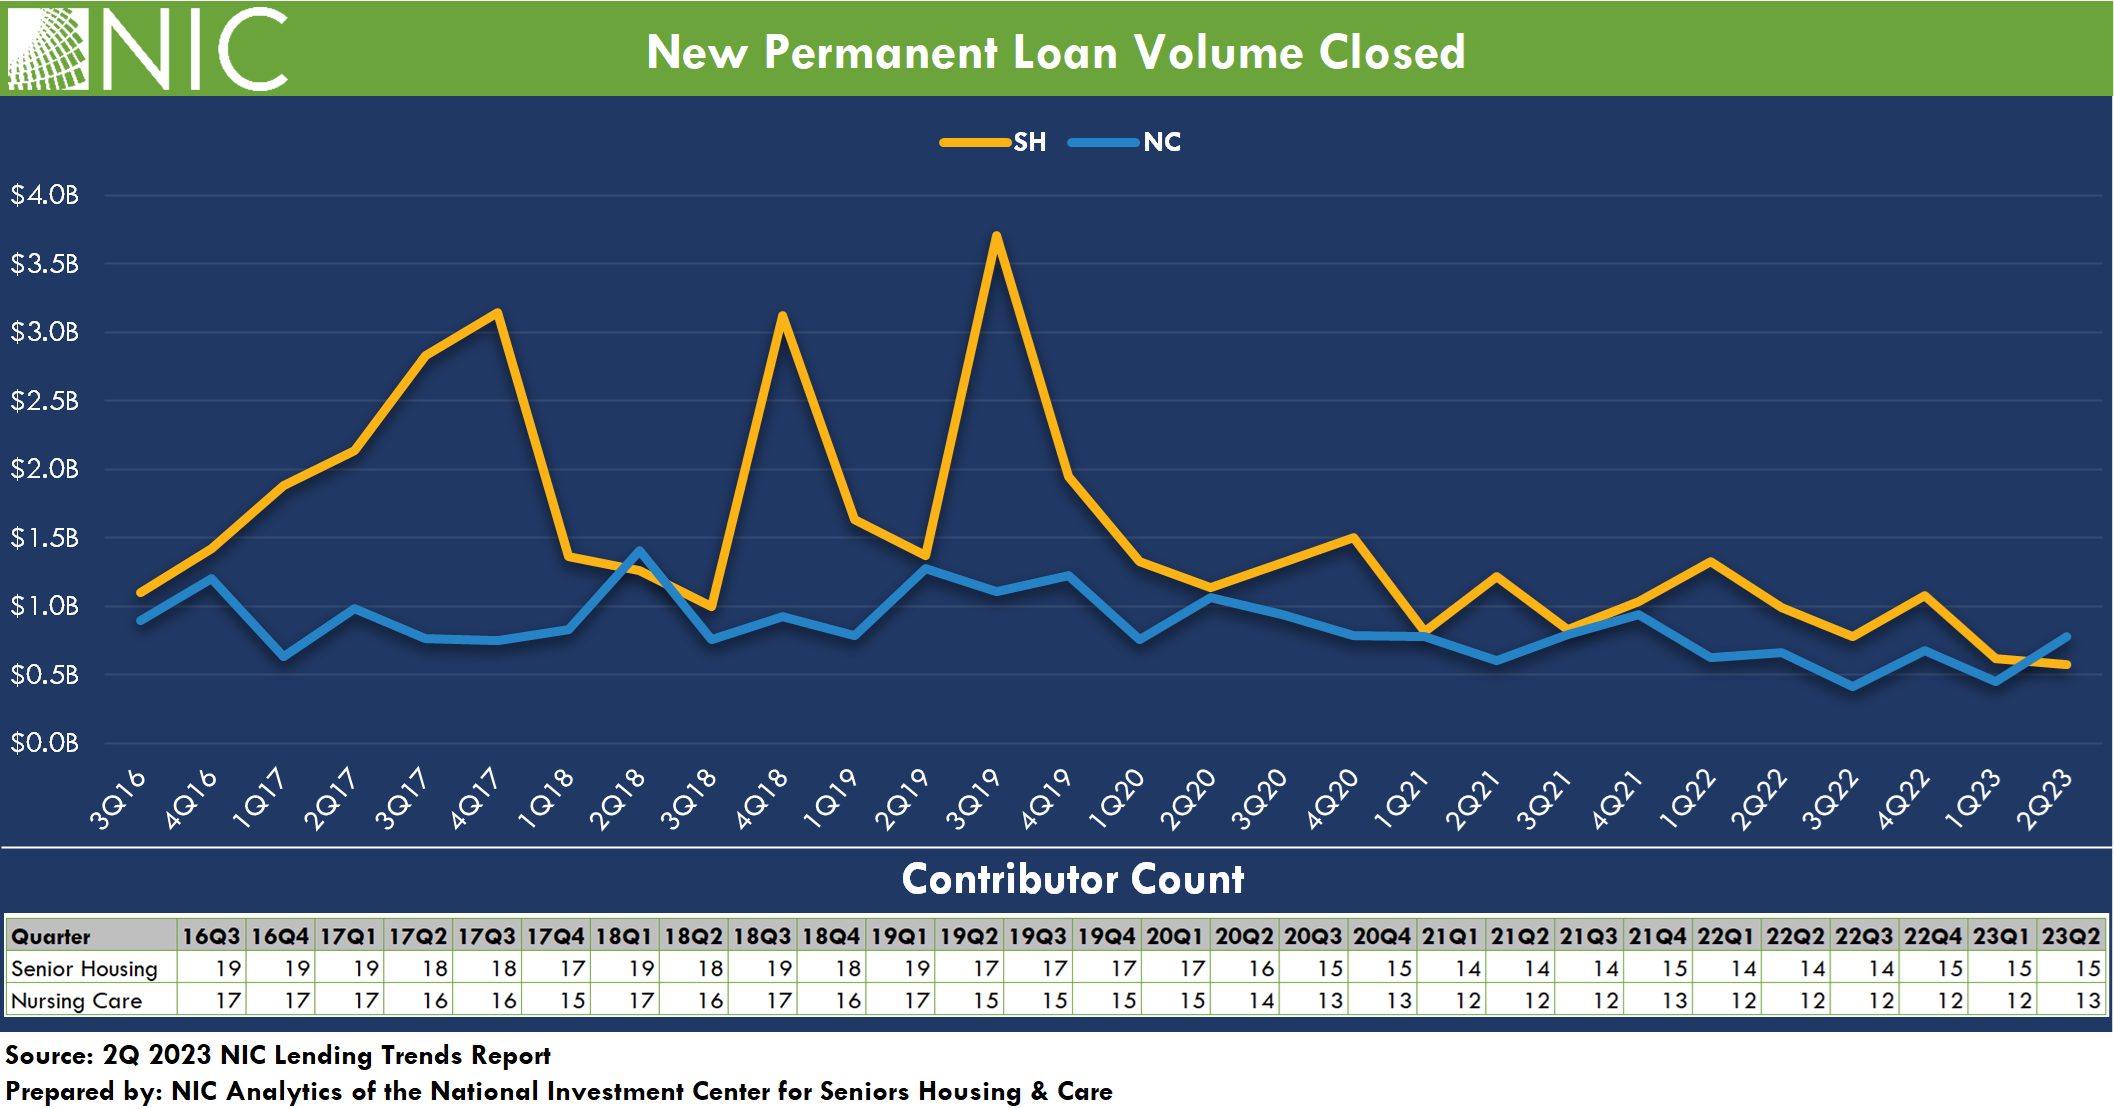
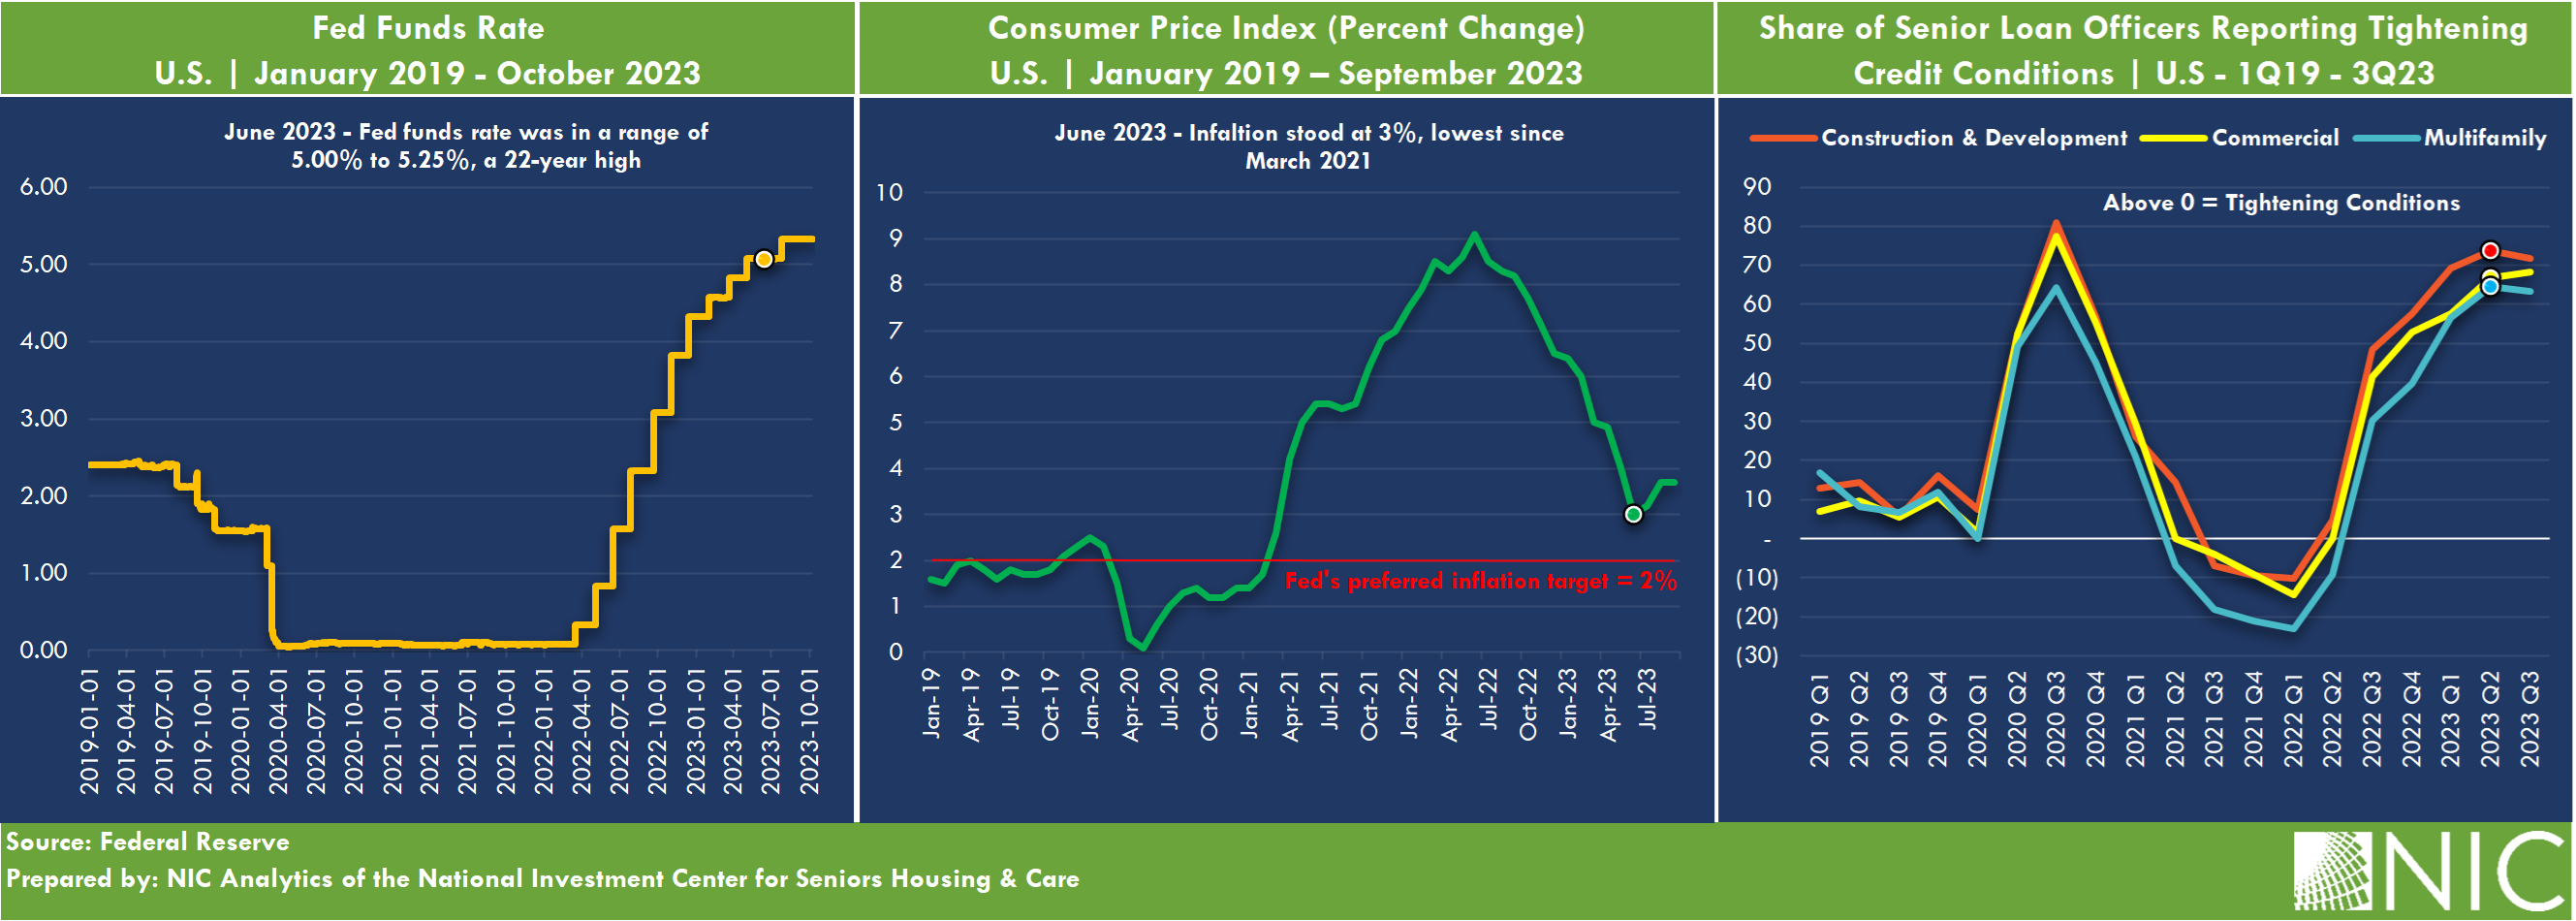
The issuance of new permanent debt reached a time series low for senior housing and a near record low for nursing care as well. The marked decline in permanent financing reflects tightening lending standards, widening spreads (i.e., the amount charged over the risk-free rate to compensate for risk), and lower loan proceeds. Credit conditions have changed dramatically because of the Federal Reserve’s efforts to slow economic growth to stem inflation through a series of interest rate hikes since March 2022.
The issuance ofmini-perm/bridgedebt for senior housing fell nearly 50% in the first quarter of 2023 from late 2022 levels. Mini-perm/bridge loan issuance was largely unchanged for nursing care and remained relatively low and on par with pre-pandemic levels. Heightened activity in the fourth quarter for senior housing bridge financing showed some borrowers’ preference for financing structures that offer flexibility – i.e., short-term loans over permanent ones for certain deals.
New construction loan closings for senior housing remained notably weak in the first quarter of 2023 compared to historical standards, with only two other periods in the time series matching this low level — the third quarter of 2022 and the first quarter of 2021. Issuance of construction debt for nursing care was virtually non-existent for the lenders sampled in the NIC Lending Trends Report. This aligns with the observed pattern of limited debt financing for new nursing care property construction since NIC began data collection in 2016. In fact, there has been limited development of new nursing care properties for several years.
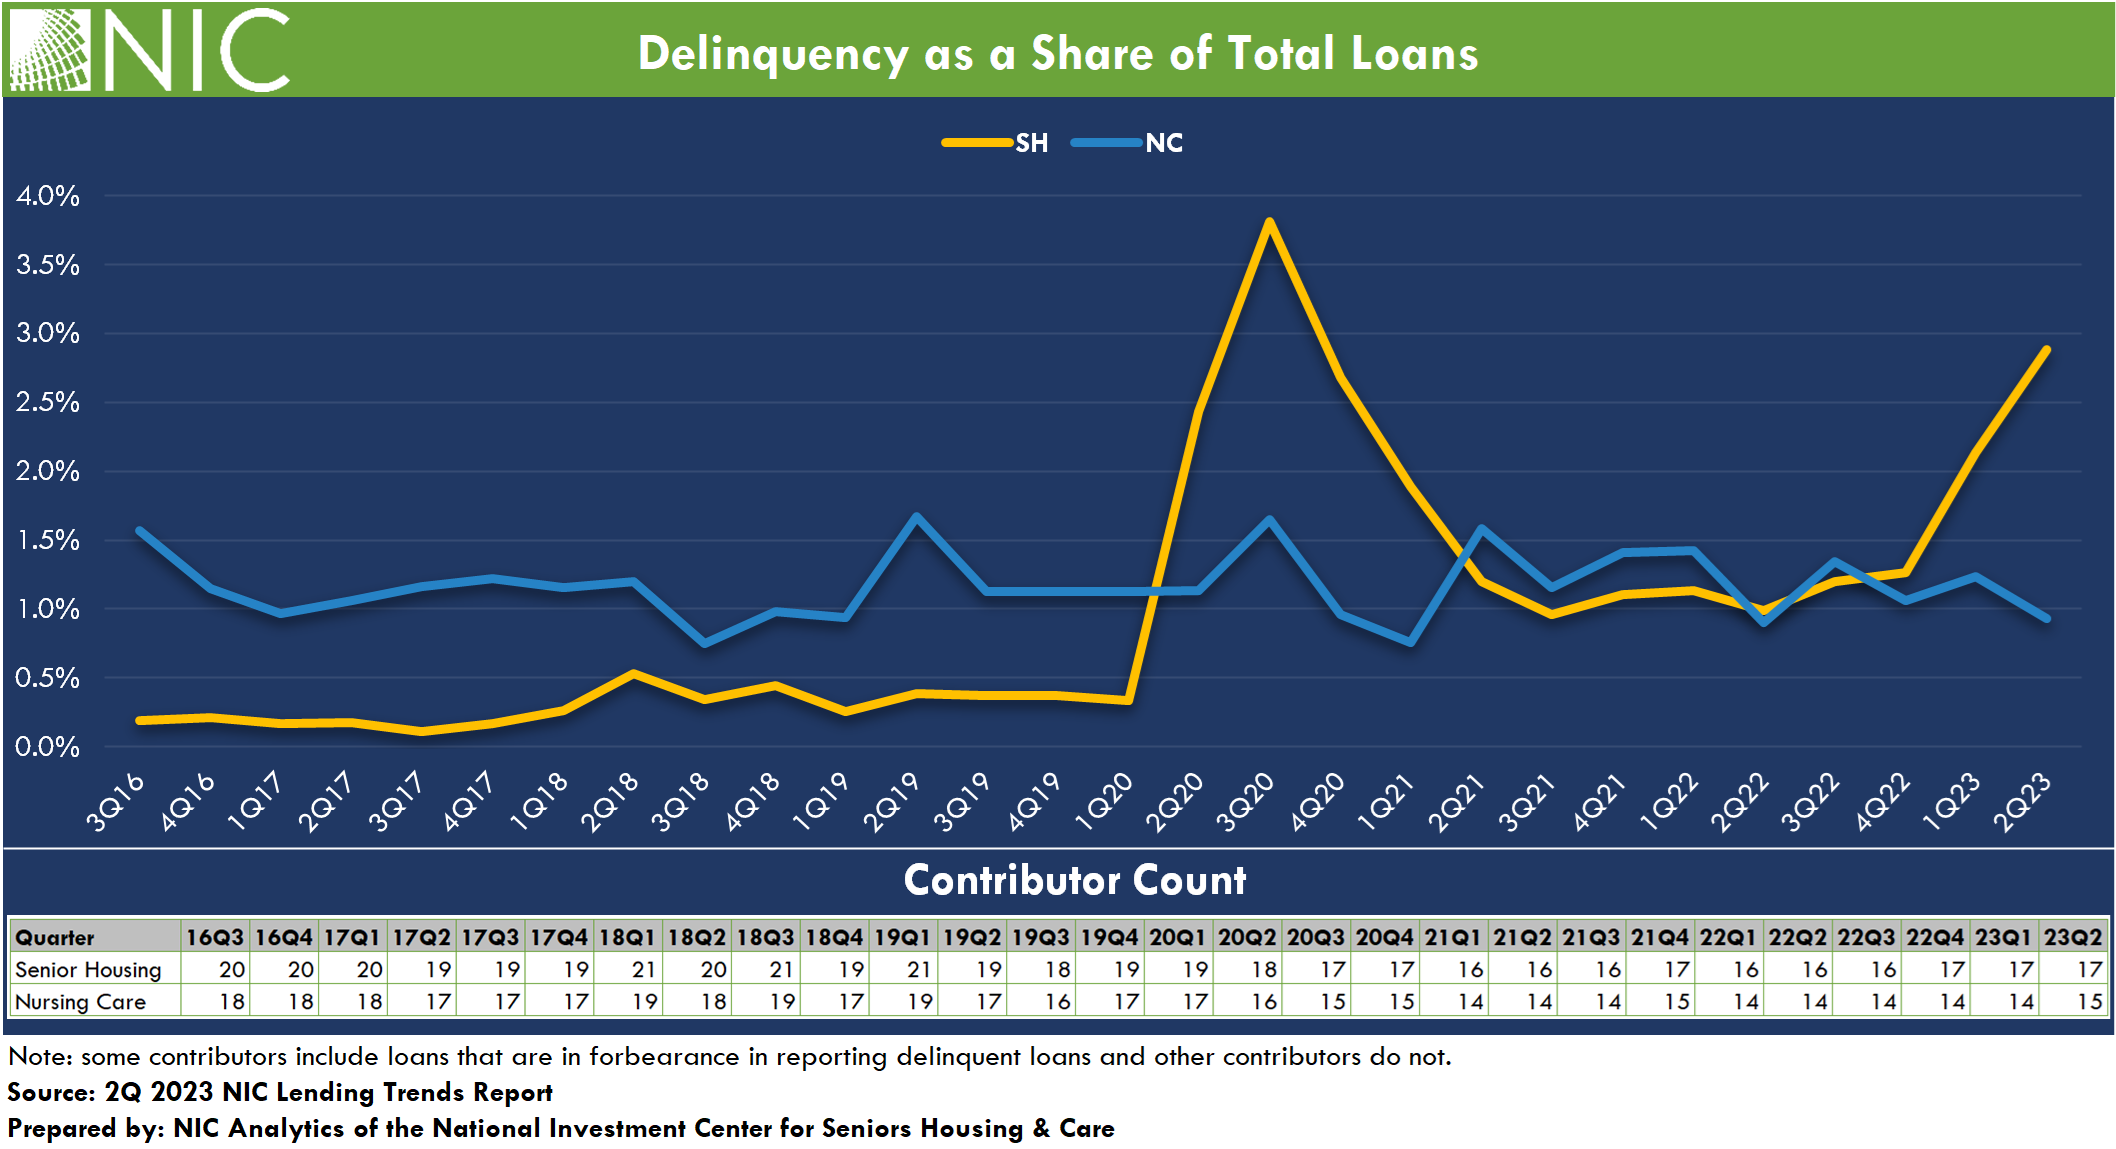
The total balance of senior housing delinquent loans saw a notable increase, though still lower than the high levels seen in the third quarter of 2020. Delinquencies in senior housing in the first quarter 2023 rose by 68.9%, while those in nursing care climbed by 16.0% from the prior quarter. Delinquencies as a share of total loans rose to 2.1% for senior housing, up from 1.3% in the fourth quarter of 2022. For nursing care, the delinquency rate edged up to 1.2%. Note that loans in forbearance are reported in the delinquent loan data for some debt providers. Also of note, some foreclosures were reported for the sample in first quarter 2023 for both senior housing and nursing care.
As background, the lending environment has tightened sharply in the past 16 months. The Federal Reserve raised interest rates by another 0.50 percentage points (pps) to 5.00% in the first quarter of 2023 (+0.25pps in February 2023 and +0.25pps in March 2023), up from 0% in March 2022 in an effort to tame inflation. Since June 2022, the annual inflation rate in the U.S. has continued to slow, decelerating for a ninth consecutive month to 5.0% in March 2023, down 4.1pps from the highs seen in June 2022 (9.1%). Meanwhile, senior housing construction starts remained relatively low in the first quarter of 2023, and the number of senior housing units under construction in the 31 NIC MAP Primary Markets remained near its lowest level since 2015, according to data released by NIC MAP Vision.
Looking ahead, these trends will likely persist in 2023. The broader economic landscape, characterized by relatively high interest rates and inflation, will continue to influence the senior housing and nursing care lending environment. This could result in further tightening of lending standards and an ongoing preference for short-term loans over permanent ones. The caution surrounding new construction financing and the elevated delinquency rates may also persist. However, the resilience and adaptability of this sector have been demonstrated time and again, and it will be interesting to monitor how these challenges are navigated moving forward. As always, understanding and responding to these trends will be critical for lenders, borrowers, and other stakeholders in the senior housing and nursing care sector.
From the Field: 1Q 2023 Survey Comments
In this release, we reached out to our network of contributors, engaging them with key questions about the lending environment for senior housing and nursing care. We sought to understand their strategies in response to changing capital market conditions, their lending patterns with respect to existing versus new clients, and any notable trends they observed in the market in the first quarter of 2023.
In the face of changing capital market conditions in the first quarter 2023, the responses indicated that lenders are responding to these changing conditions by focusing on strong sponsorship and strong credits. This trend reflects a reaction to a jump in the SOFR and 10-year Treasury rates, lower loan-to-value (LTV) ratios, tighter spreads, leaner proceeds, and higher equity requirements.
The first quarter of 2023 also saw a focus on long-term relationships with many lenders extending loans predominantly to existing clients. Limited transactions were completed with new clients. New financing requests mainly consisted of acquisition projects requiring substantial turnaround or lengthy runways, thus directing attention towards short-term bridge loans that can exit successfully within 18 to 24 months. Nonetheless, the number of new clients onboarded was relatively fewer due to tightened lending standards driven by higher interest rates.
The first quarter of 2023 continued to signal a cautious lending climate, with a significant slowdown in construction requests. Opportunities, however, have arisen for funds looking to acquire underperforming assets at discounted rates.
Note that this survey does not fully reflect the immediate disruption to the banking system following the failures of Silvergate, Silicon Valley Bank, and Signature Bank and the sale of First Republic Bank to JP Morgan Chase.
Download the complimentary 1Q 2023 NIC Lending Trends Report for full details on these and other trends in senior housing and skilled nursing lending.
Note: These data are not to be interpreted as a census of all senior housing and skilled nursing lending activity in the U.S., but rather reflect lending activity from participants included in the survey sample only.
The 2Q2023 NIC Lending Trends Report is scheduled for release in mid-November 2023.
Interested in participating? The NIC Lending Trends Report helps NIC Analytics to deliver on NIC’s mission to enable access and choice by further enhancing transparency of capital market trends in the senior housing and care sectors. We very much appreciate our data contributors. This report would not be possible without them.
If you would like to participate and contribute your data, please contact us at analytics@nic.org. As a courtesy for providing data, data contributors receive this report early before publication on the website. The information provided as part of the survey will be kept strictly confidential. Individual answers will be combined with the answers of all other respondents. Data acquired from this survey will only be reported in the aggregate, and therefore, the resulting aggregated data will not be attributed to you or your company upon distribution.
Amidst Increased Digital Leads, Responsive Sales Efforts Drive Move-Ins In Senior Living
After the historical occupancy rebound in 2021, current senior housing sales metrics largely reflect pre-pandemic conditions. But as markets return to normal seasonality patterns, sales and marketing strategies should be adjusted based on data-driven insights and away from pandemic occupancy recovery tactics.
Today, more leads originate from digital sources than ever, making individual attention and personalized nurturing of prospects even more critical. If this is the “new normal,” operators must adjust to managing and engaging growing volumes of inquiries to sustain the occupancy recovery.
As the pandemic’s significant disruption of the business cycle appears in the rear-view mirror, this article looks back at market conditions leading up to the pandemic compared to present conditions to illustrate the current state of the market and suggest opportunities for operators to boost sales.
Key takeaways:
Year-over-year occupancy growth shows signs of a moderate deceleration, suggesting that an adjustment in sales approaches may be appropriate in some situations.
Sales strategies that rely on “quick wins” may not maximize results.
Leasing counselors will continue to work with growing volumes of digital leads.
Personal engagement with prospects is associated with higher conversions.
Teams must become more resourceful in nurturing prospects from digital sources to increase conversions.
The data used for this analysis include U.S. senior housing data – independent living, assisted living, memory care, and CCRCs (Continuing Care Retirement Communities) – from the Aline Marketing and Sales CRM. This analysis comprises 1,623,614 new leads and 175,561 move-ins.
While still positive, the momentum of senior housing occupancy growth has slowed to some degree since 2022 depending on the property type and geographic location. Some potential reasons for the moderation include downward pressure due to rising rents, increased competition from other senior living options and in-home care, a downturn in housing markets due to interest rate hikes to combat inflation, and deferred capex spending to keep aging properties up to date. Higher acuity options—memory care and assisted living—have experienced the most improvement in occupancy rate growth since emerging from the pandemic.
Operators relying on a sales strategy of “quick wins,” with prospects moving in within 30 days of contact, are missing opportunities to increase margins. Contrary to conventional wisdom, the volume of prospects by care level with an “urgent need” to move in (less than 30 days) has changed little since before the pandemic. (It is important to note that “urgent need” does not necessarily equate with prospect acuity.) The percentage of residents that moved in within 30 days of inquiry compared between 2019 and 2023 ranged from 43% to 49% for independent living communities, 57% to 56% for assisted living, 58% to 62% for memory care communities, and from 25% to 28% for CCRCs. Consequently, approximately one-half to just over one-third of independent living, assisted living, or memory care prospects and nearly three-quarters of CCRC leads require more than minimal time and effort from sales teams to exceed baseline expectations.
Due to increasinggrowth in age 75+ households and the growing adoption of digital marketing tools and referral sources to produce inquiries,senior housinglead generation and conversions have increased. Yet conversions have not kept pace to the same degree. In the first quarter of 2023, the average 100-unit building generated 44 leads per month compared to 32 just four years prior—representing an increase of 38%. However, the average 100-unit building generated an average of 4.5 monthly move-ins—a 27% increase since March 2019. On an annual basis, the rate of lead growth in the first quarter of 2023 was 8.6%—an improvement over 2019 (3.0%). Conversely, the annual growth of move-ins in the first quarter of 2023 was 6.3%–notably lower than in 2019 (14.9%).
Although considerably more leads originate from internet sources than before the pandemic, the increase in conversions from digital marketing, direct website, and paid referral sources has increased but to a lesser degree than the volume of leads produced from these sources. Nearly two-thirds of leads are now generated by digital sources—up from about one-half before the pandemic. However, only about 40% of conversions are derived from these sources (up from 30% before the pandemic).
Given the pandemic’s lingering strain on operating budgets and compressed margins, sales and marketing teams are challenged with finding ways to allocate valuable time and resources in the most fruitful ways. According to Aline’s statistical analysis of the productivity of specific sales activities, being responsive instead of reactive and focusing on high-value tasks such as building relationships with prospects results in a higher probability of converting prospects.
Some typical sales activities are correlated with a higher likelihood of producing move-ins—such as tours, home visits, and planning sessions, while others are less so. Many operators place paramount importance on call-out quotas—but call-outs do not produce move-ins alone! Others bank on time and resource-intensive sales events, but could those efforts be better expended with a personalized plan for the next interaction with a prospect? Activities should be considered based on a prospect’s unique needs and the sales team’s time and resources. Consider professionalizing sales teams and investing in tools that amplify efficiencies and bolster return on investment.
Demographics will continue to drive inquiries, and more will originate from digital sources. As leasing counselors are challenged to become more resourceful in managing greater volumes of digital leads, high-impact, personalized activities such as voice-to-voice and face-to-face interactions, planning, and creative follow-up are crucial in advancing a prospect. How will sales teams keep up and convert more prospects into sales? Senior housing operators must work smarter, not harder.
For more information and to schedule a demo, please visit www.alineops.com.
About Aline
Aline has the industry’s most extensive and robust set of real-time data for identifying and understanding broad trends in the nation’s senior housing sales and marketing metrics. Providing a senior living operating system created to meet the industry’s most complex challenges – in a single software platform, the company serves sales, operations, and clinical teams in more than 5,700 communities across the senior living, post-acute, and home care sectors. The Aline senior living operating system increases efficiency, delivers performance gains, and connects residents, staff, and family members with industry-leading CRM, marketing automation, financial, reporting and care solutions.
Skilled Nursing Occupancy Continues to Hover Around 81%
NIC MAP Vision released its latest Skilled Nursing Monthly Report on August 3, 2023. The report includes key monthly data points from January 2012 through May 2023.
NIC MAP Vision released its latest Skilled Nursing Monthly Report onAugust3, 2023. The report includes key monthly data points from January 2012 through May2023.
Here are some key takeaways from the report:
Occupancy
Skilled nursing property occupancy decreased 3 basis points from April to end May at 81.0%. Occupancy is up 97 basis points from one year ago in May 2022 as it continues to recover since the pandemic low of 74.7% set in January 2021. However, occupancy is down 8 basis points from January 2023 as challenges do persist with staffing shortages that continue to create difficulties within skilled nursing properties limiting the ability to admit new residents in some markets. The current occupancy trend over the past year does suggest that demand for skilled nursing properties is recovering. Occupancy remains low compared to February 2020 pre-pandemic levels of 88.9% (7.8 percentage points).
Managed Care
Managed Medicare revenue mix increased 11 basis points from April to end May at 11.4%. It has declined 111 basis points since its recent high of 12.5% in February 2022, but it is up by 219 basis points from the pandemic low set in May 2020 of 9.2%. Expectations are that it will continue to increase over time with the continued growth of managed Medicare. Meanwhile, Managed Medicare revenue per patient day (RPPD) declined 0.4% ending May at $483 and it is down 0.8% from last year in May 2022. It has decreased $125 (20.5%) since January 2012 and continues to pressure some operators’ revenue as managed Medicare enrollment grows around the country. However, some operators see managed Medicare as an opportunity for growth in patient volume.
Medicaid
Medicaid patient day mix increased 52 basis points to 65.8 % in May. It has increased 268 basis points from the pandemic low of 63.1% set in February 2022. In addition, Medicaid revenue mix increased in February, representing over half of property revenue at 51.1%. It has increased 230 basis points from the pandemic low of 48.8% set in February 2022. Meanwhile, Medicaid revenue per patient day (RPPD) decreased to $269 in May. It increased 3.0% from $261 one year ago in May 2022.
Medicare
Medicare revenue per patient day (RPPD) increased slightly from April to end May 2023 at $592. It has increased 2.7% since September 2022. Most of this increase in reimbursement is likely a result of the increase in Medicare rates to skilled nursing properties for fiscal year 2023 and potentially higher acuity patients, which also increases RPPD to care for more complex patients. Meanwhile, Medicare revenue mix decreased for the second month in a row. It decreased 98 basis points from April to end May at 20.6%. It is down from one year ago as well, decreasing 34 basis points from May 2022.
The report provides aggregate data at the national level from a sampling of skilled nursing operators with multiple properties in the United States. NIC continues to grow its database of participating operators toprovide data at localized levels in the future. Operators who are interested in participating can complete a participation form on our website. NIC maintains strict confidentiality of all data it receives.
We use cookies on our website to give you the most relevant experience by remembering your preferences and repeat visits. NIC's privacy policy can be viewed here. By clicking “Accept”, you consent to the use of ALL the cookies.
This website uses cookies to improve your experience while you navigate through the website. Out of these cookies, the cookies that are categorized as necessary are stored on your browser as they are essential for the working of basic functionalities of the website. We also use third-party cookies that help us analyze and understand how you use this website. These cookies will be stored in your browser only with your consent. You also have the option to opt-out of these cookies. But opting out of some of these cookies may have an effect on your browsing experience.
Necessary cookies are absolutely essential for the website to function properly. This category only includes cookies that ensures basic functionalities and security features of the website. These cookies do not store any personal information.
Functional cookies help to perform certain functionalities like sharing the content of the website on social media platforms, collect feedbacks, and other third-party features.
Performance cookies are used to understand and analyze the key performance indexes of the website which helps in delivering a better user experience for the visitors.
Analytical cookies are used to understand how visitors interact with the website. These cookies help provide information on metrics the number of visitors, bounce rate, traffic source, etc.
Advertisement cookies are used to provide visitors with relevant ads and marketing campaigns. These cookies track visitors across websites and collect information to provide customized ads.