In April NIC MAP released first quarter data for the 875 active adult rental communities they track across the U.S. These communities cater to mostly healthy adults age 55+ who want to live in a community designed for active lifestyles and interaction with peers and who do not yet need or want on-site healthcare services.
Key takeaways from the first quarter data included the following:
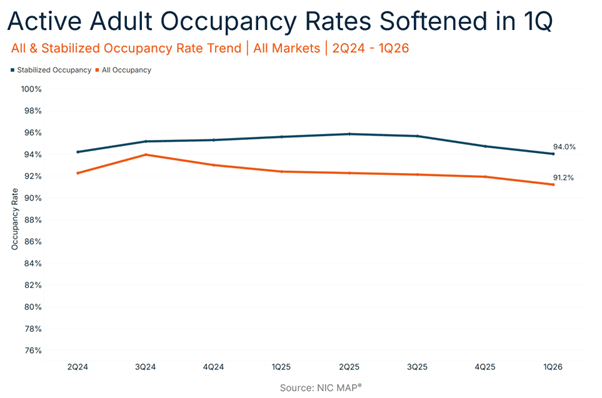
Takeaway #1: Active Adult Occupancy Rates Softened in 1Q
- In 2025, roughly 6,800 new units opened, a decline from the 8,500 new units delivered in 2024. In the first quarter of this year, less than 500 new units came onto the market.
- Although new supply was lower in 2025 than in 2024, this new inventory, along with increased economic uncertainty and a stalled single-family housing market, may have had a moderate impact on active adult occupancy rates.
- The active adult occupancy rate stood at 91.2% in the first quarter, falling 0.7 percentage points from the prior quarter.
- For stabilized properties open at least two years, occupancy rates also declined 0.7 percentage points to 94.0%.
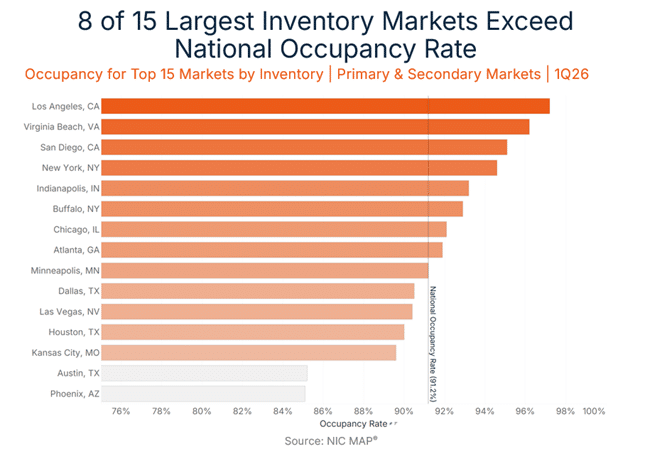
Takeaway #2: Eight of 15 Largest Inventory Markets Exceed National Occupancy Rate
- Below are the largest 15 Primary & Secondary Markets by Active Adult Inventory and ranked by stabilized occupancy.
- The U.S. average occupancy rate of 91.2% is shown in the dotted line.
- Eight of the 15 largest markets have occupancy rates above 91.2%, with Minneapolis at the national average.
- Anecdotally, the bottom markets in this chart – Austin and Phoenix – in the past few years have had a lot of new units arrive online – both active adult and conventional multifamily – and, as a result, may be seeing signs of slower lease up and lower rent growth.
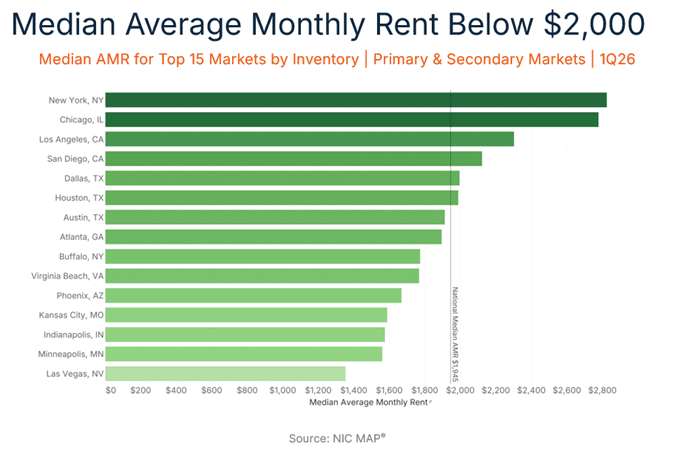
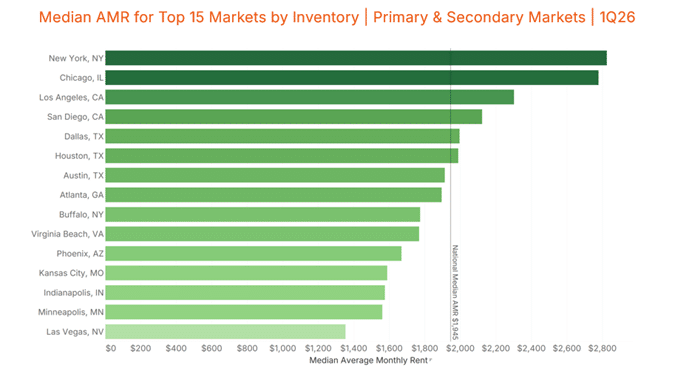
Takeaway #3: Median Average Monthly Rent Below $2,000
- For the 15 largest active adult markets, the bar chart below shows median rents in each metro area, while the dotted line shows the national median at $1,945 per month.
- Most of these 15 markets are at or below this $2,000 threshold, although New York and Chicago approach $3,000.