How AI innovation is helping operators of every size adapt to prospect new behavior and make every touchpoint count
Two decades ago, online search shifted how consumers researched their housing and care options, reshaping senior living sales, and now consumer behavior is shifting again. Instead of typing keywords and scanning a list of links, families today are asking artificial intelligence (AI) tools like ChatGPT a full question, such as, “What’s the best memory care near me for my mom who wanders?” These inquiries often eliminate the need to visit individual websites, with AI delivering a detailed written answer and recommendations that may name specific communities.
Comparison: Using search vs. AI answers
|
Then (2000s) Online search |
Now (2020s) AI answers |
|
|---|---|---|
| What the prospect does | Types a few keywords, such as “memory care near me” | Asks a full question, such as “What’s the best memory care near me for my mom who wanders?” |
| What comes back | A ranked list of ads and website links | A written answer that may name specific communities |
| Who shows up first | Whoever buys ads and ranks highest, often lead aggregators | Communities that AI tools can find clear, detailed, and accurate information about |
| What the prospect does next | Clicks through several sites, often filling out an aggregator’s inquiry form | Contacts communities named, often without visiting a website |
| What operators need for better positioning | Search engine optimization (SEO) and an ad budget | Answer engine optimization (AEO): clear, accurate website content |
Industry expert Renee Kimberly, Vice President of Sales Strategy and Enablement at Senior Lifestyle, is seeing more prospects enter the sales pipeline mid-funnel, having already used AI tools to research their options.
At the same time, AI tools place capabilities that once required a large technology budget or a data science team within reach of operators of any size. Together, these changes are beginning to reshape how the industry reaches and responds to prospects.
The 2025 Argentum Technology Reporti found that 76% of its senior living respondents believe AI will have a positive or transformative impact on operations. Lifeloop’s 2025 report, The state of AI in senior living: Trends & opportunitiesii, revealed that 36% of senior living operators reported using AI tools, a sharp increase from the 9% reported just a year prior.
AI adoption is climbing, but the numbers vary widely depending on who is surveyed and how “using AI” is defined. Many operators are understandably cautious. Technology costs have always been a budget issue and AI introduces concerns about security and reliability. Yet sales and marketing is one of the safest places, compared to the clinical area as an example, to start implementing AI solutions: it’s lower-risk, easy to explain, and quick to show measurable results.
This article looks at what operators should understand before investing in AI tools and how three operators — Avanti Senior Living, Phoenix Senior Living, and LCS — are using AI to reach prospects more effectively and improve their sales and marketing results, with additional insights from industry expert Kimberly.
Renee Kimberly — Laying foundations for AI analysis
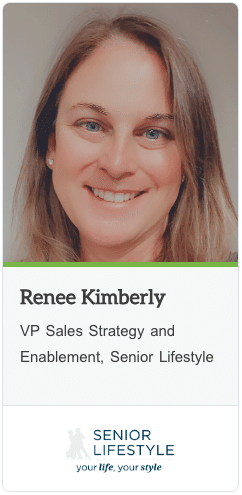
Kimberly, though recently appointed to her leadership role at Senior Lifestyle, has been leading data analytics and technology innovation in the senior living industry for more than 22 years. “Throughout my career, I’ve believed that great technology should empower people,” Kimberly said.
Senior Lifestyle is listed in the American Seniors Housing Association’s 2026 ASHA 50 as one of the nation’s largest owners and operators of seniors housing, serving residents’ needs from independent living through skilled nursing and other specialized services. Kimberly specializes in using AI to analyze sales leads for sentiment, tone, nuance, and communication preferences. That analysis helps identify prospect intent and overcome objections in the sales funnel, which matters more now that prospects increasingly arrive already informed by AI.
One project she led deployed an AI agent (software that can act on its own to complete a task) to understand why prospects might hesitate to start a conversation with a community team. The AI processed 15,000 leads, generating different “call to action” email messages, and tracked how each performed. Two possible barriers emerged: wariness of the stereotypical pushy salesperson, and reluctance to share sensitive personal health information. The AI then suggested messaging that addressed those concerns, focused on developing a relationship early, and gave prospects “permission” to engage. The approach resonated: Harder-sell tactics delayed decisions, while building trust removed barriers more quickly.
She noted that the AI analysis also provided a new sales perspective: whereas sales teams viewed a tour as “intent,” most prospects viewed a tour as “explore.” This insight further reinforced the importance of relationship-building and earning trust during tours.
Kimberly encourages operators to overcome their fears around AI through simple experimentation as well as through education. “Embrace AI,” she said, “because your customers are.” She suggests three starting points:
- Take an AI prompt-writing course. Prompts are the instructions to generative AI tools. The better your prompts, the better the results.
- Learn how to use AI responsibly and securely. AI tools given free rein can expose personal, financial, or health data.
- Know the basics of answer engine optimization (AEO). AEO means writing and organizing your website so AI tools can find relevant and accurate information about your community, such as care levels, pricing, and location, and include it in their answers.
Whether you intend to build your own AI tools or use a product partner’s, Kimberly recommends first gaining a foundational understanding of how AI communicates with your prospects. In the early 2000s, search engine optimization (SEO) shaped which communities families found online and created a pay-for-ranking structure that most operators couldn’t compete in. AEO now shapes which communities AI tools recommend.
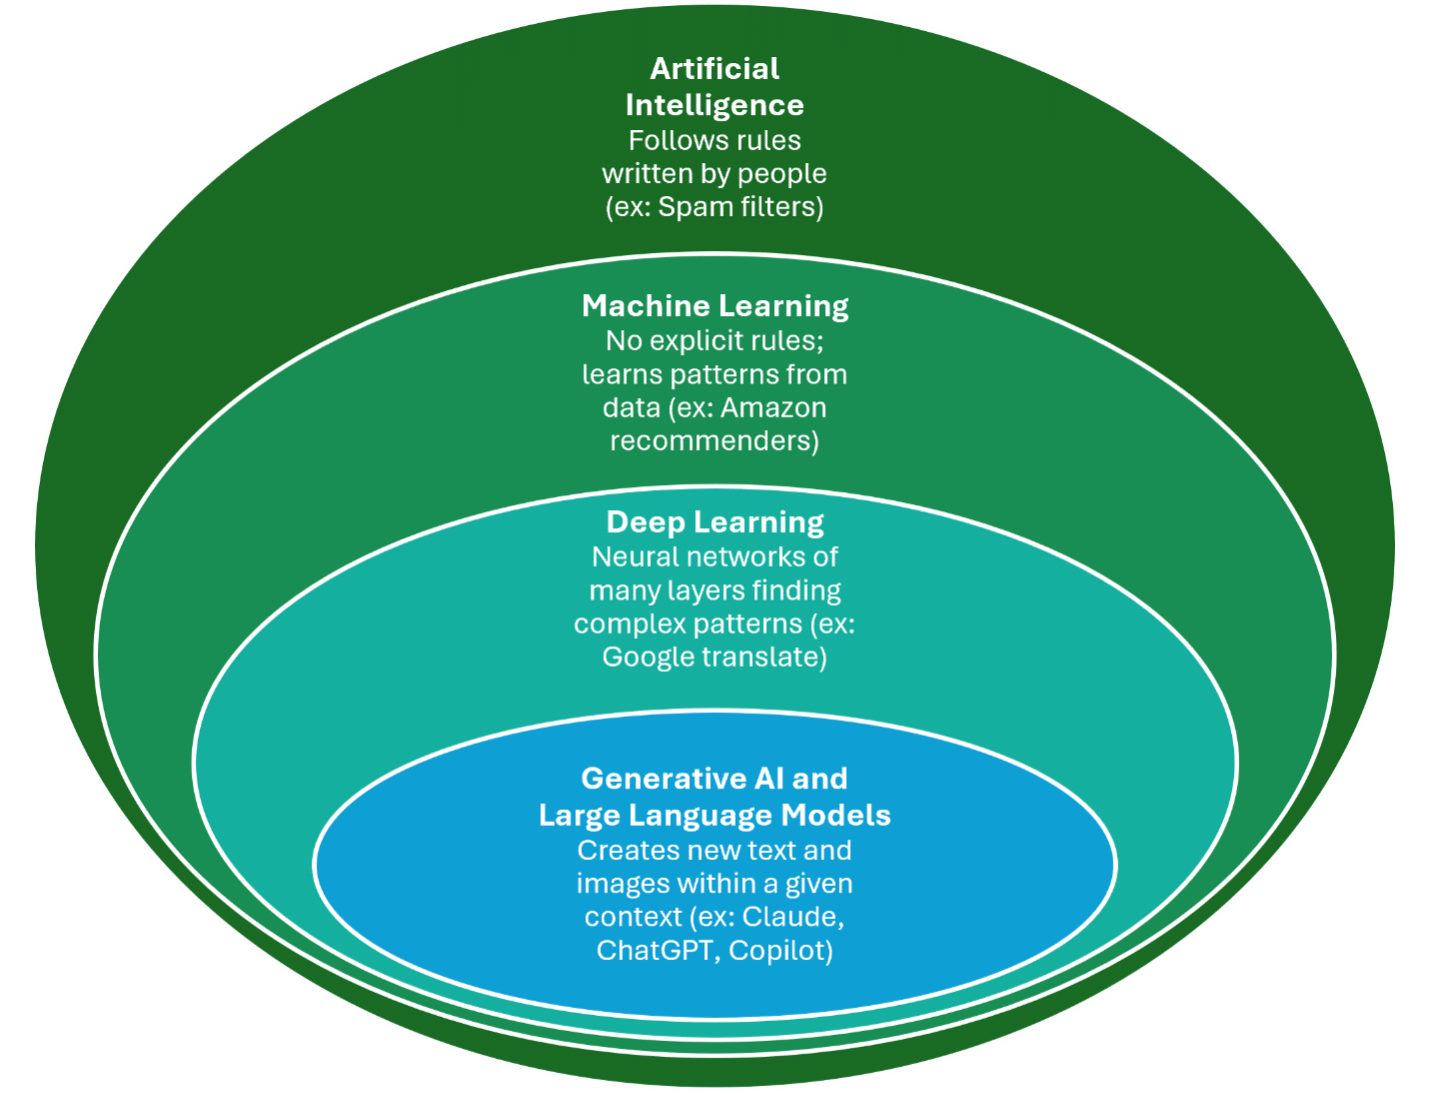
The layers of artificial intelligence (AI)
Three senior living AI use-case examples
The three operators profiled below represent distinct paths to AI adoption at different scales: Avanti, with seven communities, built its own tool; Phoenix, which manages 55 communities, partnered with a technology vendor; and LCS, managing over 130 communities, developed an in-house data science function. Their experiences show how internal capability, scale, and vendor relationships can shape an operator’s approach.
Avanti Senior Living — A founder-led AI Strategy

With seven luxury assisted living and memory care communities, Avanti Senior Living shows what a smaller operator can do with AI. Founded in 2013, Avanti is headquartered in Spring, Texas.
Lori Alford, CEO of Avanti Senior Living, has spent 26 years in senior living championing innovation and technology for resident care and experience. Avanti continually looks at where technology can improve processes and decisions or reduce repetitive work.
Alford has woven AI adoption into the core of Avanti’s culture, and that culture has deep roots: the company has used automation for over a decade. Though not the AI of today, those early tools taught Avanti the value of automating repetitive work and built a team willing to explore how technology can support its mission.
In 2023, after personal projects showed her how easy it could be to create with AI, Alford recognized the potential benefits it could bring to Avanti’s sales and marketing process. In 2024, she partnered with a coder to build a sales AI agent for Avanti—software that texts new inquiries, logs activity, and scores leads on its own. Her own comfort with AI made building, rather than licensing a commercial product, a practical choice for Avanti, though it is not the only route for a smaller operator. The vision she shared with her sales team was to have AI “take the mundane tasks away, so you can focus on residents more.”
Deploying this proprietary AI agent gave Alford the ability to customize around Avanti’s own sales process, iterate quickly, establish scoring logic, and begin using the resulting intelligence before some of those capabilities were readily available within its third-party CRM software. In effect, Avanti owns both the tool and the intelligence it produces.
The speed-to-lead results came quickly. Every new inquiry gets an instant text, day or night, and the median time to first human contact went from 11.6 hours (including non-working hours) to 5.4 hours. Alford estimates that the agent saves each sales counselor three to five hours per week by eliminating the need to chase first touches and log activity.
“AI should not replace the relationship in senior living,” says Alford. “It should remove the friction around the relationship.” If AI can reduce administrative work, identify which prospect needs attention, or help manage a waitlist more strategically and give leaders better information, the salesperson has more time for conversations and building relationships that lead to move-ins.
Although Alford is well versed in AI and manages the agent herself, she sees her role as executive sponsorship, guiding rapid experimentation and getting the organization comfortable adopting new ways of working—disciplines that even a leader less AI-savvy can implement.
Alford also spends significant time in the field with her sales teams. “Great ideas come from both sides, not just the technology end,” she said.
Avanti hosts AI training classes for its sales team two to four times a year. “AI fluency is becoming a core skill for our teams, so we invest in helping people understand how to use it effectively,” Alford explained.
Alford’s biggest lesson as a CEO is to stay clear on why AI is being used, what operating problems it solves, and the impact it’s having.
For operators looking to develop their own AI processes, Alford has direct advice: “You can do it,” she encourages, “just start.” Alford recommends starting by identifying the recurring decisions, administrative work, and information gaps that repeatedly slow your teams down, rather than beginning with choosing an AI product.
Phoenix Senior Living — Vendor partnership at the core

Phoenix Senior Living, headquartered in Roswell, Georgia, manages 55 communities across 10 states, serving more than 3,700 residents with a continuum of care from independent living through skilled nursing and respite care. Its vendor-led approach is a route open to operators of any size.
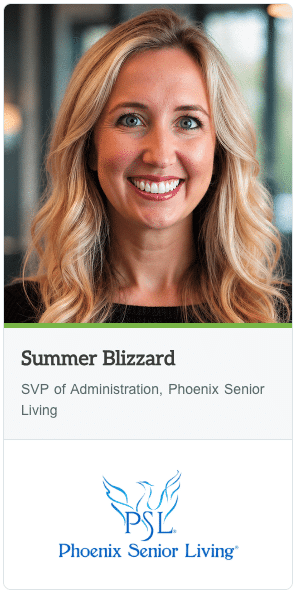
Justin Harden, VP of Sales & Marketing, and Summer Blizzard, SVP of Administration, credit a culture of innovation and strong partnerships with technology firms for much of their success in implementing AI initiatives. “It’s always been about keeping the focus on serving seniors — putting our residents first,” explained Blizzard.
In 2024, with AI already easing administrative work elsewhere in the company, Phoenix’s sales and marketing team wanted to bring it into the sales process. “Our goal was least friction to sale,” Harden said. “Sales directors documenting conversations, mundane CRM tasks, those things took time away from face-to-face conversations. We wanted to give back time to our sales teams,” he explained.
Phoenix partnered with Further, a senior living sales and marketing technology company. Over a series of conversations, the Further team asked strategic questions that helped Phoenix determine best-fit solutions and build a rollout plan.
Phoenix started with sales director training, using Further’s AI-driven roleplay simulations. The AI dials the salesperson’s phone like a real inquiry, asking about pricing, services, amenities, and care. It shares details only when asked, so salespeople practice qualifying a prospect.
“The teams were uncomfortable with being trained by an AI agent at first,” Harden shared, “so we used that feedback to add more education about AI into the training.” Now they appreciate how AI simulations remove stress from learning since there’s no worry about losing a real lead, and how the roleplays can be completed independently, on their own schedule.
In late 2025, Phoenix deployed “Teri,” a conversational, generative AI agent, as its virtual receptionist for all incoming telephone calls. The program is named in honor of Phoenix CEO Jesse Marinko’s late mother. Powered by Further’s proprietary large language model (LLM), Teri answers questions warmly, schedules tours, and routes callers to the right staff.
Harden and Blizzard shared that some prospects have even arrived for tours asking to meet Teri and thank “her” for being so helpful.
Phoenix had originally planned to pilot Teri, but after seeing immediate benefits it rolled Teri out to all communities. Further’s integration with Yardi software pushes prospect data directly into Yardi’s CRM, so every inquiry Teri handles adds to Phoenix’s own prospect history.
Since deploying Teri, Phoenix has seen its inquiry-to-tour conversion rate increase by 6%. Combined with other AI-assisted CRM tasks, sales teams save around 15 hours per week.
The rollout was not without its challenges. When senior executives called Teri with higher-level questions, they uncovered several “areas of opportunity,” as Harden put it. Teri had initially struggled with pivoting when a caller changed topics mid-conversation and was trained to transition more smoothly.
Because Further hosts everything, Phoenix didn’t need to invest in hardware, infrastructure, or engineering staff—a model that puts sophisticated AI tools within reach of operators without in-house technical teams. “Our tech stack is pretty lean,” commented Harden. “We have Further and we have Yardi.” Next on Phoenix’s wish list: competitive intelligence tools to better position its communities.
When asked about what advice they have for other operators, Harden and Blizzard agreed that the right relationships are vital. “Choose to work with tried-and-true vendors who have a deep understanding of the industry,” said Harden.
LCS — Building an in-house data science function
LCS is one of the nation’s largest operators of not-for-profit senior living communities and, according to the 2026 ASHA 50, the third-largest senior living operator in the country. Its in-house approach shows what AI looks like on an enterprise scale, with lessons for operators of any size. LCS leaders saw an opportunity and a problem: years of prospect and sales data spread across the organization weren’t being fully used, and community sales teams’ time was stretched thin.
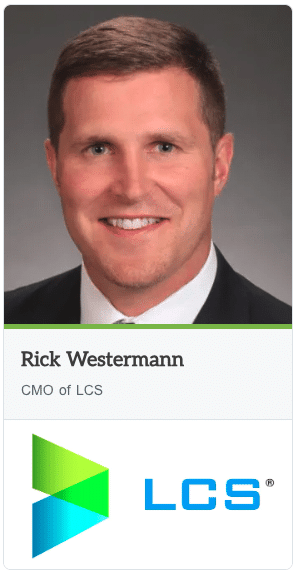
In 2022, LCS built an in-house data science team within marketing, led by Chief Marketing Officer Rick Westermann. The goal was to turn the organization’s data into insights its teams could act on: getting more out of Salesforce, the company’s customer relationship management (CRM) platform, and lightening the administrative load on community sales teams. Adding AI was the natural next step, with support from LCS’s technology and data engineering teams.
“The sales arena was, and continues to be, ripe with opportunity for AI. From better scoring and optimizing who gets contacted to how we create efficiencies and ease of work within our CRM, there is a lot we can continue to build,” said Westermann.
LCS rolled out AI in two phases. The first used machine learning to score leads, identifying which CRM data points matter most and teaching the model what a ‘good’ lead looks like. Trained on the sales activities in historical Salesforce data, the models rank leads by their likelihood of progressing through the funnel. The models weigh factors such as response times, family involvement, and other behavioral indicators so teams can focus where they’ll have the greatest impact.
The lesson applies to any operator: AI models are only as good as the sales activity captured in the CRM, so consistent data capture today lays the groundwork for tomorrow’s tools.
As the program matured and entered its second implementation phase, LCS expanded beyond lead scoring into AI-generated sales summarization. This capability automatically creates concise summaries of prospect interactions, engagement history and pipeline activity, allowing sales professionals to spend less time documenting conversations and more time building relationships.
Rolling out AI across many communities at once meant explaining why AI matters. It also meant acting on team member feedback to build trust in the tools meant to support their expertise, not replace it. LCS credits that community feedback with making AI adoption successful.
To measure the return on its AI investments, LCS uses attribution models to analyze sales results. It found that lead scoring increased conversion rates by 100–150 basis points. For ongoing performance monitoring, LCS also tracks the amount of time a lead spends in the sales funnel.
LCS continues to expand its AI roadmap, with governance policies, AI agents, and more predictive and decision-support tools next up. Nick Hamilton, Vice President, Data & AI, now leads the team as it builds capabilities, advances key enterprise initiatives and partners with LCS operational leaders to unlock greater value from data through conversational AI and advanced analytics.
For operators just beginning to bring AI into sales and marketing, Westermann points back to community-level feedback. “Field-level feedback is a must,” he noted. “Our department has the data science, but we need their expert feedback.”
Key takeaways
As more prospective residents and families research senior living options with AI tools before they ever call, how those tools describe a community matters. Search engines created a first-contact stage in which many operators couldn’t afford to compete for visibility, but structuring content for AEO, as Kimberly recommends, now gives more operators a way to compete in this AI-driven answer era.
The three operators profiled in this article took different paths, yet similar patterns emerge:
- Each operator is turning everyday sales activity into its own prospect intelligence. Every call Teri handles flows into Phoenix’s CRM; LCS’s lead scores are built on its own historical Salesforce data; and Avanti’s custom agent scores leads using logic designed around Avanti’s sales process.
- Sales and marketing proved to be a practical place to apply AI in senior living: lower-risk, measurable, and explainable to teams who need to trust the tools they’re using.
- All three began their sales AI work with a focused use case (AI roleplay training at Phoenix, lead scoring at LCS, and a custom sales agent at Avanti) and expanded from there.
- Leaning on community-level experts was non-negotiable in every case. Rick Westermann credits community feedback with making AI adoption successful; Lori Alford spends time in the field herself; and at Phoenix, feedback from sales staff led the company to add more AI education to its training.
- Scale also matters less than it did in the search era: size shapes which path an operator takes, not whether one is available. For operators still on the sidelines, the advice from all three points in the same direction: choose partners who understand the industry, listen to the teams in the field, and, as Alford put it, “Just start.”
The operators profiled here show that there is no single right model of AI innovation. Whether through an in-house data science team, a trusted vendor partnership, or a tool managed by the CEO herself, each is doing the same essential thing: making every interaction count.
With AI, operators of every size now have the tools to move early and adapt to prospects’ new behavior, and those who start now will set the pace in the years ahead.