Occupancy in Senior Housing Climbs as Half of Primary Markets Top 90%
Experts say demand outpaces construction of new senior housing units.
Occupancy of active adult communities also increases in Q2 2026.
ANNAPOLIS, Md. (July 9, 2026) – Senior housing occupancy neared 90% in the second quarter of 2026, according to analysis by the National Investment Center for Seniors Housing & Care (NIC) of newly released data from NIC MAP. NIC experts say the near-total capacity in U.S. senior housing is a reflection of demand outpacing construction.
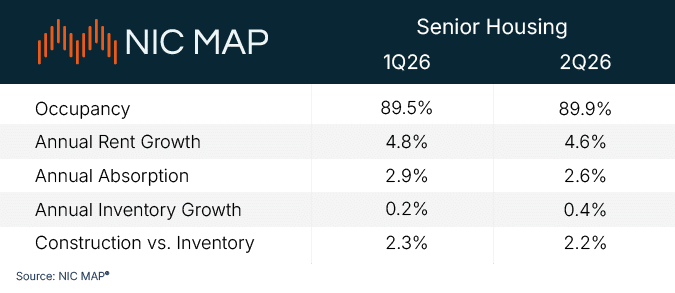
Occupancy hit or exceeded 90% in 15 of 31 primary markets tracked by NIC MAP, with nationwide senior housing occupancy averaging 89.9% in the second quarter. This is a 0.4 percentage point increase from 89.5% in the first quarter of the year, according to NIC, marking the 20th consecutive quarter of increasing occupancy rates.
Boston (93.3%), San Francisco (92.7%), and Baltimore (91.8%) had the highest occupancy rates of the 31 primary markets tracked in the second quarter while Miami (86.2%), Atlanta (86.5%), and San Antonio (87.0%) had the lowest. Although the lowest-ranked markets remain below 90% occupancy, their rates are still increasing. Miami, for example, was 1.7 percentage points above last year’s lowest ranked market (Las Vegas), underscoring continued improvement even among lower-occupancy markets.
The number of occupied senior housing units increased by nearly 3,700 units in the second quarter of 2026—to a total of 639,650—compared to 635,962 in the first quarter of 2026. Year-over-year inventory growth was just 0.4% in the second quarter of 2026. Construction continues to stall, with fewer than 16,000 total units under construction as of the second quarter.
“High occupancy rates and static construction mean fewer new housing options for older adults,” said Lisa McCracken, NIC’s head of research and analytics. “As a result, many operators are considering how to expand services within existing properties, such as wellness programming partnerships or recreational opportunities, to meet the needs of existing and prospective residents.”
Overall senior housing occupancy is expected to surpass 90% by the end of the year, as previously predicted by NIC. More primary markets are also expected to surpass this threshold in the coming months.
“Senior housing developers may look to secondary and tertiary markets, where competition and construction costs may present more favorable conditions to build,” said Arick Morton, CEO of NIC MAP. “These markets have unmet demand and present the industry with an alternative growth opportunity as construction of new properties in primary markets continues to stall.”
Occupancy in active adult communities increases
The occupancy rate for communities expressly catering to active adults climbed 1.4 percentage points in the second quarter of 2026 to reach 92.6%. This increase marks a 0.3 percentage point rise from a year earlier.
Active adult communities are age-restricted, multi-family rental properties that focus on meeting lifestyle preferences, often offering amenities that emphasize wellness and community.
Data show that 1,000 new units were added in the first half of 2026 across 880 active adult rental properties tracked by NIC MAP, totaling nearly 130,000 units across the United States.
“Older adults increasingly want to age in communities that prioritize both their social and physical wellbeing, which is why these properties are attractive for many consumers,” said Caroline Clapp, NIC’s senior principal.
Clapp said these properties are expected to remain popular, especially as individuals in the 65-to-74 age range represent the fastest-growing renter cohort in the country.
Within the 15 largest active adult rental markets, the highest occupancy rates in the second quarter were in Los Angeles (96.2%), Virginia Beach (96.2%), and Buffalo (95.4%). Austin (88.0%) and Phoenix (88.1%) had the lowest occupancy rates but nevertheless saw increases of 1.1 and 3.0 percentage points from last quarter, respectively.
###
An abridged report featuring the newly released data will be available at 4:30 p.m. ET on Thursday, July 9. While the report is a complimentary resource, only NIC MAP clients can access the full underlying data and additional metrics at the metro level through the platform.
A summary of the NIC MAP Market Fundamentals Data, by NIC MAP, is below.
About the National Investment Center for Seniors Housing & Care
The National Investment Center for Seniors Housing & Care (NIC), a 501(c)(3) organization, works to enable access and choice by providing data, analytics, and connections that bring together investors and providers. The organization delivers the most trusted, objective, and timely insights and implications derived from its analytics, which benefit from NIC’s affiliation with NIC MAP, the leading provider of comprehensive market data for senior housing and skilled nursing properties. NIC events, which include the industry’s premiere conferences, provide sector stakeholders with opportunities to convene, network, and drive thought-leadership through high-quality educational programming. For more information, visit NIC’s website and follow NIC on LinkedIn, Facebook, and Instagram.
About NIC MAP
NIC MAP is the senior housing industry’s independent market-data service. We bring together occupancy, rate trends, and the construction pipeline across 35,000+ U.S. properties in a single platform built for senior housing — informing the investment, underwriting, and research decisions of the industry leaders who shape it, including the top senior housing operators, federal agencies, and major capital providers. For more information, visit www.nicmap.com.