CCRC Performance 4Q 2024: Entrance Fee vs. Rental

The following analysis examines broader occupancy trends, year-over-year changes in inventory, and same-store asking rent growth – by care segment – within 571 entrance fee CCRCs and 488 rental CCRCs in the 99 NIC MAP Primary and Secondary Markets.

Entrance Fee CCRCs Lead in Occupancy Rates

Entrance Fee CCRCs Maintained a Higher Occupancy Rate than Rental CCRCs in the Fourth Quarter of 2024. In the 99 NIC MAP Primary and Secondary markets, the occupancy rate for entrance fee CCRCs increased to 91.3%, 3.2 percentage points (pps) higher than rental CCRCs (88.1%) and 5.5pps higher than non-CCRCs (85.8%). In the fourth quarter of 2023, the occupancy rate surpassed 90% and has continued to grow quarter over quarter since.

Rental CCRCs Reported Higher Year-over-year Occupancy Growth than Entrance Fee CCRCs in the Fourth Quarter of 2024. Compared to year-earlier levels, rental CCRC occupancy has increased by 2.1pps while entrance fee CCRCs saw a growth in occupancy rate of 1.1pps.

The occupancy rate of rental CCRCs reached 78.9% in the second quarter of 2021 and has increased for 14 consecutive quarters since, with a cumulative growth of 9.2pps. This increase is more than double the 4.1pps growth seen in entrance fee CCRCs over the same period.

4Q 2024 Market Fundamentals by Care Segment – Entrance Fee CCRCs vs. Rental CCRCs 

The exhibit below compares the market performance of entrance fee CCRCs and rental CCRCs by care segment for the fourth quarter of 2024, highlighting year-over-year changes in occupancy, inventory, and asking rent growth.

Occupancy. Entrance fee CCRCs continued to outpace rental CCRCs in occupancy rate across all care segments. The difference in the fourth quarter of 2024 occupancy rates between entrance fee CCRCs and rental CCRCs was largest in the independent living segment (3.0pps), followed by the nursing care segment (1.1pps), and the assisted living segment (1.0pps), with the smallest gap in the memory care segment (0.8pps).

The highest occupancy in entrance fee CCRCs was seen in the independent living care segment (92.7%), while the memory care segment (89.8%) has the highest occupancy rate in rental CCRCs.

Asking Rent. The monthly average asking rent for entrance fee CCRCs across all care segments remained higher than rental CCRCs. Rental CCRCs showed higher year-over-year rent growth in assisted living (4.9% to $6,179), memory care (5.0% to $7,874), and nursing care (4.6% to $395) segments.

Note, these figures are for asking rates and do not consider any discount that may occur.

Inventory. Compared to year-earlier levels, independent living inventory experienced the largest decline in rental CCRCs (2.5%) and the largest growth in entrance fee CCRCs (0.5%). For rental CCRCs, the memory care segment saw the largest year-over-year inventory growth at 1.4%. This is the only positive year-over-year inventory growth among all care segments.

Negative inventory growth can occur when units/beds are temporarily or permanently taken offline or converted to another care segment, outweighing added inventory.

Look for future articles from NIC to delve into the performance of CCRCs.
Senior Housing 2024 Total Return of 3.6% Outperforms Broader NCREIF Property Index by 3.1 Percentage Points 

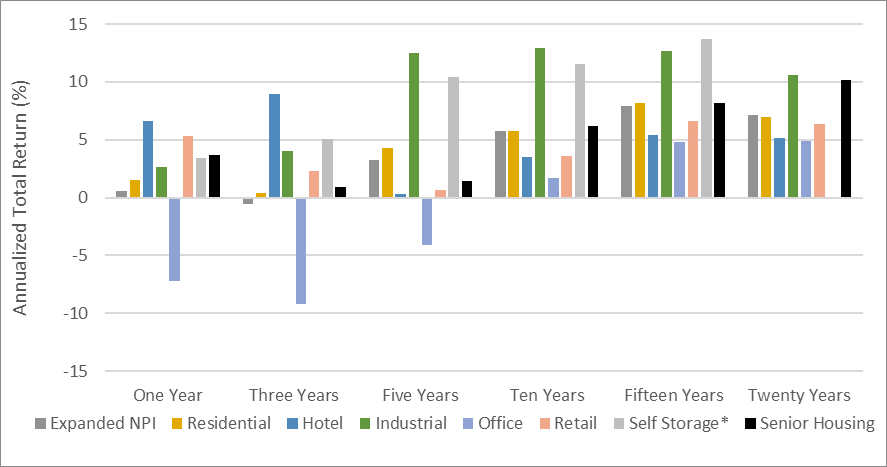
Senior housing posted a positive total return of 2.07% in the fourth quarter of 2024, bringing full year 2024 total returns to 3.64%, the third highest NCREIF property type return for the year after hotel (+6.59%) and retail (+5.33%). Senior housing outperformed the broader Expanded NCREIF Property Index (NPI) in both the quarter and year, which posted a total return of 0.94% and 0.59%, respectively. Senior housing capital appreciation in the fourth quarter turned positive for the first time since mid-2022, increasing 0.77%. The capital appreciation return is the change in value net of any capital expenditures incurred during the quarter. Senior housing income in the fourth quarter was also positive, yielding 1.31%. For the broader NPI in the fourth quarter, property valuations continued to move lower (capital appreciation of -0.24%), partially offsetting the positive income return of 1.17%.  

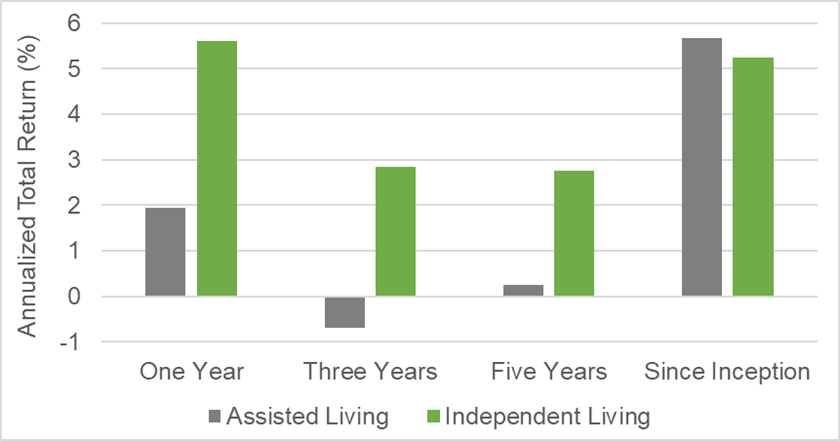
By senior housing property subtype, both independent living (+2.73%) and assisted living (+1.51%) posted positive total returns in the fourth quarter. For the full year 2024, independent living returned 5.60% while assisted living returned 1.95%. In recent years, independent living has also outperformed assisted living over the three- and five-year periods. This outperformance may be driven by higher margins typically generated in lower acuity settings such as independent living, which require less staffing and labor expenses than higher acuity settings such as assisted living. Additionally, independent living has had higher occupancy rates during this period. Over the longer run, since NCREIF began tracking returns data for these subtypes roughly a decade ago, both assisted living and independent living posted similar returns averaging more than 5% annually. 

Annualized Total Returns by NCREIF Property Subtype 
As of 12/31/2024; Unlevered 

Note: Since Inception is 2014 for Assisted Living and 2016 for Independent Living
Source:  NCREIF, 4Q 2024, Unlevered Annualized Total Returns

Compared to other NCREIF property types over the 10-, 15-, and 20-year periods, senior housing was the strongest property type except for industrial and self-storage, outperforming the NPI on an annualized basis by 39, 26, and 302 basis points, respectively. Since the 2003 beginning of NCREIF’s senior housing historical time series, income yield drove roughly 60% of senior housing total returns, while price appreciation contributed roughly 40%. These performance measurements reflect the returns of 225 senior housing properties valued at $11.72 billion in the fourth quarter. Overall, the number of senior housing properties tracked within the NPI has grown significantly from the 56 properties initially tracked in 2003.

Annualized Total Returns by NCREIF Property Type
As of 12/31/2024; Unlevered

* Self Storage does not yet have 20-year historical performance
Source:  NCREIF, 4Q 2024, Unlevered Annualized Total Returns

Senior housing market fundamentals remained positive in 2024, with the occupancy rate for the 31 NIC MAP Primary Markets increasing 0.7 percentage points to 87.2% in the fourth quarter, gaining 2.2 percentage points from a year earlier. By property type in the fourth quarter, there was a 0.7 percentage point increase in the independent living occupancy rate and a 0.6 percentage point increase in the assisted living occupancy rate, and both gained more than 2.0 percentage points in occupancy for the full year 2024.

Occupancy increases were driven by another year of robust demand as 2024 net absorption was roughly in line with 2022 and 2023 levels. Inventory growth in 2024 was slightly higher than 2023 but overall remained low and near levels last seen roughly a decade ago. Looking ahead, given the current supply and demand trends, NIC forecasts that occupancy levels will surpass 90% by the end of 2026, which has only happened a handful of other times since NIC MAP began tracking the data.

Senior Housing Capital Markets 2025 Update

After nearly five years of uncertainty and headwinds in the seniors housing space, capital markets going into 2025 seem to come with the headline “Cautiously Optimistic”.

Over the past 18-24 months, in particular, unprecedented interest rate and cap rate pressure sidelined sponsors and capital providers, leading many in the industry to adopt a “wait-and-see” approach. Additionally, regulatory pressures on federally regulated financial institutions caused permanent financing refinance options to essentially vanish and banks to reduce new loan originations and adopt a more rigid approach to existing loan modifications and maturities, likely requiring additional cash collateral, loan curtailments, recourse, and increased loan pricing. All these factors created additional stress on senior housing assets, regardless of performance and cash-flow at the asset level.

However, as 2025 begins, the tides seem to be turning (albeit, more slowly than desired). The fourth quarter of 2024 saw declining interest rates for the first time in years, and asset values have been rebounding, providing some much-needed marginal relief – and hope – across the industry.

2025 will be interesting on many levels, with particular attention paid to inflation and interest rates. From an interest rate perspective, with the presidential election behind us, and so much policy uncertainty as we enter 2025, it is possible – and even likely – that the Fed will pause rate cuts at the January Federal Open Market Committee (FOMC) meeting, with the expectation there will be fewer cuts than previously thought in 2025. Despite this, interest rate stability is a welcomed change from the rising rate environment we have all been living in. 

With stable interest rates and asset values, coupled with the increasingly strong fundamentals of the industry, capital markets seem to be slowly and selectively reentering the space. From banks who have been able to recognize payoffs and are now able to deploy new loan dollars, to new equity groups and debt funds entering the space (or even reentering after sitting out the past few years), liquidity for new and existing inventory appears to be rising.

With that, an additional consideration is how new and existing inventory will continue to be capitalized throughout 2025. For existing inventory, traditional bank debt is increasingly available for assets with positive leasing momentum that need some additional time, while a rising number of debt funds are showing interest and available capital for assets with a different story wherein recapitalization or repositioning is needed. On the other side of the coin, new inventory is a rarity as annual inventory growth has been declining since 2019, and currently sits at approximately 1% as of 3Q24 NIC Map Data. However, for sponsors with patient and recurrent equity, along with efficiencies of development, banks are interested and willing to extend new loan dollars after experiencing payoffs throughout the latter half of 2024.

Regardless of what is to come in 2025, the ability to rely on patient and flexible partnerships between sponsors and capital providers continues to be a vital resource.

Progress Toward Value-Based Care in 2025  

As we look ahead in 2025, the senior living industry is poised for significant transformation, with value-based care (VBC) at the forefront of this evolution. The Centers for Medicare & Medicaid Services (CMS) has set an ambitious goal to have all Medicare beneficiaries in some form of value-based care arrangement by 2030, and the industry is making strides toward this objective.  

The transition to value-based care has been gaining momentum, particularly within the Medicare population. In 2024, KFF reported that 54% of eligible Medicare beneficiaries were enrolled in a Medicare Advantage (MA) plan as opposed to the traditional fee-for-service plan. Enrollment in MA plans has been rising steadily each year and CMS projects increased enrollment numbers again in 2025. As an alternative, several operators have entered into risk-bearing arrangements where they either own their own plan or participate in a joint venture with an existing payer. We anticipate continued growth in these provider-led plans in 2025 as operators aim to have greater control over reimbursement and quality decisions for those they care for.  

Growing Revenue Streams 

The recently announced CMS GUIDE Model (Guiding an Improved Dementia Experience)  presents a promising opportunity for senior living operators to participate in value-based care while generating additional revenue. GUIDE is not a shared savings or capitated model but is a condition-specific care model designed to be compatible with other models and programs like ACOs that aim to provide opportunities to improve care and reduce overall healthcare spend. Specifically, this model aims to help older adults with dementia stay healthy at home longer and introduces a new payment structure for participating providers. 

Key aspects of the GUIDE model include: 

  • Reimbursement for care assessments 
  • Compensation for care planning 
  • Payments for educating caregivers 

Many senior living operators are already performing these tasks, making the GUIDE model a natural fit for their existing operations. As the CMS Innovation Center continues to explore alternative payment models, it is anticipated that there may be additional opportunities for senior living organizations to be reimbursed for value provided.  

Enhancing Data Sophistication 

As an industry, we need to become more sophisticated in our data tracking, reporting, and implementation. This is an imperative for the industry and something that is absolutely critical in making progress towards not only value-based care arrangements, but in improving outcomes and communicating the evidence of value provided. The adoption of platforms that enable operators to accurately track key metrics on residents, to access information in real-time, and to support proactive interventions are paramount. We are optimistic that the sector will continue to improve in its data collection and reporting efforts in 2025 and will move toward greater standardization of key performance metrics.     

As we enter the new year, the senior living industry is at a critical juncture in its journey toward value-based care. While progress has been made, there is still considerable work to do. The transition to value-based care represents not just a change in payment models, but a fundamental shift in how we approach senior care. By focusing on outcomes rather than services rendered, the industry has the potential to significantly improve the quality of life for seniors while also enhancing operational efficiency and financial sustainability. With innovative models like GUIDE and increasing awareness of value-based care benefits, we can expect more senior living operators to explore and adopt value-based care arrangements in the coming year. 

From Recovery to Sustainable Growth: The Next Chapter of Senior Housing 

As the senior housing market emerges from a three-year pandemic-induced occupancy recovery, it finds itself at a critical juncture. Strengthening demand and occupancy rates steadily approaching 90% signal a powerful opportunity for growth, driven by the natural alignment between the industry’s mission and the needs of an aging population. 

While labor pressures continue and operational expenses remain elevated, the senior housing market fundamentals in 2025 will be strong, robust demand is expected to drive continued strong momentum in the absorption-to-inventory velocity (AIV) ratio over the next two years. As detailed in the spring 2024 SHARK report, this trend could set new occupancy records, with most regions projected to achieve occupancy rates in the 90% range by 2026.  

Simultaneously, rent growth has proven to be a double-edged sword. While rising rents have supported operating margins amid higher expenses, affordability challenges for middle-income older adults persist. Luxury senior housing properties may have successfully justified premium rents with high-end amenities and services, but mid-tier and lower-tier operators will likely need to balance pricing and discount strategies with occupancy to remain competitive. 

In recent years, the pace of new senior housing construction has slowed, driven by rising material costs, labor shortages, and economic uncertainty. This tempered supply growth has created opportunities for existing properties to capture demand as the market stabilizes. We expect this trend to continue through much of the year ahead.  

Yet, the industry faces a supply shortfall exacerbated by aging stocks and prolonged construction timelines. This will likely fuel a trend toward repurposing older buildings and increasing capital expenditures to enhance efficiency, competitiveness, and appeal to future residents. 

Investment and lending dynamics are also changing. Investors and lenders are seeking stable, long-term returns while assessing the risk profiles of new developments and repositioning older assets. Senior housing properties that can demonstrate strong lease-up performance, operational efficiency, and adaptability to market conditions will be better positioned to attract capital. 

Finally, one of the most critical lessons from recent years is the importance of clearly articulating the value proposition of senior housing. Today’s seniors and their families expect more than a place to live, they seek a property where they can thrive physically, emotionally, and socially.  Achieving this potential requires balancing affordability with quality while transitioning from the traditional one-size-fits-all model to more personalized offerings that cater to the diverse needs and preferences of the baby boomer generation – one of the largest and most diverse cohorts.  

The senior housing market is entering 2025 with both challenges and opportunities. The coming years will test the industry’s continued resilience and innovation as it strives to deliver on its mission and achieve sustainable growth. 

The future of senior housing is bright. Is the sector ready to transform today’s challenges into tomorrow’s opportunities?