conference table with students at senior housing classes

Is a Senior Housing Professional Certification Worth the Investment?

Senior housing has become one of the fastest-growing sectors in commercial real estate. Demand is accelerating, occupancy is climbing, construction remains constrained, and capital is flowing into the sector.

That growth is creating opportunity—but it has also exposed a skills gap. Senior housing isn’t simply another real estate asset class. Success requires understanding the intersection of real estate, healthcare, operations, finance, and demographics, knowledge that most professionals were never formally taught.

Whether you’re expanding into senior housing from commercial real estate, healthcare, lending, or investment management or just want to improve your skills and credibility for your company and your career growth, the question isn’t just whether the market is attractive. It’s whether you can quickly build the expertise needed to participate confidently.  

So how do you actually build the expertise to work in this space?

For many, the answer is structured education. While market data, conferences, and industry publications provide valuable insights, they rarely offer the structured, comprehensive understanding needed to evaluate opportunities and make informed decisions across the sector.

That’s where professional certification can help. Whether a senior housing certification is worth the time and investment depends on your goals—and on whether the program teaches the specialized knowledge your role requires. NIC Academy’s Certified Senior Housing Investment Professional (CSHIP) certificate program is the only industry certification designed specifically to build expertise across the senior housing and care sector. The sections below explain what the program covers, who benefits most, and how to determine whether it’s the right investment for your career.

Why Senior Housing Is Harder to Underwrite Than It Looks

Senior housing combines two businesses that most investors learn separately: real estate and operations. The real estate side follows familiar patterns of rent, occupancy, and cap rates. But the operating business underneath determines whether those patterns hold.

  • Occupancy does not behave like apartment occupancy. Absorption runs slower and is shaped by care needs, not just price.
  • Pricing depends on care level, payer mix, and local competition, not just square footage and amenities.
  • NOI margins move with labor costs and regulatory changes as much as with rent growth.

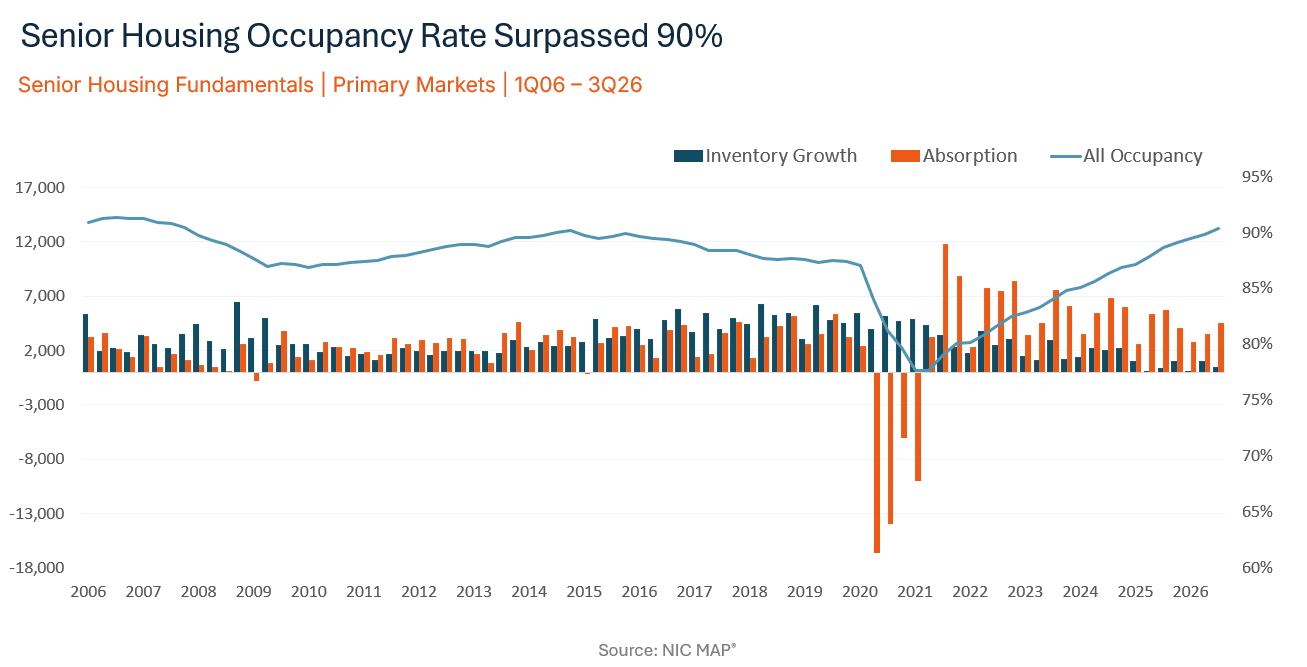
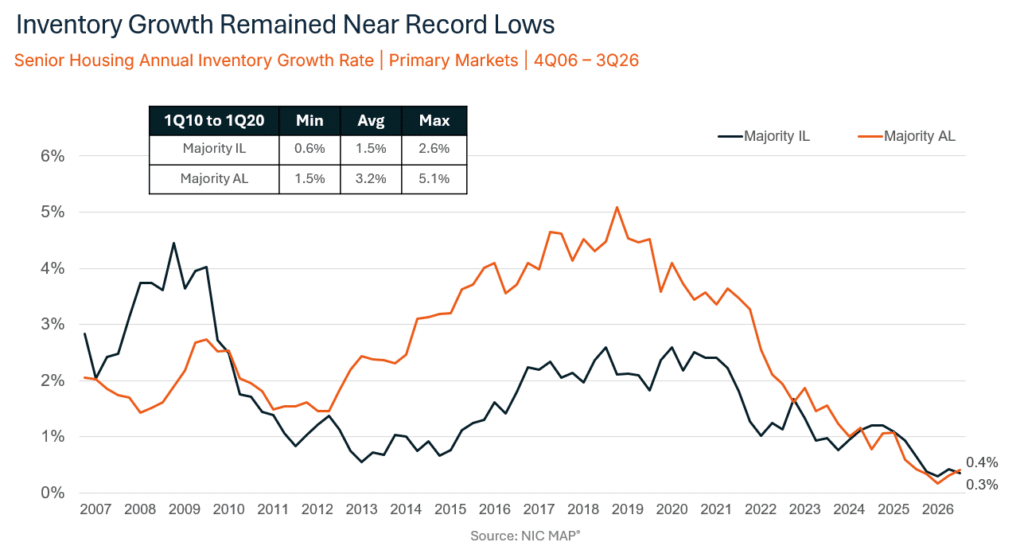
The current market shows how much this matters. According to the National Investment Center for Seniors Housing & Care (NIC), the parent company of NIC Academy and the most trusted resource of objective and timely industry insights and convener of leading decision-makers, senior housing occupancy reached 89.5% in the first quarter of 2026, the 19th straight quarter of growth. At the same time, new construction starts fell to their lowest level since 2012, and year-over-year inventory growth slowed to just 0.4%. 

That combination, rising demand against almost no new supply, is precisely the kind of dynamic a general CRE background does not prepare someone to read. It takes sector-specific training to know what these numbers mean for underwriting and where the next opportunity is likely to show up.

Why Can’t I Just Learn This on My Own?

Information about senior housing is not hard to find. NIC publishes data every quarter. Conferences cover underwriting and operations. Trade press tracks deals in real time. The real challenge is not access. It is the organization and trusted real-world lessons from seasoned industry experts.

Self-directed learning tends to deepen knowledge only where a professional already has exposure. That leaves gaps exactly where someone has not yet been tested.

  • An investor who has closed a few deals may understand acquisition mechanics but miss operational risk.
  • A lender who has financed senior housing may understand credit structure but not why occupancy varies between similar assets in the same market.
  • An operator may understand resident care but not how a deal gets underwritten or financed.

There is also simply more to track than there used to be. Knowing what data exists is one skill. Knowing how to use it while underwriting a live deal is another. That second skill is what a structured program is built to teach.

real estate agent at desk speaking with clients

Who is CSHIP Built For?

CSHIP is not an introductory overview of the industry. It is a professional credential for people working in capital markets, investment, operations, or advisory roles who need real depth in a sector where they may not have formal training.

  • CRE investors, brokers, and lenders expanding into senior housing
  • Capital markets professionals evaluating allocation decisions
  • Care executives and operators who want a stronger grasp of the investment side
  • Consultants and advisors who need a shared framework with their capital and operating partners
  • Professionals early in their careers who want a credential that signals real sector commitment

The program is built for working professionals. Coursework is designed to fit around existing schedules rather than compete with them.

See what’s actually in the curriculum

CSHIP Level I and Level II break down exactly what’s covered, who each level is built for, and how the coursework maps to real underwriting and deal work.

What the Program Actually Covers

CSHIP was built by NIC Academy for professionals who need a complete view of the sector, not just one piece of it. The curriculum includes:

  • Senior housing market fundamentals and demographic demand drivers
  • Investment analysis and underwriting frameworks
  • Capital structures and debt financing
  • Operations and NOI dynamics
  • NIC MAP data interpretation

NIC’s affiliation with NIC MAP, the primary source of senior housing performance data runs through the whole program. Participants are not reading secondhand summaries of NIC MAP data. They are learning to work directly with the same data that the institutions deploying capital in this sector already rely on.

What Is the Actual Return on Certification?

The value is not mainly the credential line on a resume, though that helps. The bigger return is faster, better-informed decision-making once you have a complete framework for the sector, rather than a patchwork of knowledge.

Senior housing has become a real institutional asset class, and the performance backs that up. According to NIC’s reported market data, senior housing posted a 3.9% total return in the first quarter of 2026, its strongest quarterly performance since late 2017, and outperformed the broader NCREIF Property Index’s 1.2% return over the same period.

As more capital moves toward an outperforming asset class, the operators, lenders, brokers, and advisors working in it need to match that level of sophistication. Professionals who complete CSHIP typically report three concrete gains:

  • More confidence in holding sector-specific conversations with capital partners
  • A sharper eye for gaps in deal logic or underwriting assumptions
  • A wider professional network built on a shared analytical framework

That last point matters more than it sounds. When a lender and an operator speak the same analytical language, deals move faster and with fewer surprises.

Is Certification the Right Move for You Right Now?

The strongest candidates are professionals already working near senior housing who want to formalize their expertise, people transitioning from another CRE sector or healthcare, and anyone who has already identified a specific gap in their knowledge. A few honest questions help clarify these issues:

  • What decisions do I make regularly that would benefit from stronger sector knowledge?
  • Which parts of senior housing do I currently rely on someone else to explain to me?
  • Would a structured program get me there faster than continuing to learn on the job?

If you can answer those with specifics, certification will likely pay off faster than continuing to piece things together informally. 

Why the Timing Matters Right Now

The oldest Baby Boomers turn 80 in 2026. According to PwC and the Urban Land Institute, the population age 75 and older is expected to grow by more than 4 million by 2030, and the number of adults 75 and older living alone is projected to more than double by 2040. That kind of demand will need capital, operators, and advisors who understand the sector with real precision.

NIC research indicates senior housing occupancy is on track to surpass 90% before the end of 2026, which would mark the highest level recorded since NIC MAP began tracking the data. Construction starts remain at some of their lowest levels in over a decade. Capital is entering the sector at a moment when fundamentals are strong, and supply is unlikely to catch up soon. Professionals who build real expertise now are entering at the right point in the cycle.

CSHIP gives professionals a direct path to that expertise. The frameworks taught in the program are not borrowed from another asset class. They are the ones the industry itself uses.

Ready to take the next step?

If the case for structured expertise in this article matches how you’re already thinking about your role in senior housing, the next step is simple: look at the program details and enroll when you’re ready.

Table showing diagram of real estate with miniatures

The Specialist Advantage in Real Estate Capital Markets

Why sector depth outperforms generalist coverage in senior housing investment, underwriting, and capital formation.

Commercial real estate has always rewarded investors and operators who understand their sector better than competitors. In today’s capital markets, that advantage comes less from broad exposure across asset classes and more from deep operational and real estate capital markets expertise within a specific property type.

But for years, institutional real estate investment strategies centered on diversification across office, multifamily, industrial, and retail. Spreading capital across multiple sectors helped reduce concentration risk and gave firms flexibility across market cycles.

That approach still exists, but the market has shifted. Institutional capital is more specialized than it was a decade ago. Underwriting standards have grown more sophisticated. Information access, once a durable edge, is now widely distributed. The firms outperforming in sourcing, underwriting, and capital formation are increasingly those with deep sector expertise. This dynamic is particularly pronounced in senior housing right now, as strong returns and demographic tailwinds have drawn a significant wave of new capital into the sector from investors with limited prior exposure to its operational complexity.

Whether evaluating an acquisition, negotiating debt, raising equity, or structuring a deal, sector fluency shapes how credible a participant appears in the room. Lenders, operators, and institutional partners assess not just the asset but the expertise behind it. In senior housing, where operational and financial performance are tightly linked, surface-level familiarity creates real underwriting risk.

Why Senior Housing Requires Different Underwriting Assumptions

Traditional commercial real estate underwriting follows a consistent structure. Revenue assumptions are built on occupancy and rent growth. Expense growth is projected forward. Stabilized NOI is capitalized to estimate value. Sensitivity analyses test downside scenarios.

That framework works well for many property types. Senior housing is different. Unlike traditional multifamily, financial performance depends as much on operations as on real estate fundamentals. Care levels, staffing ratios, resident turnover, labor market conditions, service mix, and operator execution all directly affect NOI. Labor alone accounts for approximately 55% of total operating costs in senior housing, compared with roughly 10-15% in conventional multifamily. That difference in cost structure produces a fundamentally different underwriting environment.

A model built on standard CRE assumptions can appear technically sound and still miss the variables that actually determine performance.

Why Does Specialization Matter in Capital Markets?

Sector expertise becomes most consequential when capital enters the transaction. Senior housing lenders regularly assess factors that go beyond typical property metrics, including:

  • Local labor availability and market depth
  • Area demographics and demand trajectory
  • Operator track record and occupancy stabilization pace
  • State regulatory requirements by care category

Sponsors who speak to those variables with precision carry a measurable advantage in debt negotiations, equity raises, and joint venture discussions.

The same holds in institutional equity relationships. Partners allocating capital to senior housing want confidence that their co-investors understand the sector at a working level. That means resident demand trends, operating margin dynamics, and development feasibility, not just cap rates and lease comparables.

Go Deeper on the Numbers

The NIC Investment Guide breaks down underwriting benchmarks, financing terms, and capital markets data across the full senior housing spectrum.

Where Specialization Creates the Most Durable Advantage

Not every asset class rewards specialization at the same rate. In highly efficient sectors such as core multifamily or Class A industrial, investors find abundant market data and standardized underwriting conventions. Advantages still exist, but information asymmetry is narrow.

The strongest advantages tend to concentrate in sectors with three features:

  • Operational complexity that standard CRE underwriting frameworks undervalue
  • Thinner market data coverage, creating meaningful gaps between well-informed specialists and generalists
  • Long-duration structural demand drivers, reducing reliance on cyclical assumptions

Senior housing fits all three.

Strong Fundamentals Increase the Value of Specialization 

Senior housing’s long-term outlook is supported by both demographic demand and constrained supply. By Q4 2026, more than 14.9 million Americans will be aged 80 or older—a figure projected to grow to approximately 25 million by 2040. (Freddie Mac, 2023) Because this population drives demand for assisted living and higher-acuity care settings, the sector’s growth is rooted in long-term demographic trends rather than short-term economic cycles. .At the same time, senior housing supply has not kept pace with that demand

In Q1 2026, senior housing occupancy reached 89.5%, the highest reading since before the pandemic and the nineteenth consecutive quarter of improvements. Units under construction fell to their lowest levels since 2012 (NIC, April 2026). 

Where Specialists Have a Specific Edge in Underwriting

Those supply-and-demand dynamics do not automatically translate into investment returns. Execution still matters, and execution in senior housing is operationally specific. Specialists enter transactions with a more reliable read on several variables that generalists frequently underestimate:

  • Lease-up assumptions require market-specific absorption data, not multifamily benchmarks. Referral dynamics, competitive set positioning, and care level mix all affect stabilization pace.
  • Staffing cost models need local labor market inputs. Agency labor dependency, turnover rates, and staffing ratios vary significantly by geography and care level and directly affect NOI.
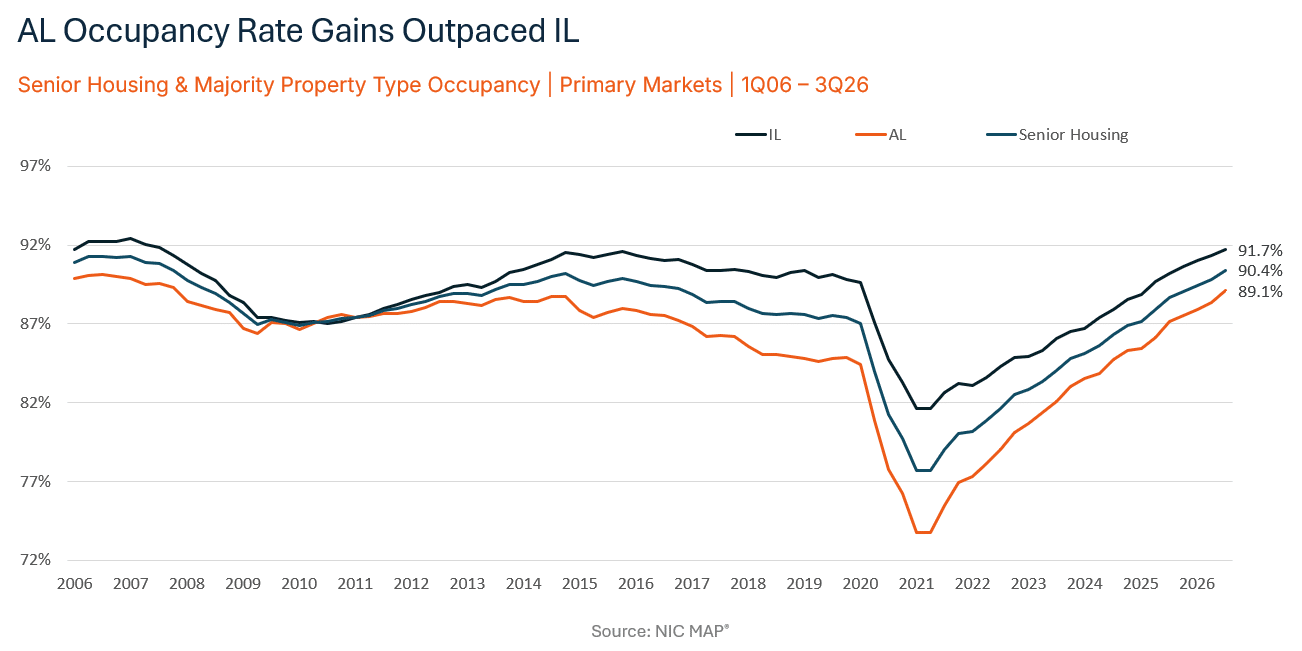
  • Occupancy analysis should be done by segment, not in aggregate. Independent living crossed 91% occupancy in Q1 2026; assisted living stood at 87.9%. The gap between segments has direct implications for underwriting assumptions and valuation. (NIC, April 2026)
  • Cap rate selection must account for operational risk alongside real estate fundamentals. Rates appropriate for stabilized independent living communities are not appropriate for value-add assisted living acquisitions, even in the same submarket.

Firms that consistently perform well in senior housing do not apply generic CRE frameworks. They bring sector-specific knowledge developed through direct experience, access to proprietary data, and structured professional education.

How to Build Real Sector Expertise

Sector fluency does not come solely from market reports or conference attendance. It develops through sustained exposure to the sector’s data, operating structures, capital markets conventions, and underwriting frameworks across multiple cycles.

For senior housing specifically, that means building working knowledge across several areas:

  • Demand drivers and demographic trends at the submarket level, not just national projections
  • Occupancy and absorption patterns by care level and geography
  • Operator performance benchmarks and how they translate to NOI under different scenarios
  • Staffing structures, labor cost dynamics, and their effect on operating margins
  • Regulatory requirements by state and care category
  • Development feasibility, construction cost inputs, and stabilization timelines
  • Capital markets conventions for healthcare real estate, including REIT, institutional equity, and private credit underwriting standards

Where Specialization Creates the Most Durable Advantage

Not every asset class rewards specialization at the same rate. In highly efficient sectors such as core multifamily or Class A industrial, investors find abundant market data and standardized underwriting conventions. Advantages still exist, but information asymmetry is narrow.

The strongest advantages tend to concentrate in sectors with three features:

  • Operational complexity that standard CRE underwriting frameworks undervalue
  • Thinner market data coverage, creating meaningful gaps between well-informed specialists and generalists
  • Long-duration structural demand drivers, reducing reliance on cyclical assumptions

Senior housing fits all three.

Strong Fundamentals Increase the Value of Specialization 

Senior housing’s long-term outlook is supported by both demographic demand and constrained supply. By Q4 2026, more than 14.9 million Americans will be aged 80 or older—a figure projected to grow to approximately 25 million by 2040. (Freddie Mac, 2023) Because this population drives demand for assisted living and higher-acuity care settings, the sector’s growth is rooted in long-term demographic trends rather than short-term economic cycles. .At the same time, senior housing supply has not kept pace with that demand

In Q1 2026, senior housing occupancy reached 89.5%, the highest reading since before the pandemic and the nineteenth consecutive quarter of improvements. Units under construction fell to their lowest levels since 2012 (NIC, April 2026). 

Where Specialists Have a Specific Edge in Underwriting

Those supply-and-demand dynamics do not automatically translate into investment returns. Execution still matters, and execution in senior housing is operationally specific. Specialists enter transactions with a more reliable read on several variables that generalists frequently underestimate:

Alongside technical knowledge, practitioners need to communicate sector dynamics clearly to lenders, investment committees, operating partners, and board-level stakeholders. Translating operational complexity into capital-markets language is a skill most generalist CRE professionals lack and cannot typically acquire quickly.

For practitioners who want to build this underwriting fluency systematically

NIC Academy’s Capital Markets course, part of the CSHIP curriculum, covers the financing structures, lender criteria, and transaction mechanics specific to the sector.

The Long-Term Value of Specialization

As senior housing attracts more institutional capital, sector expertise is becoming a stronger competitive advantage. Lenders, investors, developers, and operators who understand senior housing underwriting, operating performance, and capital markets can evaluate risk more accurately, make better decisions, and communicate more credibly with partners.

Broad commercial real estate experience creates opportunities. Sector expertise determines what happens once inside.

NIC Academy’s Certified Senior Housing Investment Professional (CSHIP) certificate program helps professionals build that expertise through structured education focused specifically on the senior housing and care sector.

NIC Senior Housing Affordability Calculator: A New Time-Based Affordability Measure

The NIC Senior Housing Affordability Calculator is designed to expand how affordability is evaluated in senior housing, with an initial focus on the assisted living care segment. The calculator introduces a time-based approach to assess how long older adult households can sustain assisted living rent—defined as asking private-room rent plus care service fees—under defined assumptions.

Building on insights from NIC’s recent assisted living penetration research, this new measure complements traditional affordability metrics by adding a financial durability lens. It is intended to help operators, investors, lenders, researchers, and policy stakeholders better understand the sustainability of private-pay assisted living across markets.

To learn more, explore the Senior Housing Affordability Calculator, as well as the supporting methodology and glossary.

How Affordability is Evaluated in Assisted Living

Most assisted living affordability conversations start with a simple question: can a household afford today’s rent? It is a reasonable place to begin, but it is not where the story ends.

For assisted living providers, affordability is often framed as a threshold. How many households fall within a certain income band? What share of income goes toward housing and care? These measures are useful, but they only capture part of the picture.

Assisted living affordability measures need to include a time-based perspective. According to the ASHA/ProMatura Senior Housing Consumer Sentiment Report, cost concerns are the most cited barrier to consumer decisions to move into assisted living, often expressed through uncertainty around future expenses and the ability to sustain housing and care costs over time. Many prospective residents are evaluating how long their financial resources will last and whether rising costs could affect long-term financial security.

How Households Actually Finance Assisted Living Housing and Care

Assisted living does not operate like traditional rental housing, and older adults do not finance housing and care in the same way as younger households. While some residents rely primarily on income, many draw from a combination of sources, including but not limited to fixed income, accumulated savings, adult children’s contributions, and often home equity that is converted into spendable resources over time. In some cases, outstanding mortgages or other obligations reduce the amount of home equity available, meaning proceeds from a home sale do not always translate fully into usable funds.

As a result, affordability unfolds over time. This becomes clearer when looking at households that appear similar on paper. Two households with comparable incomes may face different outcomes depending on their overall net worth. One may be able to sustain assisted living rent for a decade or more, while another may begin to experience financial pressure after only a few years. Their incomes may look similar, but their financial capacity to support assisted living housing and care over time can differ significantly.

What Penetration Tells Us about Affordability

This perspective became more apparent in NIC’s recent research on assisted living penetration, where we examined why penetration rates differ across markets. A long-held industry assumption is that markets with stronger income levels among older adults aged 75+ would consistently translate into higher penetration rates. That pattern did not hold.

Markets with similar socioeconomic profiles often showed different penetration rates. The variation was shaped by a broader set of factors, including awareness, cultural norms, workforce conditions, and policy environments. Affordability was part of that story, but not in a straightforward way.

The analysis suggests that affordability is often shaped by a combination of financial reality and perception. In some cases, households have the resources to support assisted living through a mix of income, savings, and home equity, yet lack confidence in their ability to sustain expenses over time. Factors such as limited financial planning, lack of visibility into assisted living price ranges, and concern about future costs can weigh heavily on decision-making.

For a more detailed discussion, see the “Affordability Can be a Mix of Perception and Reality” section (pp. 13–15) in the penetration research report.

A Time-Based Approach to Affordability

To quantify this dynamic, NIC developed a time-based approach to affordability. Instead of focusing only on whether rent fits within income in a given year, this measure evaluates how long a household can sustain rent expenses under a set of assumptions. It brings together income, assets, rent levels, and growth rates, and projects forward year by year. The result is a timeline, a measure of how long housing and care remains financially viable.

Viewing affordability through this lens shifts the conversation. Assisted living is often part of a broader care journey that may include transitions to higher levels of care, such as memory care or skilled nursing, each with additional cost considerations. For many households, these future needs are part of the financial calculus.

Affordability unfolds over multiple years. Rent typically increases over time, while income tends to grow more gradually. When a gap emerges, it is often funded through assets, which may decline over time. The pace of that decline matters. Even modest differences in rent levels or growth rates can notably extend or shorten the duration over which assisted living remains financially sustainable. For that reason, time-based affordability is inherently sensitive to underlying assumptions.

The exhibit below illustrates an example of time-based affordability across geographic markets (based on the 99 NIC MAP Primary and Secondary Markets). Using assisted living average monthly rent, along with median income and net worth for households aged 75+, plus assumptions around income allocation, investment yield, net worth liquidation costs, and growth rates, the model estimates how long a typical household can sustain assisted living market rents.

Across the 99 markets, the median affordability duration is approximately eight years and four months as of 2025. This indicates that, under baseline assumptions, a representative household can sustain assisted living costs for more than eight years.

However, the variation across markets is notable and reflects regional differences in income, wealth, and pricing. Markets in the Northeast, Mid-Atlantic, and Midwest generally fall within a range of five to eleven years, while many Sunbelt markets show relatively longer affordability durations, between eight and fourteen years. In some markets, affordability extends well beyond a decade, while others show relatively shorter timelines.

Across all 99 markets, New York, NY has the lowest estimated affordability duration at about four years and seven months, while Ogden, UT has the highest at approximately nineteen years and eight months.

NIC’s Senior Housing Affordability Calculator allows users to explore these dynamics further by adjusting key inputs and assumptions to see how affordability changes across different scenarios.

Conclusion

Expanding middle market access to senior housing depends both on increasing the number of households that can afford rents and on how long those households can realistically remain.

In some markets, there are units priced within reach of median-income households, even before considering assets. Yet those units remain unoccupied. That points to a different kind of constraint, one tied to confidence, planning, expectations, and how pricing is communicated.

Improving access and addressing the supply challenge also involves reducing uncertainty. Greater transparency around pricing ranges, clearer expectations around long-term costs, and earlier financial planning can all support more informed decision making. When households better understand what affordability looks like over time, decisions become more timely and more deliberate.

Affordability in assisted living reflects both the ability to enter and the ability to remain (Affordability = Entry + Duration). Incorporating a time-based perspective helps connect those dimensions and provides a more complete view of how assisted living housing and care decisions are made, financed, and experienced over time.

For questions or feedback on the NIC Senior Housing Affordability Calculator tool and methodology, please contact analytics@nic.org.

Investors at table discussing senior housing market analysis

Senior Housing Market Analysis: What to Look for Before Committing

Deploying capital into senior housing requires a meaningful shift from traditional commercial real estate underwriting. An office or retail asset largely depends on macro-level employment or broad consumer spending trends. A senior housing investment spans real estate, hospitality, and need-based care. It is a hyper-localized, operationally intensive alternative asset class where submarket conditions dictate performance.

With the first Baby Boomers turning 80 in 2026, the structural demand case has rarely been clearer. At the same time, inventory growth has fallen below 1% for four consecutive quarters, the lowest level since NIC MAP began tracking supply data in 2006. For capital providers, compressed supply against accelerating demographic demand makes disciplined market analysis more consequential than ever.

What Is Senior Housing Market Analysis?

Senior housing market analysis is the process of evaluating a target submarket across four data-driven lenses: occupancy trends, the supply pipeline, demographic demand drivers, and competitive positioning. This is used to determine whether a specific asset or development site can support the returns a deal requires. Grounding this analysis in submarket-level data rather than broad metropolitan averages is what separates disciplined underwriting from costly approximation.

Occupancy Trends: Moving Beyond MSA Averages

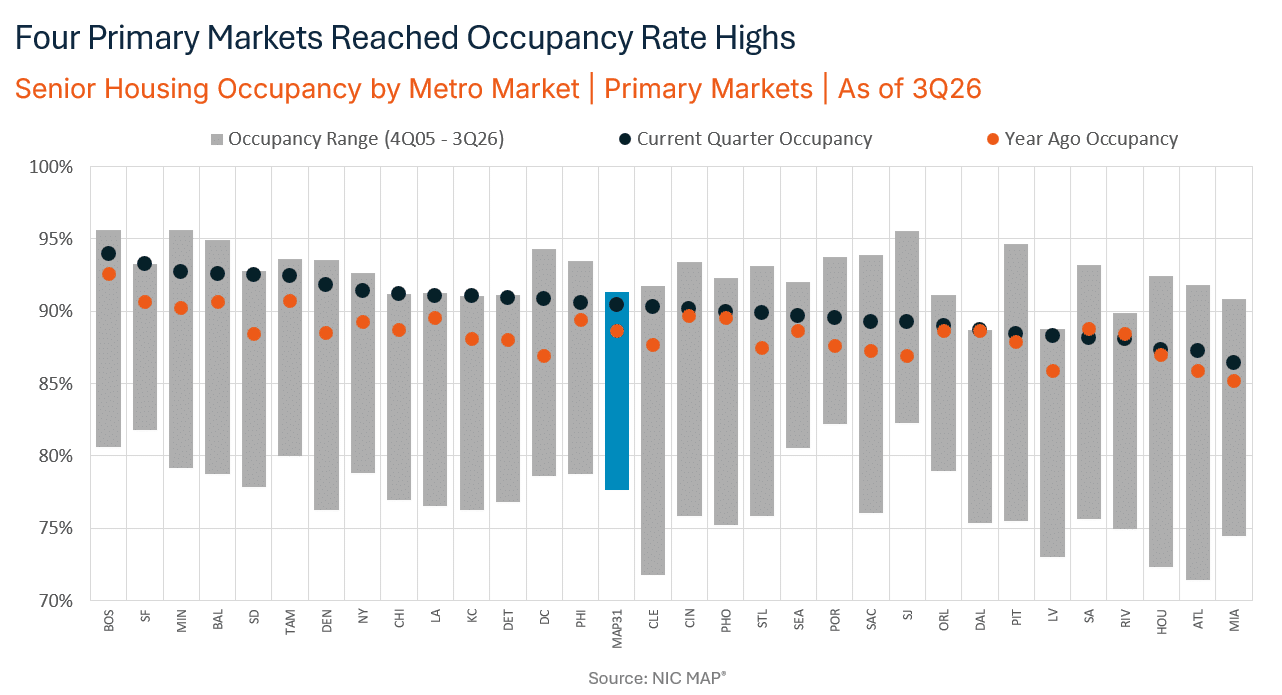
Occupancy is the primary indicator of a market’s current stability and pricing power. Looking solely at a Metropolitan Statistical Area (MSA) average can obscure important submarket realities. A high MSA occupancy rate can easily mask severe oversupply or declining demand within a specific five- or ten-mile radius of the subject property.

Nationally, senior housing occupancy reached 89.4% in Q1 2026, the 19th consecutive quarter of improvement, with independent living at 90.3% and assisted living at 88.2%. Those headline figures say nothing about performance in any specific market. When evaluating occupancy, break the data down along two vectors:

Care Segment Stratification

Independent living (IL), assisted living (AL), memory care (MC), and active adult rental segments operate on different demand curves and lease-up velocities. Independent living is consumer-choice and lifestyle-oriented; assisted living and memory care are needs-based, typically producing shorter length-of-stay profiles but faster re-leasing. Underwriting must isolate the occupancy benchmarks of the specific care segment being evaluated.

The Trajectory of Stabilization

Evaluate annualized absorption versus inventory growth over a rolling multi-quarter period. Is occupancy rising because net absorption is consistently outpacing new supply — the signal of genuine, durable demand — or is it temporarily inflated by a pause in construction that will reverse once new cycles begin? A market showing 200 to 300 basis points of occupancy recovery over six or more quarters, driven by absorption rather than inventory contraction, provides a credible foundation for pro forma assumptions. Verified, historical time-series data across primary and secondary markets gives you the baseline needed to make that distinction.

The Supply Pipeline: Quantifying Future Disruption

In senior housing, unmitigated supply is historically the most pronounced disruptor of asset performance and localized pricing power. A market that looks highly attractive today can face severe margin compression if a wave of new inventory delivers simultaneously.

New units under construction fell to their lowest level since 2012, and year-over-year inventory growth hit a record low of 0.4% in Q1 2026, suggesting new supply is unlikely to accelerate in the near term. That constrained pipeline is a tailwind for existing asset performance today, but it also signals an upcoming imbalance: NIC MAP data projects a need for approximately 806,000 additional senior housing units by 2030, just to maintain current market penetration rates.

Evaluating the supply pipeline requires tracking local construction cycles across three phases:

  • Proposed/In Planning: Projects moving through zoning, architectural review, or initial financing. This metric helps project long-term capacity constraints three to five years out.
  • Under Construction: Units that have broken ground. These represent incoming competition over a 12- to 24-month horizon. Low levels in many markets are a short-term occupancy tailwind, but that advantage narrows once new cycles begin.
  • Recent Deliveries (Lease-Up Phase): Newly opened properties currently discounting rents or offering concessions to build occupancy. Their lease-up trajectory reveals the true competitive pressure on existing assets.

A thorough market analysis compares construction-to-inventory ratios across specific micro-markets. If the volume of units under construction exceeds a submarket’s historical net absorption capacity, the subject asset will face prolonged lease-up timelines and escalating customer acquisition costs. Tracking the pipeline also reveals where older properties face functional obsolescence, creating acquisition opportunities for well-capitalized, modern inventory.

Demographic Demand Drivers: Verifying the Local Qualified Pool

Senior housing demand is inherently localized. The vast majority of residents move into a community from within a 5- to 10-mile radius or are relocated by adult children living within that same boundary. Demand modeling must be precision-targeted to the specific geography.

Macro demographics have rarely been so clear. According to the NIC Investment Guide, the 80+ and 85+ populations are expected to grow at average annual rates of approximately 4.7% and 3.8%, respectively, between 2025 and 2030. Macro tailwinds, though, do not substitute for submarket verification. A thorough demographic analysis requires tracking two components:

  • Age-Qualified Population Growth: The primary target demographic for assisted living and memory care is the population aged 80 and older. Verify that this growth concentrates within the asset’s specific catchment area, not across the broader MSA in ways that benefit competing submarkets.
  • Income and Wealth Qualification: Private-pay senior housing requires a deep pool of qualified consumers. Underwriting models must account for household income levels in the 75+ and 80+ cohorts, paired with local home equity values. Because many incoming residents fund their stay with proceeds from a primary home sale, median home values in surrounding zip codes serve as a leading indicator of local affordability and stability in penetration rates.

NIC estimates the overall market penetration rate at 13.6% of the U.S. population aged 80 and older as of 2025, but that figure varies by submarket. Matching macro demographic projections to submarket-level income qualification data is the step most commonly skipped in early-stage screening and most consequential when it is.

Equip Your Team for Better Investment Outcomes

The demographic and income qualification analysis described here is a core component of the CSHIP Level I curriculum. If your team is building out its senior housing underwriting practice, the CSHIP program at NIC Academy provides the structured framework and data fluency to do it at an institutional level.

Competitive Positioning: Penetration Rates and Market Share

The fourth element of the framework is auditing the existing competitive set to determine how much of the qualified demographic active operators have already captured. This is measured by the market penetration rate: the percentage of age- and income-qualified households in the catchment area that currently reside in senior housing.

A low penetration rate combined with a growing elderly population typically indicates an underserved market. A high penetration rate signals a mature, crowded market where a new entrant must actively take share from established operators.

What Should a Competitive Audit Cover? 

  • Product Tier and Quality: Class A modern communities versus aging, functionally limited properties. In markets where older inventory dominates, a well-capitalized new entrant or repositioned asset can command a meaningful rate premium. Conversely, where Class A supply is already concentrated, an older acquisition may face a structural rate ceiling regardless of operational improvement.
  • Rate Structures: Current average asking rents, care fees, and the prevalence of concessions or community fee waivers. Concession activity is one of the clearest real-time signals of lease-up stress in the competitive set.
  • Operational Reputation: The clinical and operational track record of local managers directly affects resident retention and access to referral networks. Underwriting that ignores operator quality can routinely misprice execution risk, and lenders increasingly respond by applying more conservative underwriting standards or declining to finance assets with thin operator histories in the market.

The Case for Verified Underwriting Data

Evaluating a senior housing market through this four-part framework requires moving away from fragmented, self-reported, or anecdotal data. Underwriting errors in this sector carry direct capital consequences. An investor who underwrites to MSA-average occupancy rather than submarket-specific data may project stabilization at 90% in year two, not accounting for a micro-market already running at 94% with three communities in active lease-up within a three-mile radius. The result is extended lease-up, compressed NOI during the hold period, and — in a refinancing scenario — a property that does not meet lender coverage thresholds at the expected date. In the current environment — rising occupancy, constrained supply, accelerating demographics — that margin for analytical error has narrowed considerably.

Take the Next Step in Senior Housing Underwriting

Mastering market analysis is the first step in executing a successful investment strategy. Moving a deal from initial screening through advanced financial modeling, capital structuring, and operational oversight requires a specialized skill set that takes time to build.

NIC Academy’s CSHIP certificate program is built specifically for senior housing investment professionals, covering market analysis, capital markets, transaction structuring, advanced underwriting, and operational performance across all care segments. CSHIP Level I and Level II are self-paced and available now.

Take the Next Step in Senior Housing Investing

Whether you are actively underwriting a pending transaction or looking to expand your platform’s alternative asset allocation, CSHIP gives you and your team the analytical foundation the sector demands.

Senior Housing as an Alternative Asset Class: A Data-First View

Senior housing has long occupied the margins of real estate conversations, considered an alternative asset class alongside data centers, life sciences, and student housing. That position is changing, and NIC Academy is here to help investors navigate this investment landscape with greater confidence, clarity, and sector-specific expertise.

Senior housing has long occupied the margins of real estate conversations, considered an alternative asset class alongside data centers, life sciences, and student housing. That position is changing, and NIC Academy is here to help investors navigate this investment landscape with greater confidence, clarity, and sector-specific expertise.

Why Is Senior Housing a Good Alternative Asset Class for Investors?

The numbers tell a compelling story. In 2025, senior housing transaction volume hit nearly $27 billion, up from $17.3 billion in 2024, reaching its highest level since 2015. 94% of industry leaders indicated a positive or extremely positive outlook for the year ahead, according to the March 2026 NIC Industry Sentiment Poll, up from 91.9% in September 2025. At the same time, NIC MAP reports senior housing occupancy across primary markets hit a record of 89.5% in Q1 2026. And the demographic tailwind is strong: the U.S. 80+ population is projected to grow 36.6% over the next decade, more than seven times the overall U.S. population growth rate of 5% over the same period.

For investors, the case has never been stronger. Record transaction volume. Near-record occupancy. Decade-low new construction. A demographic wave without modern precedent. Together, these forces have pushed senior housing from an alternative asset to a core-adjacent asset, reshaping how capital is allocated. This piece pulls together the data behind that shift. The conclusion isn’t that senior housing is experiencing a moment. It’s that the structural drivers behind the moment are creating a new baseline. 

The Housing Transaction Volume Story

Senior housing is undergoing a structural evolution. While a massive surge in deal volume is catching headlines, the real story lies beneath the surface. Institutional capital is shifting away from traditional real estate sectors and anchoring itself to alternative assets. Capital deployment accelerated through the end of 2025 and has continued into 2026.

The Broader Shift to Alternative Asset Classes

The alternative property classes, the category that includes senior housing, captured 16.2% of total commercial real estate transaction volume in 2025, marking a decade-high share. Senior housing is part of a broader, structural shift in how institutional capital is allocated across real estate. While traditional sectors like office, retail, and hospitality are still grappling with complex questions about their long-term demand profiles, alternative classes are not facing the same uncertainty. They are actively absorbing that market share.

Public Markets Signal Growth Comfort

The buyer composition is rapidly institutionalizing. REITs and public buyers accounted for 32% of 2025 senior housing transaction volume, up from 24% in 2024. While private capital still represents 50% of transactions, the REIT share gain is the more meaningful signal. Public market participants must defend their allocation decisions to investment committees and shareholders. When their market share rises by eight points in a single year, it reflects underwriting committees getting comfortable with the asset class at scale.

The forward indicator: the 2026 NIC Industry Sentiment Poll recorded a new record high, with 94% of operators, investors, lenders, and other industry professionals reporting a positive or extremely positive outlook for the year ahead. Compared to two years ago, overall industry sentiment has jumped more than 14 percentage points.

The Data Behind the Opportunity

NIC tracks every meaningful metric in senior housing — occupancy rates, cap rates, absorption trends, and construction pipelines across 31 major markets. This primer puts the most important numbers in one place, so you can walk into any conversation about the asset class ready to speak the language of institutional capital.

The Senior Housing Occupancy Story

NIC MAP placed national senior housing occupancy across 31 primary markets at 89.5% in Q1 2026, nearing the record high for the industry of 91.3% set back in 2006. This caps a 19-quarter run of positive absorption since the pandemic trough.

On the supply side, the picture is the most constrained it has been in nearly two decades. New construction starts are down 85% from peak in primary markets and 94% in secondary markets. Overall construction activity is at a 17-year low. Higher financing costs, persistent labor cost pressure, and constrained access to debt and equity capital for startup projects have effectively closed the development pipeline for three years running.

Why the supply timeline matters

The typical senior housing construction cycle from groundbreaking to stabilized occupancy runs roughly 29 months. Even if construction starts inflected upward today, new inventory delivered at stabilization wouldn’t appear until late 2028 at the earliest, and the actual ramp is slower than that. Through this window, supply is essentially fixed. Demand is not.

The Demographic Backdrop

The U.S. 80+ population is projected to grow from 14 million to 19 million over the next decade, a 36.6% increase. Total U.S. population over the same span is projected to grow 5%. Census Bureau 2024 vintage projections place the 80+ cohort is projected to nearly triple from its 2020 base by 2060.

The figure that lands hardest in any underwriting conversation: More than 10,000 Americans turn 65 every day.

The oldest boomers turn 80 in 2026. The typical age of an assisted living resident at move-in is in the low 80s. The age for memory care is slightly older. For independent living, slightly younger. The largest generational cohort in U.S. history is now crossing the age threshold that has historically driven senior housing demand.

What makes this demographic case different from typical real estate tailwind arguments is that the demand isn’t a forecast: it’s a census exercise. Everyone who will be 80 in 2030 is already here. We can count them. Multifamily, office, and retail demand depend on employment, migration, and consumer behavior. Senior housing demand depends primarily on people aging, which they will. 

The open questions are how many will choose purpose-built senior housing over aging in place, how many will pay privately versus seeking Medicaid-funded options, and how the middle-income cohort will be served. The Forgotten Middle research projects an increase in the number of middle-income seniors from 7.9 million in 2014 to 14.4 million in 2029, a population that will require affordable yet service-rich options the market has not yet fully addressed. These are real uncertainties. They don’t change the size of the addressable population.

Cap Rates and Pricing

Average senior housing cap rates compressed to 6.2% in Q4 2025, down 17 basis points across the second half of the year, the first sector-wide compression since 2021. More than 84% of CBRE survey respondents expect further compression in 2026, compared to 57% who said the same a year earlier. 

Senior housing currently yields approximately 210 basis points over the 10-year Treasury. That still outpaces the long-term multifamily average of 150 basis points, but it represents a significant tightening from the senior housing sector’s own historical average of around 416 basis points. 

Investors have historically demanded that premium to offset operational complexity: finding the right operating partner, managing healthcare labor costs, navigating licensing and regulatory requirements, and working within a smaller secondary buyer pool. As the buyer universe expands and sophisticated capital steps in, that risk premium is compressing.

Average price per unit reached $182,800 in Q4 2025, up 29% year-over-year. Primary markets are priced at approximately $189,000 per unit; secondary markets at $144,000. Cap rates vary significantly by product type: Class A independent living in core markets trades around 6.1%, active adult around 5.5%, freestanding memory care at 9.5%–9.6%, and Class A skilled nursing around 12%. The spread reflects the market’s view of operational difficulty and risk, and it’s visible in every transaction.

6.2%

Avg. Senior Housing Cap Rate, Q4 2025

$182,800

Avg. Price Per Unit, Q4 2025

Turn Sector Knowledge Into a Verifiable Credential

The CSHIP certificate is the only professional program built directly on NIC data and methodology. Six courses covering market analysis, capital markets, underwriting, and transaction structure — designed for CRE professionals who are serious about making senior housing a core part of their practice

The 2027–2028 Refinancing Window

Nearly $40 billion in senior housing loans are maturing between 2026 and 2030. In 2026 alone, just under $8 billion comes due; in subsequent years, annual maturities increase to between $10 and $12 billion. A meaningful share of these loans were originated between 2020 and 2022, underwritten in a fundamentally different rate environment, and will mature in that same window.

The implication is straightforward. Well-performing assets will refinance, possibly with incremental equity. Assets that don’t perform will trade. The 2027–2028 window is when opportunistic capital is positioned to acquire assets at discounts not yet visible in broader market data.

For investors with available capital and operational underwriting capacity, this represents the most concentrated buying window the sector has seen since the post-2008 cycle.

What Makes Senior Housing Different

The investment case above does not, by itself, equip an investor or broker to operate in the senior housing sector. What follows is the part that matters most for anyone moving from “I should look at this” to “I have a deal in diligence.”

Senior housing is operating real estate, not net-lease real estate. The asset generates income because an operator runs a service business inside it, not because a tenant signed a lease. Investment cash flow is what remains after labor, food, insurance, licensing, and capital costs. The operator’s competence is the single highest-leverage variable in the investment.

Deal structure distributes risk differently. Three structures dominate: net lease, which caps owner upside but transfers most operating risk to the operator; operator-managed, which captures full upside and full downside; and RIDEA, a hybrid permitted under REIT tax rules that splits both. The same physical property can be priced very differently across these structures because the underlying investment differs.

Regulatory complexity is real. State licensing is required for assisted living. Certificate of Need approvals apply in many states. Skilled nursing components carry CMS exposure. Operator transitions can require licensing transfers that don’t close on the same timeline as the real estate. A transaction that appears clean on the real estate side can be delayed for months by regulatory steps that simply don’t exist in multifamily or office.

Labor is the dominant expense variable. Labor typically represents 50% or more of operating expenses in assisted living and memory care, well above the labor share in any other major commercial real estate class. A 5% labor cost increase can move NOI by 250 basis points or more. Underwriting that assumes stable labor inputs, as a multifamily playbook would, will systematically overstate cash flow.

These are the four reasons generalists get senior housing wrong on their first deal. The asset class rewards specialists for the same reason it pays a yield premium: the analytical work is different, and there are no shortcuts.

Where Investors Can Go Deeper

The investment case is the entry point. Sourcing, underwriting, structuring, and closing require sector-specific fluency that doesn’t transfer from other commercial real estate verticals.

NIC Academy’s CSHIP (Certified Senior Housing Investment Professional) program offers a strong learning pathway. Level I covers market analysis, capital markets, and transaction structuring across all senior housing segments. Level II adds development, operations, and advanced underwriting. Both levels include access to NIC MAP, the same dataset cited throughout this analysis.

For those looking to build broader industry knowledge and connections, NIC’s research publications and annual conferences offer additional depth, connecting investors with operators, lenders, and policymakers shaping the sector’s future.

The capital is moving. The demand is secured. The supply pipeline is closed. The work, for anyone planning to participate, is getting fluent in how this asset class actually operates.

Learn More About NIC Academy Programs Explore certificate programs, courses, and boot camps