Family Offices: Potential Capital Partners

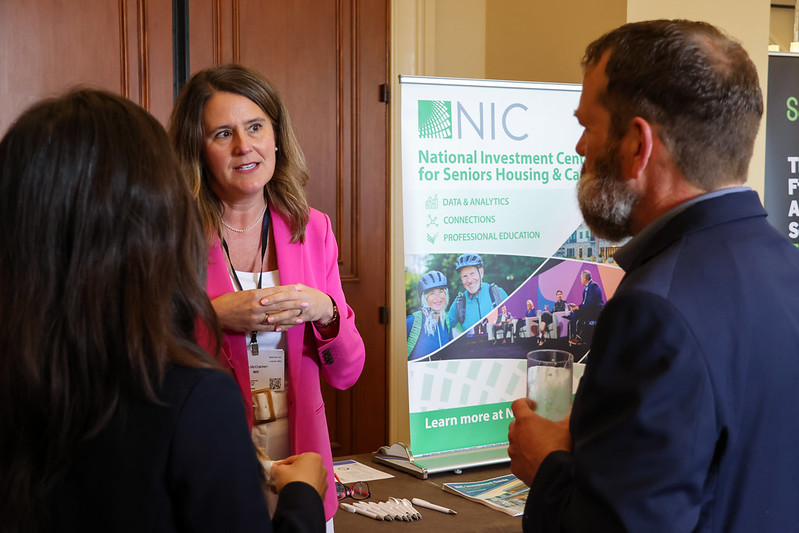
The senior housing and care sector is ripe for growth, driven largely by the significant aging demographic hitting the U.S. daily. This growth will require committed capital partners, not only in the form of ongoing support from existing sources of capital, but with new and emerging financial partners. For the past year, NIC has focused time on educating and engaging with Family Offices who, on average, invest roughly 15-20% of their assets in real estate holdings.
A formal “Family Office” is an entity that provides services to manage the wealth and interests of ultra-high-net-worth individuals and families, typically across multiple generations. It is estimated that there are nearly 3,200 Family Offices in North America, a figure which is projected to grow to nearly 4,200 by 2030, accounting for about 40% of the Family Offices globally.1 At the same time, wealth held by these North American institutions is forecasted to hit $4 trillion by 2030.1

While these entities have great wealth to deploy across various investments, it is important to understand the nuances of Family Offices. Awareness of these unique characteristics will best position senior housing organizations for a potential investment and long-term relationship. 

  1. An estimated 68% of Family Offices in this country have been established since the year 2000.2 This means that they are still evolving and working toward greater institutionalization. Family Offices learn from one another and may often work in collaboration, whether in forming multi-family offices or perhaps simply partnering for investment opportunities.
  2. The space is fragmented and can be difficult to navigate. This may mean making connections with these individuals and entities can be a challenge.
  3. As one Family Office expert noted at a recent conference, “Just because you have a lot of money doesn’t mean you know how to invest.” These high-net worth individuals and their families often look to trusted investment advisors to invest and manage their funds. This means that relationships often need to be made with the advisors as well as family members.
  4. Trust is paramount. These individuals and entities can be guarded for obvious reasons, and many have been burned in the past with ill-informed investments. It is important to spend time developing the relationship and fostering that trust, understanding that Family Offices are not necessarily going to invest right after meeting you. This means that this type of capital requires a long-term commitment.
  5. Wealth preservation is a high priority for Family Offices. This means more patient capital, which can be a good thing for the senior housing sector.
  6. Education will be needed. Compared to other commercial real estate property types, senior housing is more operationally complex. It is your responsibility to fully educate potential partners on the nuances of this space and potential risks. Senior housing continues to be seen as an alternative asset class and most Family Offices, even those with real estate investment experience, will not be familiar with the sector. Spend the time needed to ensure alignment and an educated investor, which will better position the relationship for long-term success.
  7. It is important to note that the opportunity for Family Office investment goes beyond real estate. Many of these individuals have built fortunes on operational-intensive companies not solely based on real estate. This offers a potential emerging type of capital investment in our sector.

NIC is continuing to commit resources to capital formation activities and is developing additional resources to help others in the sector educate potential future investors. Stay tuned in the coming months for releases of many of these additional resources. If you have questions about this target audience, you can reach out to me at lmccracken@nic.org.

Sources:

1Defining the Family Office, 2024. Deloitte
2Diamond Wealth

Active Adult Rental Communities: Data Dive

How Does Active Adult Differ from Traditional Senior Housing?

NIC MAP tracks age-eligible, market-rate, multifamily rental properties focused on enhanced lifestyle programming without providing meals. These communities are designed for older adults who are ready to downsize to a maintenance-free lifestyle, but who do not yet need the services and care provided in traditional independent living communities.

As of the first quarter of 2025, NIC MAP tracked nearly 800 active adult rental properties totaling approximately 118,000 units, a much smaller market size than the approximately two million senior housing units that NIC MAP tracks. With a median unit count of 138, active adult rental communities are comparable to traditional independent living’s median of 144 units, although the size of the units is typically larger within active adult. With a median age of less than 10 years old, active adult communities are generally newer than traditional independent living communities, which have a median age of 21 years1.

Stabilized Properties Are Nearly 96% Occupied on Average

NIC MAP in the first quarter of 2025 began reporting a time series of quarterly occupancy rate trends. At 95.6% in the most recent quarter, stabilized average occupancy rates have been above 95% for three consecutive quarters. The average all properties occupancy rate – which includes properties open less than two years – has also been robust, ranging from 92% to 94% over the most recent four quarters.

What Rental Rates Are These Active Adult Communities Charging?

NIC MAP reports median average monthly rents (AMR) by metro area. Within the largest 31 Primary Markets tracked by NIC MAP, Miami ranks highest at a median of nearly $3,500 per month, followed by Portland, Chicago, Washington, DC, and New York as the remainder of metro areas with median AMRs above $3,000. The next five highest median AMRs are clustered around $2,500 in Boston, Seattle, Philadelphia, San Antonio, and Denver.


Active Adult Boot Camp Banner

Deepen your knowledge of the Active Adult sector by attending NIC Academy’s first-ever Active Adult Boot Camp on Wednesday, September 10, 2025, in Austin, TX. This full-day session, held in conjunction with the 2025 NIC Fall Conference, provides a comprehensive introduction to Active Adult, offering both foundational knowledge and hands-on learning. Register today!


What is Driving Demand for Active Adult Rental Communities?

The fastest-growing group of renters in the U.S. are those aged 65–742, reflecting broader demographic shifts as the baby boomer generation ages. There is also a notable rise in “gray divorce” (divorces among those aged 50 and older) and solo aging, both drivers of demand for active adult rental communities. Additionally, the boomer generation in recent years has become the wealthiest in terms of median net worth, further fueling demand for high-quality properties with resort-like amenities.

Most Popular Amenities Focus on Lifestyle and Wellness

The most popular amenities in active adult rental communities include fitness centers, pools, clubhouses, and activities coordinators, illustrating residents’ strong interest in lifestyle, engagement, and wellness. NIC MAP’s Primary and Secondary Markets share nine of the top 10 amenities, with personal storage ranking within the top 10 amenities in the largest 31 Primary Markets tracked by NIC MAP, while salons and spas rank within the top 10 amenities in the 68 Secondary Markets.

Room for Growth

Looking ahead, the active adult rental market is still in its early stages. Penetration rates are well below those of traditional senior housing, indicating potential opportunity for further development depending upon the market and submarket. Investors and developers should conduct in-depth research and ensure thorough due diligence when entering a new market, striving to keep lifestyle and engagement at the core of lease-up and operations.

[1] ASHA The State of Seniors Housing, 2024

[2] Census Bureau


Property Conversions to Alternative Uses

Over the last 40 years the senior housing industry has continued to evolve. From new and improved wellness programming to major advancements in health tech, the industry continues to modernize itself in the interest of a healthier and happier resident.

While we celebrate advancement in the health, happiness, and longevity among our aging population, certain subsets of senior housing communities remain in a vulnerable position. As the landscape of senior housing evolves, some older communities struggle to keep up. Some of these properties, often built decades ago, no longer meet the expectations or needs of today’s consumer. Inefficient layouts and lack of modern amenities leave them ill-equipped to compete with newer, more thoughtfully designed communities. However, rather than allowing these properties to struggle financially, there is a growing opportunity to convert them into alternative uses that serve different populations.

Most conversion candidates tend to be built before the millennium and have certain attributes that make keeping up with evolving consumer preference a challenge. That’s not to say that age or functional obsolescence is the only factor contributing to alternative uses. Some communities may have been developed in the last 10 to 15 years but missed on their underwriting assumptions and simply can’t command the rental rates needed to stand on sturdy financial ground. Others may have underwritten the rate equation correctly but missed on market demand, leaving the community poorly occupied beyond an extended period. Whatever the reason for a pivot, there are several alternative use cases investors are having tremendous success executing.

One of the more common instances of this pivot is converting senior housing communities into behavioral health or substance abuse treatment centers. The demand for mental health services has grown dramatically, yet the supply of appropriate residential treatment centers has not kept pace. Senior housing communities include features such as private or semi-private rooms, dining areas, recreation spaces, and medical infrastructure—attributes that align well with the needs of behavioral health environments. While the physical plant characteristics of senior housing communities mostly mimic the needs of behavioral health facilities, the specific zoning of the existing senior housing community typically dictates the viability of conversion.

Another growing trend in our industry is conversion to more affordable, market-rate 55+ living. Like behavioral health conversions, zoning can be an impediment, however, the change in use is marginal and generally welcomed by local municipalities and their constituents. These communities present a practical and timely solution as they have the foundational infrastructure needed for active adult housing during a time of rising costs for senior housing residents. Independent living communities work best for this adaptive reuse; however, with targeted renovations and cost-effective upgrades, assisted living communities and even skilled nursing facilities can be repositioned to serve middle-income and fixed-income older adults who are priced out of other communities. By preserving the communal and supportive elements while eliminating costly services that aren’t necessary for independent seniors, owners can offer a quality, age-restricted living option at a more accessible price point. These conversions not only extend the useful life of aging properties but also help meet the growing need for affordable, age-friendly housing solutions.

Ultimately, converting senior housing to other uses should not be looked at as a fallback, but rather an opportunity. By embracing adaptive reuse, you can breathe new life into outdated properties and support other areas of need. In doing so, you ensure these spaces continue to serve other unique populations in meaningful ways.

CCRC Performance 1Q 2025: A Deep Dive into Entrance Fee vs. Rental CCRC Trends 

The following analysis examines broader occupancy trends, year-over-year changes in inventory, and same-store asking rent growth – by care segment – within 571 entrance fee Continuing Care Retirement Communities (CCRCs) and 488 rental CCRCs in the 99 NIC MAP Primary and Secondary Markets based on data through the first quarter of 2025. 

Regional Entrance Fee and Rental CCRC Occupancy: 1Q 2025 vs. Time Series High  

The exhibit below demonstrates regional occupancy rates for entrance fee and rental CCRCs across the 99 primary and secondary NIC MAP markets. Each bar represents occupancy as of the first quarter of 2025, while the markers above the bars indicate the highest occupancy recorded for each region since the first quarter of 2008. The difference between the current bar and its marker highlights the gap between present occupancy and each region’s historical peak.  

In the first quarter of 2025, entrance fee CCRCs continued to outperform rental CCRCs in occupancy rates across all regions. The Northeast led with the highest occupancy at 93.4% and is the region closest to reaching its time series high of 94.9%, with an occupancy difference of just 1.5 percentage points (pps). Meanwhile, the Southwest (88.8%) lags furthest behind its time series peak of 94.2%, with a difference of 5.4pps.  

For Rental CCRCs, the Northeast region recorded the highest rental occupancy at 91.7%, while the West North Central region reported the lowest at 86.7%. Compared to time series high occupancy, the Pacific region is closest, with a difference of 2.9pps, whereas the Mid-Atlantic shows the largest gap at 5.1pps.  

Across the combined 99 NIC MAP primary and secondary markets, entrance fee CCRCs posted an average occupancy of 91.6% in the first quarter of 2025, compared to 88.7% for rental CCRCs. Entrance fee CCRCs trail the time series peak by 1.5pps and rental CCRCs by 3.1pps. 

1Q 2025 Market Fundamentals by Care Segment – Entrance Fee CCRCs vs. Rental CCRCs 

The exhibit below compares the market performance of entrance fee CCRCs and rental CCRCs by care segment for the first quarter of 2025, highlighting year-over-year changes in occupancy, inventory, and asking rent growth.  

Occupancy. Entrance fee CCRCs continued to outpace rental CCRCs in occupancy rate across all care segments. The difference in the first quarter of 2025 occupancy rates between entrance fee CCRCs and rental CCRCs was largest in the independent living segment (2.6pps), followed by the nursing care segment (1.3pps), and the assisted living segment (0.4pps), with the smallest gap in the memory care segment (0.3pps).  

The highest occupancy in entrance fee CCRCs (93.0%) and rental CCRCs (90.4%) was seen in the independent living care segment. 

Asking Rent. The monthly average asking rent for entrance fee CCRCs across all care segments remained higher than rental CCRCs. Rental CCRCs showed higher year-over-year rent growth in memory care (3.6% to $8,021), and nursing care (4.6% to $403*) segments. Entrance fee CCRCs showed higher year-over-year rent growth in independent living (4.0% to $4,253) 

Note, these figures are for asking rates and do not consider any discounts that may occur. 

Inventory. Compared to year-earlier levels, assisted living inventory experienced the largest decline in rental CCRCs (2.8%) and the largest growth in entrance fee CCRCs (1.4%).  

Negative inventory growth can occur when units/beds are temporarily or permanently taken offline or converted to another care segment, outweighing added inventory. 

NIC SHARK Report Projections Hold: Senior Housing Occupancy on Track, Leading CRE in Occupancy Growth 

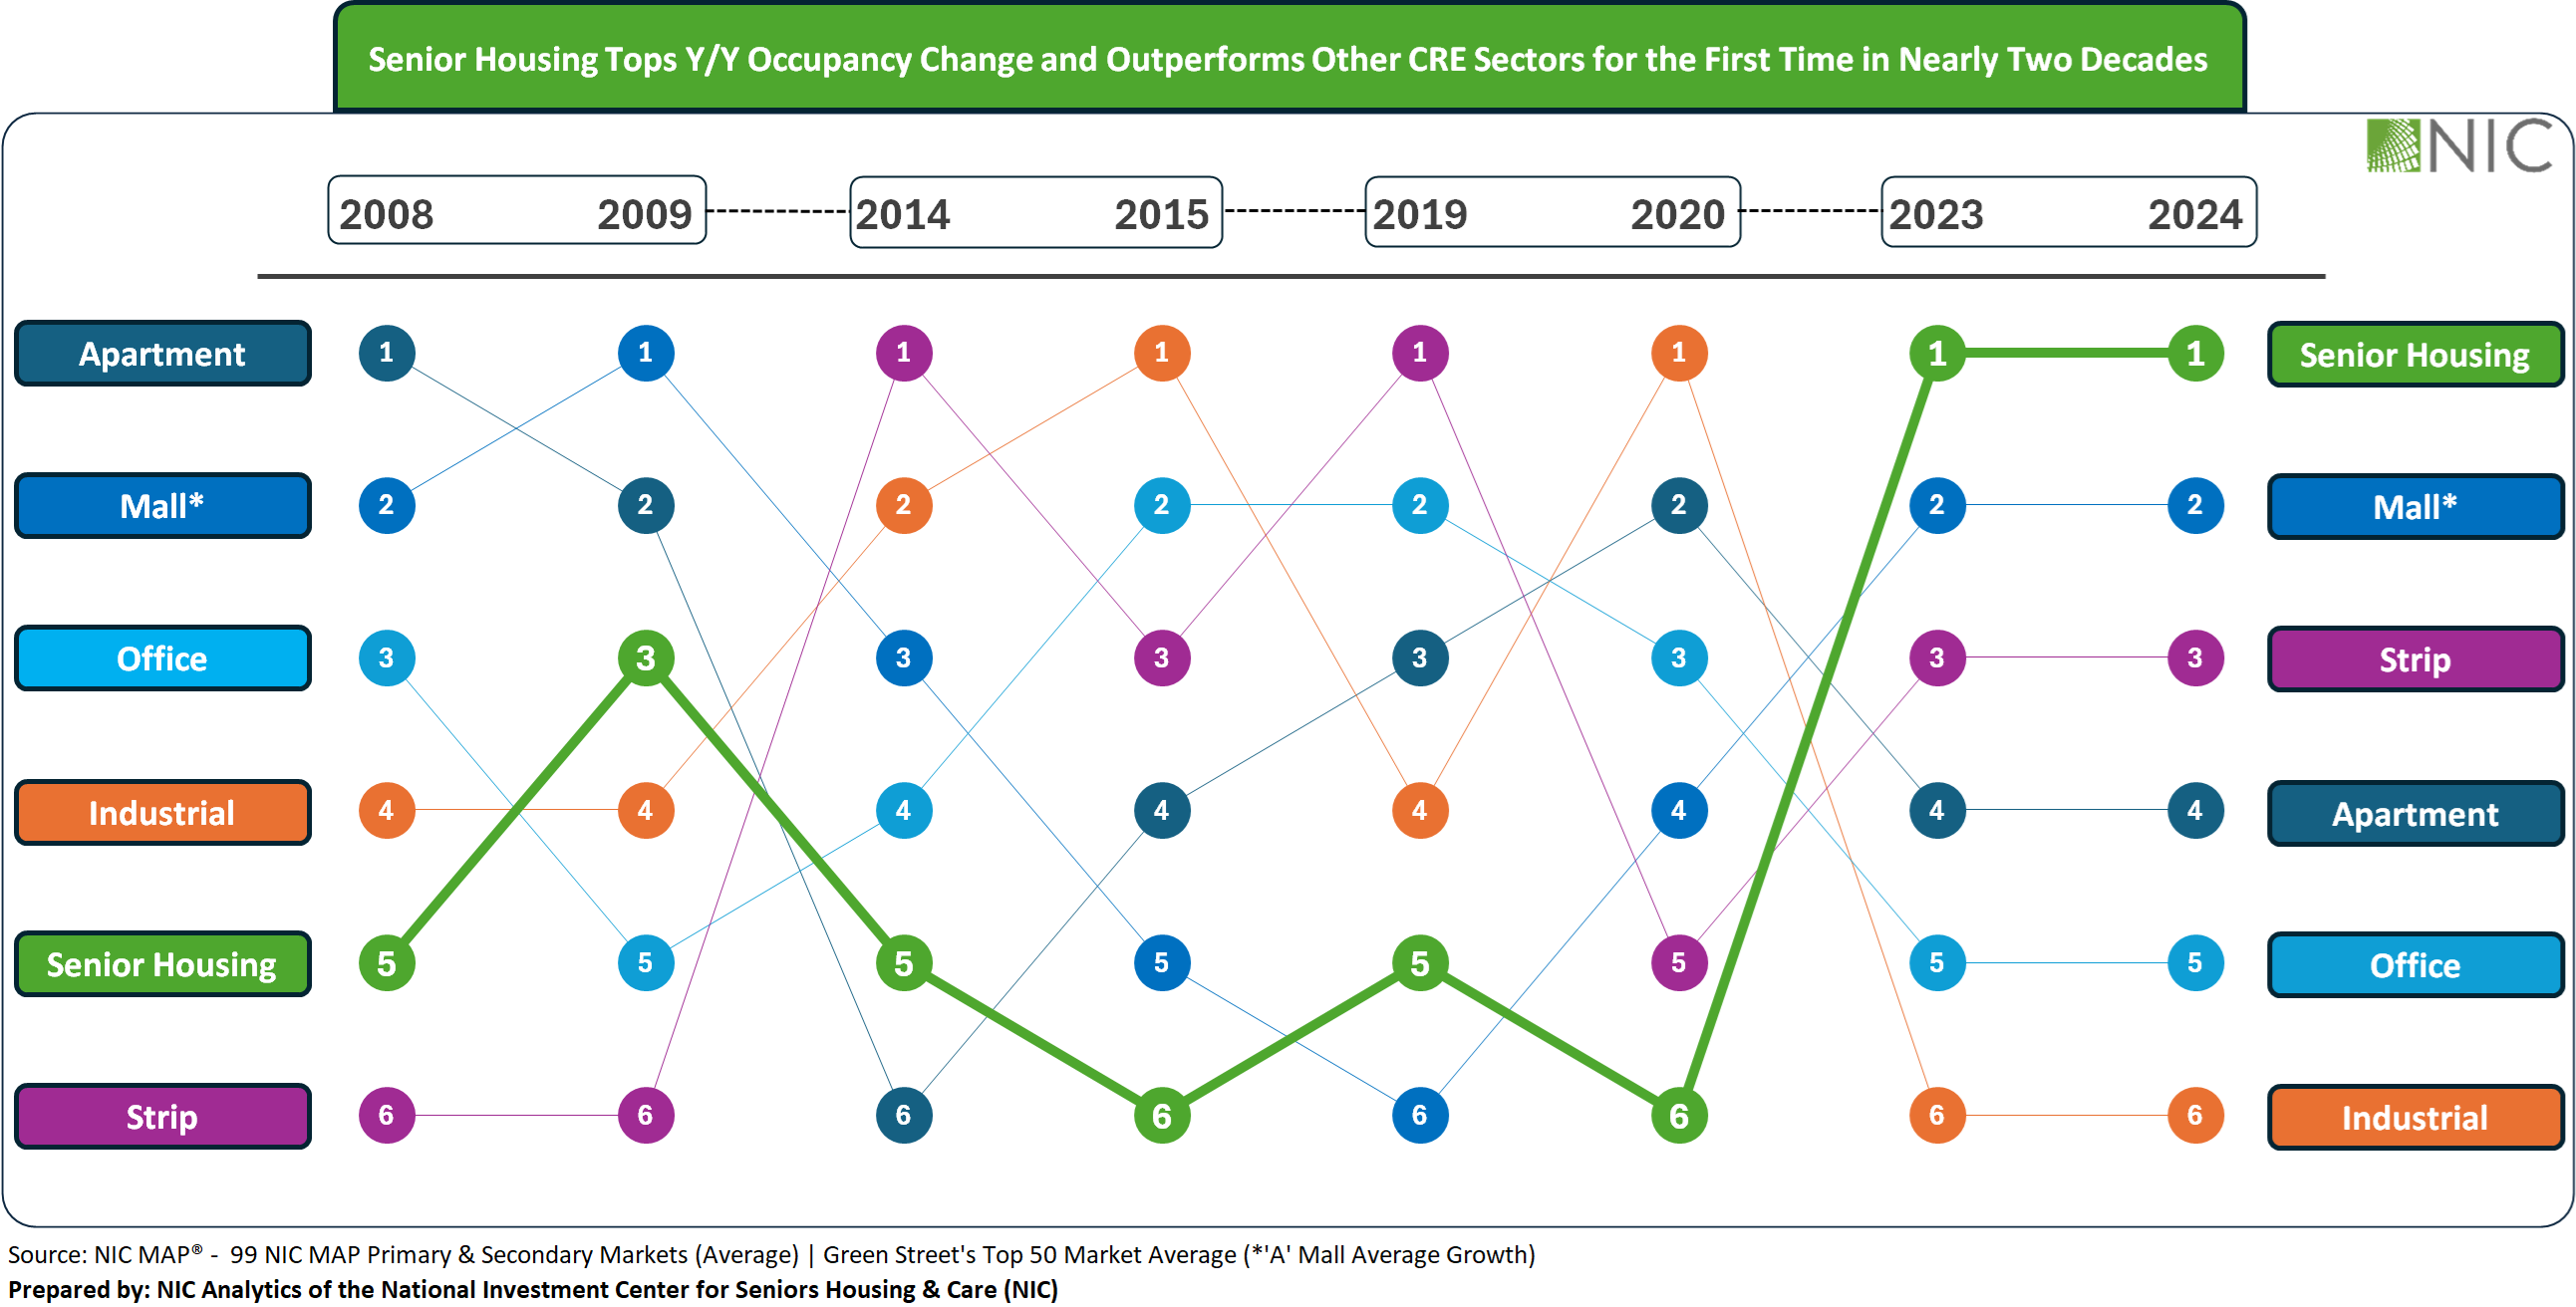
In early 2024, the NIC SHARK report – an in-depth analysis that issued a call to action following the disruption of the pandemic – laid out a forward-looking view of the senior housing sector, grounded in demographic momentum, constrained new supply, and a demand trajectory projected to push occupancy to new heights. A year later, the data is in, and the market is moving as anticipated. Senior housing occupancy momentum is not only tracking with projections made in our SHARK report, but occupancy growth is also outperforming other major commercial real estate (CRE) sectors for the first time in nearly two decades. 

Yet with momentum comes new challenges. Labor constraints, tightening immigration policy, and tariffs influencing construction inputs are creating friction that will shape development, staffing, and capital decisions in the years ahead. 

Key Takeaways – One Year After the Inaugural NIC SHARK Report 

  1. Occupancy is on track with SHARK projections and is expected to surpass peak levels not seen since 2008. 
  1. Senior housing occupancy growth is now outperforming other CRE asset classes, which has the potential to attract additional capital inflows from investors.  
  1. Investor interest is increasing, but labor constraints, immigration policy shifts, and tariffs continue to pose operational and development challenges. 
  1. Occupied unit levels continue to grow steadily, with no signs of a demand cliff, but the market is entering a new phase. 
  1. Senior housing projects will likely continue to be built at above-replacement cost in 2025, pushing transaction volumes and per-unit pricing higher. 
  1. Approaches to greater construction efficiency are emerging but need greater scale and adoption. Meeting rising demand requires building and designing smarter, with different approaches than in the past. 

1. Occupancy is Right on Track 

As projected in the first segment NIC SHARK report, senior housing occupancy levels across most regions have reached or exceeded 2024 benchmarks. Behind this rise is the broad-based demand across both needs-based and lifestyle-choice property types, limited inventory growth, and the continued strength of the absorption-to-inventory-growth velocity (AIV) ratio. In 2024, the AIV ratio stood at 27:10 across the 99 NIC MAP Primary and Secondary Markets, well above the threshold needed to drive continued occupancy gains. 

The exhibit below shows that by the end of 2026, senior housing occupancy in most regions is projected to surpass the peak levels recorded since 2008. Notably, the Secondary Markets, East North Central, Mountain, and Southwest regions are the closest to reaching those historic highs, with the gap ranging from 1.0pps in the Mountain region to 1.6pps in the Southwest. 

2. Senior Housing Occupancy Growth Outperforms Other CRE Sectors 

In a notable shift and for the first time in nearly two decades, senior housing occupancy growth is now outperforming traditional commercial real estate (CRE) sectors such as apartment, strip malls, office, and industrial.  

In today’s higher-interest rate environment with tighter capital availability, senior housing’s resilience, reflected in stronger occupancy growth in recent years has attracted growing attention from institutional and private investors. With its stable, forward-looking, and demographically anchored growth, senior housing stands out in the broader CRE arena. In fact, in an October 2024 ULI poll, senior housing ranked second only to data centers in projected risk-adjusted returns over the next three years. 

3. Investor Interest Is Rising, But So Are Friction Points 

The uptick in investor interest is real. Many debt lenders, brokers active in the space, and entities raising funds for senior housing investment, all observe an increase in the volume of new investor entrants into the market. Transaction volume picked up in 2024 and capital is increasingly looking toward ground-up development again. However, labor availability remains a top concern, now exacerbated by immigration policy shifts. Operators are contending with limited pipelines of frontline and clinical staff, a challenge that could limit the pace of new move-ins and elevate wage pressure. 

Additionally, tariffs and supply chain issues have the potential to continue to influence construction timelines and costs, further contributing to the likelihood that new projects will remain above replacement cost through at least 2025, and development activity will be limited. 

4. Occupied Unit Growth Continues at a Disciplined Pace 

Occupied unit growth continued at a measured and disciplined pace with no sign of a demand cliff on the horizon. As projected, occupied penetration rates continued to rise steadily across regions, reflecting a healthy alignment between the number of aging households and the supply of available senior housing units. But with most new projects taking years from planning to delivery, today’s steady and strong absorption signals a clear need to start building now to meet the demand rooted in long-term population trends. 

5. Supply Remains Moderate, but Pressure is Building 

Construction activity remains subdued, and the market is not at risk of being oversupplied. However, with occupancy rising and new projects facing multi-year timelines, senior housing is approaching a new phase. By 2026, stronger demand, combined with a potential undersupply of new inventory, is expected to drive upward pressure on pricing, and developers will need to take a thoughtful approach aligning rising development costs with affordable rent. 

6. Construction Efficiency* will Emerge out of Necessity 

Rising costs and prolonged timelines are prompting more developers to explore modular construction, off-site fabrication, and smarter design strategies. While still early in adoption, these approaches reflect a growing recognition that meeting future demand will require building smarter, not just building more.  

As senior housing stakeholders look ahead to 2026 and beyond, the next phase will require translating accurate forecasts into strategic action, balancing optimism with realism, and growth with discipline. 

*Learn more about construction efficiency.