Identifying New Opportunities: Treating Chronic Kidney Disease in Senior Housing

Understanding the population demographics and prevalence of chronic kidney disease by market can provide insights about developing specialized communities.

Introduction

This blog presents an abbreviated portion of the recently released white paper by NIC Analytics. Understanding the population demographics and prevalence of chronic kidney disease (CKD) by market can provide insights about potentially targeting select metropolitan areas in which to develop communities with specialized offerings for senior housing residents with CKD. Due to the differing levels of Medicare beneficiaries (MB) with CKD by metropolitan area, operators may be able target specific markets where they can gain increased resident interest as well as potential additional income by offering services tailored to residents with CKD such as in-home dialysis and specialized dietary support.

Serving the kidney health needs of residents is an opportunity for senior housing operators. About 37 million Americans are estimated to have chronic kidney disease, but many people do not know they have it and are undiagnosed. The CDC estimates that as many as 90% of people who have CKD do not know, and as many as 40% of people with severe CKD do not know. Chronic kidney disease is more common among seniors, with an estimated 38% of people aged 65 and older having CKD.

Most people who have CKD do not reach the point of needing dialysis, but nearly 800,000 Americans do have End Stage Renal Disease (ESRD) with 71% of them requiring dialysis and the remaining 29% receiving a transplant. Older Americans with ESRD comprise ~1% of Medicare patients, but account for ~7% of Medicare spending. In-home dialysis improves patient comfort and flexibility in care plan scheduling, as they have greater ability to adjust the hours and frequency of their treatment.

Dialysis within senior housing properties. Could dialyzing at home in senior housing present a “win-win” for all parties involved? Residents may be more satisfied with their dialysis care and operators can capture Medicare reimbursement. In addition to offering in-home dialysis, operators could distinguish a focus on treatment for CKD by offering additional features like specialized dining, as high protein diets are often recommended. Operators with their own Medicare Advantage or I-SNP plan may be able to capture increased Medicare reimbursement for in-home dialysis done at their properties. Additionally, considering the high rates of underdiagnosis of CKD, operators choosing to specialize care in this area could test residents for CKD to determine unmet needs for kidney health.

The recently released white paper and this blog illustrate how NIC MAP Vision data can help operators understand the local dynamics of a market. In addition to industry-leading senior housing supply and occupancy data, NIC MAP Vision offers subscribers different counts of Medicare beneficiaries (MB) with different types of diagnoses that can be drilled down to local geographies.

For this analysis, we use Medicare beneficiaries (MB) with chronic kidney disease to demonstrate how NIC MAP Vision can support an evaluation of potential demand for this niche specialization. We investigate trends in chronic kidney disease in potential senior housing residents, existing supply of senior housing (inventory), and usage of senior housing (occupancy). A full description of the methodology and limitations and caveats to the analysis can be found here. A similar analysis of the incidence in dementia was recently published by NIC Analytics.

The Medicare beneficiary data do not specify the level of severity of CKD and ESRD is not broken out (that level of detail is not available to NIC MAP Vision from Medicare). As a result, the number of Medicare beneficiaries with CKD included in this analysis is not directly equivalent to the number of people who will need dialysis and at the same time these data also understate the incidence of CKD due to underdiagnosis. These data are still useful in understanding incidence of CKD and market evaluation for operators who may be considering a focused offering for residents with CKD.

Key Findings

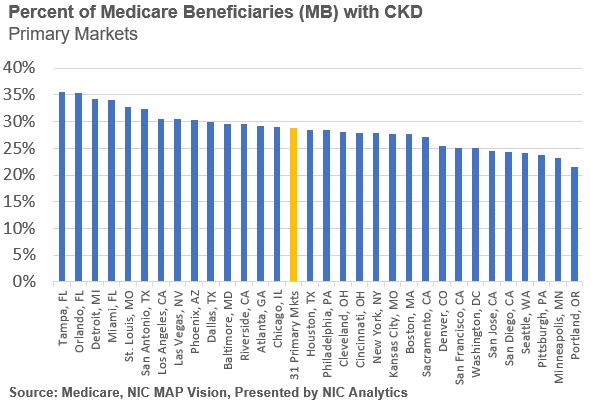
Certain metropolitan markets have higher shares of Medicare beneficiaries with chronic kidney disease, but even markets with lower shares may still hold opportunity. As the chart below demonstrates, the markets with the highest shares of Medicare beneficiaries with chronic kidney disease include:

    • Tampa (35.5%, 200,351 total MB with CKD)
    • Orlando (35.3%, 118,241 total MB with CKD)
    • Detroit (34.2%, 223,545 total MB with CKD)
    • Miami (34.0%, 352,802 total MB with CKD)
    • St. Louis (32.7%, 139,738 total MB with CKD)
    • San Antonio (32.4%, 94,801 total MB with CKD)

Markets with the lowest shares of Medicare beneficiaries with chronic kidney disease in the Primary Markets include:

    • Portland (21.6%, 69,870 total MB with CKD)
    • Minneapolis (23.1%, 103,658 total MB with CKD)
    • Pittsburgh (23.7%, 104,159 total MB with CKD)
    • Seattle (24.1%, 112,675 total MB with CKD)
    • San Diego (24.4%, 103,680 total MB with CKD)

Interestingly, Portland, Minneapolis, and Seattle are metros with higher penetration rates of senior housing more generally. Penetration rates are a way to measure use or availability of senior housing and can be calculated in several different ways. NIC has traditionally defined penetration as the sum of senior housing inventory divided by the number of households aged 75+. Some people also think of penetration rates as a proxy for consumer familiarity (higher penetration rates meaning higher levels of familiarity with senior housing as a product). It is interesting that three metros where senior housing is a well-known and established concept are areas where there are lower amounts of Medicare beneficiaries with CKD.

It’s also valuable to note the total numbers of seniors on Medicare with CKD per metro area. Although San Diego has a smaller share of Medicare beneficiaries with CKD than San Antonio, San Diego has a larger total number of Medicare beneficiaries with CKD by nearly 9,000 people.
Picture 2

As previously mentioned, Minneapolis (32.7%), Portland (30.5%), and Seattle (22.4%) are all markets with higher rates of senior housing penetration and have higher levels of senior housing as a share of MB with CKD. Senior housing is a well-established concept in these three metro markets. Interestingly, Kansas City (20.4%) and Denver (20.0%) are also markets with higher levels of senior housing as a share of MB with CKD. Las Vegas (4.9%), New York (5.5%), Los Angeles (7.1%), Riverside (7.3%), and Miami (7.3%) are the five metro markets in the Primary Markets with the lowest shares of senior housing over MB with CKD. The three Florida metros (Tampa, Orlando, and Miami) that are in the top 5 metros of the 31 Primary Markets that have high shares of total MBs with CKD are all under 12% for senior housing as a share of MB with CKD. New York (824,213) and Los Angeles (515,152) are unsurprisingly the two metro markets with the highest total number of MB with CKD.

This demonstrates that in addition to differing incidence of chronic kidney disease among the Medicare beneficiaries, there are also varying levels of senior housing inventory, with some markets like Miami having a high share of MB with CKD, high total numbers, and lower levels of senior housing inventory. However, Miami is a market that was still facing notable occupancy challenges in the fourth quarter of 2021.

The white paper presents additional data findings. Selected metrics provide a baseline for evaluating potential demand, current supply, and current utilization rates of available supply when considering a senior housing product offering tailored to serving the population of seniors with CKD or ESRD. NIC MAP Vision offers these data at more localized levels along with additional data that would be useful to planning a product offering including data on income levels and locations and drive times for hospitals.

Discussion

This analysis demonstrates differing levels in incidence of diagnosed chronic kidney disease among potential residents of senior housing in the Primary Markets and differing levels of senior housing supply and utilization. Improving diagnosis of CKD would also enhance the health of residents and provide additional opportunities for income for operators. The number of people who have CKD is projected to grow in the coming years, meaning that product offerings focused on serving the needs of seniors with chronic kidney disease may have added future demand as well.

With the trends toward increasing dialysis at home, senior housing operators could consider adding opportunities for residents to receive dialysis at home in senior housing to offer additional convenience and potentially create an additional revenue stream. The Medicare beneficiary data as well as the supply and occupancy data sourced from NIC MAP Vision can help support analyses evaluating potential local demand for at home dialysis or other product offerings focused on serving seniors with CKD or ESRD.

For further information on CKD, a case study of an operator serving this market, additional findings from our analysis, well as the full caveats and limitations, please download our white paper. 

Sources

i CDC – Chronic Kidney Disease in the US 2021 – https://www.cdc.gov/kidneydisease/publications-resources/CKD-national-facts.html
ii United States Renal Data System, 2020 Annual Report; Transplantation (https://adr.usrds.org/2020/end-stage-renal-disease/6-transplantation)
iii Medicare, VisionLTC data, powered by NIC MAP Vision – https://visionltc.nicmapvision.com/

Skilled Nursing Occupancy Held its Ground During the Omicron Spike Despite High Caseload and Severe Staffing Challenges

Omicron within skilled nursing facilities accounted for about seven percent of U.S. fatalities, higher than the Delta but far below the Fall 2020 spike.

Omicron within skilled nursing facilities accounted for about seven percent of U.S. fatalities, higher than the Delta but far below the Fall 2020 spike.

While COVID-19 cases in the country and within skilled nursing facilities (SNFs) were very high during the Omicron surge in January 2022, data shows that fatalities among SNF residents remained significantly below the fall 2020 spike prior to the vaccine rollout.

The high caseload recorded in January 2022 exacerbated staffing shortages due to sickness-related absenteeism among SNF workers. However, SNF occupancy (based on CMS data) remained relatively stable compared with the sharp downturn during the fall 2020 spike prior to the vaccine rollout. This is mainly due to the fast retreat of Omicron, the reduced level of severe illness and fatalities, and pandemic preparedness among operators acquired from prior waves.

In this analysis, we provide a summary of the COVID-19 situation within SNFs and assess the impact of the Omicron spike on occupancy for skilled nursing facilities compared with the Delta and fall 2020 COVID-19 spikes. The analysis also showcases the noteworthy contribution and essential role of vaccines in mitigating the risk of severe illness and limiting fatalities among SNF residents.

Weekly COVID-19 cases in the country and within SNFs are currently dropping fast and at the same pace in which they peaked.

NIC’s Skilled Nursing COVID-19 Tracker, featuring CDC data as of February 13, 2022 (U.S. cases data) and CMS data as February 6, 2022 (SNF cases data), shows that COVID-19 cases in the country and within SNFs are falling fast and at the same pace in which they peaked. Weekly COVID-19 cases in the country fell by 80% from their January 16 peak of 5.58 million cases to 1.13 million cases on February 13 and are now near pre-Omicron levels.

Similarly, case counts within SNFs are falling sharply and following the same trajectory as weekly tallies in the country. New cases among SNF workers have fallen by 63% from their January 16 peak of nearly 68,000 to less than 23,000 cases on February 6. Over the same period, newly confirmed cases among residents have fallen by 55%, from about 48,000 cases on January 16 to less than 22,000 on February 6.

For the week ending February 6, 2022, per-resident rate of new COVID-19 infections dropped to 2% (about 200 in 10,000 residents tested positive), down 2.3 percentage points (pps) from its record high in mid-January 2022 of 4.3%.

Regionally, SNFs in the South region reported the highest per-resident rate of new COVID-19 infections at 2.75% (down 1.85pps from January 16), followed by the Midwest (1.71% – down 1.67pps from January 16), the West (1.53% – down 2.56pps from January 16), then the Northeast (1.35% – down 3.45pps from January 16).

Weekly COVID-19 fatalities among SNF residents falling and remained relatively low compared with the highest level seen during the fall 2020 spike.

At the height of the Omicron surge in January 2022, weekly COVID-19 cases among SNF residents set a new record at about 48,000 new cases, 45% above the peak recorded in December 2020 of about 33,000 new cases. However, weekly COVID-19 fatalities remained relatively low and far below the highest level seen back in fall 2020 prior to the vaccine rollout. In fact, weekly COVID-19 fatalities among residents during the Omicron surge peaked at about 1,500 on January 23, 2022, 75% less than the peak recorded on December 20, 2020 of nearly 6,000 new fatalities.

Per-resident rate of COVID-19 fatalities stood at 0.10% on February 6, down 3 basis points from its peak during the Omicron surge on January 23, 2022 and is now 44 basis points below the fall 2020 peak of 0.54% on December 20, 2020.

SNF Occupancy held its ground despite high caseload and severe staffing challenges.

The high COVID-19 caseload exacerbated staffing shortages among SNF workers in January 2022. The exhibit below shows that the declining case tallies within SNFs started to alleviate staffing shortages caused by sickness-related absenteeism among workers. Notably, the share of SNFs reporting staffing shortages among nursing staff, aides, and other staff took a downward trend following the sharp decline in case counts. For the week ending February 6, 2022, about 28.6% of SNFs reported shortages of aides, 26.7% reported shortages of nursing staff, and 17% reported shortages of other staff.

Interestingly, occupancy for SNFs (based on CMS data) held its ground and remained somewhat stable during both the Omicron and Delta spikes compared with the fall 2020 spike. During the Omicron spike, SNF occupancy fell by 0.7pps, from 72.4% on December 19, 2021 to 71.7% on January 23, 2022, then inched up 0.2pps to 71.9% on February 6, 2022. Similarly, SNF occupancy during the Delta spike fell by 0.3pps, from 71.9% on August 1, 2021 to 71.6% on September 12, 2021.

The fall 2020 spike weighed heavily on SNF occupancy. The exhibit below shows that occupancy dropped by 3.7pps, from 71% on October 11, 2020 to 67.3% on January 10, 2021 (the lowest level of occupancy since the onset of the pandemic). This was mainly due to a relatively long-lasting fall 2020 spike and the high level of fatalities in the early days of the pandemic prior to the vaccine rollout.

COVID-19 vaccines made an extraordinary contribution to mitigate the risk of severe illness and limit fatalities among SNF residents.

The analysis below shows that during the fall 2020 spike prior to widespread vaccinations among SNF residents, COVID-19 fatalities among SNF residents accounted for 30% of total fatalities in the country. over 52,000 SNF residents died over the period from the week ending October 11, 2020 to the week ending January 10, 2021.

During the Delta spike. As vaccines have been administered for most residents of skilled nursing facilities (as of August 1, 2021, 83% of residents had been fully vaccinated before the Delta took hold), fatalities among SNF residents as a share of total fatalities in the U.S. dropped to 4.7%, down over 25pps from the share recorded during the fall 2020 spike.

During the Omicron spike. At 7%, fatalities among SNF residents as a share of total fatalities in the country remained far below the share recorded during fall 2020 spike (30%), but 2.3pps higher than the share during the Delta spike (4.7%).

The COVID-19 stats below show that the Omicron spike has caused more fatalities among SNF residents than the Delta spike. This is partly due to the relatively high case counts and the lagging booster shots. As the Omicron variant took hold in December 2022, only 52% of fully vaccinated residents had received a booster, and only21% of staff.

Booster rates are increasing but still lagging. As of February 6, 2022, 60% of residents within SNFs had received a COVID-19 vaccine booster and roughly 30% of staff.

Exhibit - COVID-19 Blog

To gain in-depth insights and track vaccination coverage, U.S. weekly cases, and the week-over-week change rate for new resident cases and fatalities of COVID-19 within skilled nursing facilities at the state and county levels, visit NIC.org.

CCRC Care Segment Performance 4Q 2021

The following analysis examines current conditions and year-over-year changes in inventory, occupancy, and same-store asking rent growth.

The following analysis examines current conditions and year-over-year changes in inventory, occupancy, and same-store asking rent growth—by care segments within entrance fee CCRCs compared to rental CCRCs—to focus a lens on the relative performance of care segments within CCRCs during the fourth quarter of 2021. Overall CCRC occupancy by profit status and CCRC vs. non-CCRC occupancy differences by care segment will also be addressed. Note: this analysis was originally published by Ziegler Investment Banking, Senior Living Finance Z-News for the week of January 31, 2022.

NIC MAP® data, powered by NIC MAP Vision, collects primary data on occupancy, asking rents, demand, inventory, and construction for more than 15,000 independent living assisted living, memory care, skilled nursing, and continuing care retirement communities (CCRCs—also referred to as life plan communities) across 140 U.S. metropolitan markets. The dataset analyzed here includes 1,104 not-for-profit and for-profit entrance fee and rental CCRCs in the 99 combined Primary and Secondary Markets. 

4Q 2021 CCRC Market Fundamentals 

CCRC occupancy reached 85.7% in the fourth quarter of 2021 for the combined 99 Primary and Secondary Markets, 1.4 percentage points above its pandemic low in the first two quarters and 5.8 percentage points below its pre-pandemic occupancy rate in the first quarter of 2020. Currently, CCRC occupancy is equal to the level reached in the fourth quarter one year ago.  

In 4Q 2021, entrance fee CCRC occupancy (88.0%) was 6.3 percentage points higher than rental CCRCs (81.7%), and not-for-profit CCRC occupancy (87.1%) was 5.4 percentage points higher than for-profit CCRCs (81.7%). Rental CCRCs are currently 7.4 percentage points below their pre-pandemic occupancy levels, while entrance fee CCRCs are 4.9 percentage points lower. 

Picture1-1Picture2v2

CCRCs vs. Non-CCRCs: Care Segment Occupancy Difference 

The table below compares occupancy in CCRCs with non-CCRCs for each care segment in the Primary and Secondary Markets tracked by NIC MAP Vision. CCRCs outpaced non-CCRCs in each care segment. The difference in overall occupancy rates was highest for independent living units (7.8 percentage points) and lowest for nursing care units (2.7 percentage points) in 4Q 2021. 

Picture3

Entrance Fee CCRCs vs. Rental CCRCs by Care Segment 

Among the 1,104 CCRCs spread across the 99 Primary and Secondary Markets tracked by NIC MAP Vision, approximately 51% are operated as entrance fee CCRCs, and 49% are operated on a rental basis. Referenced in the NIC Investment Guide: Sixth Edition, most CCRC residents initially live in an independent living apartment. CCRCs serve a predominately single-female population, however, entrance fee CCRCs have a higher percentage of married couples (42%) than rental CCRCs (29%).  

The table below illustrates the relative market performance of entrance fee CCRCs compared to rental CCRCs by care segment in 4Q 2021 and includes year-over-year changes in occupancy, inventory, and asking rent growth. Note that CCRCs often offer both entrance fee and rental contracts to give residents financial choice and flexibility. NIC categorizes CCRC communities by the contract type the majority of residents have. 

Picture4

Entrance Fee CCRCs Have Higher Occupancy Rates and Stronger Rent Growth and Inventory Growth. By payment type, entrance fee CCRCs have higher 4Q 2021 occupancy rates than rental CCRCs for each care segment. The entrance fee CCRC independent living care segment had the highest 4Q 2021 occupancy (90.5%), followed by entrance fee CCRC assisted living and memory care (86.7% and 86.8%, respectively). The difference in 4Q 2021 occupancy between entrance fee CCRCs and rental CCRCs was the highest for the memory care segment (7.5 percentage points), followed by assisted living (6.0 percentage points), independent living (5.4 percentage points), and nursing care (1.6 percentage points). On a year-over-year basis, the nursing care segment had the most substantial change in occupancy (up 1.5 and 1.2 percentage points, respectively). 

As shown in the table below, entrance fee CCRCs are comprised of a greater proportion of independent living units. Independent living occupancy is higher than in the other care segments, explaining the more robust overall occupancy performance of entrance fee CCRCs. 

Picture5

CCRCs attract residents who are planners drawn to the continuum of care. However, entrance fee contract residents generally differ from rental contract residents in terms of higher net worth, lower age of entry, and longer tenure in the community. CCRC entrance fees (often similar to resident home sales values) typically subsidize a community’s monthly fees to some extent. Conventional wisdom would suggest that average rental CCRC monthly fee levels would therefore be higher. However, as shown in the table, in addition to higher occupancy rates—which tend to translate into community pricing power—any or all of these factors may help to explain the reasons why average entrance fee CCRC monthly fee levels are higher than rental CCRC monthly fees for each care segment.  

The highest year-over-year asking rent growth was in the entrance fee CCRC assisted living segment (4.4%), followed by nursing care (3.4%) and memory care (2.5%). Entrance fee and rental CCRC asking rent growth were similar in the independent living segment. Note these figures are for asking rates and do not consider any discounting that may be occurring.  

The number of units in a community differs significantly by payment model. Referenced in the NIC Investment Guide: Sixth Edition, the median size of entrance fee CCRCs is approximately 345 units, compared to 230 units for rental CCRCs. According to the NIC MAP Vision data, both entrance fee and rental CCRCs experienced negative year-over-year inventory growth in one or more care segments. Negative inventory growth can occur when units/beds that are temporarily or permanently taken offline or converted to another care segment outweigh added inventory.  

During the past four quarters, rental CCRCs reduced (or shifted) their inventory in each care segment except memory care. Entrance fee CCRCs increased their inventory in all but nursing care. Both entrance fee and rental CCRCs reduced nursing care inventory by -2.1% and -2.4%, year-over-year. Rental CCRCs had the highest reduction in their inventory for the assisted living care segment (-3.1%), while entrance fee CCRCs added 1.2% to their assisted living inventory. Entrance fee CCRCs added more memory care than rental CCRCs (2.4% vs. 1.1%). Rental CCRCs reduced (or shifted) more independent living than entrance fee CCRCs (-2.9% vs. 0.3%). 

Entrance Fee CCRC Occupancy is Highest in the Pacific Region. In 4Q 2021, the Pacific, Mid-Atlantic, and Northeast regions had the strongest CCRC occupancy rates ranging from 88.5% to 88.2%. The weakest CCRC occupancy was in the Southwest region at 80.8%. Considering payment type, as shown in the table below, entrance fee occupancy was highest in the Pacific region (90.9%), whereas rental occupancy was the highest in the Mid-Atlantic region (85.8%). The most significant difference between entrance fee and rental occupancy was reported for the Pacific region, where entrance fee CCRC occupancy was 7.1 percentage points higher than rental. Picture6

Look for future blog posts from NIC to delve deep into the performance of CCRCs. 

Are you interested in learning more? 

To learn more about NIC MAP® data, powered by NIC MAP Vision, and about accessing the data featured in this article, schedule a meeting with a product expert today. 

What Do Baby Boomers Want? How to Rethink the Idea of Community

Baby boomers may not be ready for assisted care, but they may be ready for something else. But what?

Baby boomers may not be ready for assisted care, but they may be ready for something else. But what? Do they want an active adult-type development with certain amenities? Or is it more about seeking a place that offers a sense of community and a personalized lifestyle?

Thought leaders in the fields of aging and longevity explored the question at the 2021 NIC Fall Conference in Houston during a session aptly titled: “Rethinking Community: Places that Will Attract Future Older Adults.”

For the most part, baby boomers are healthy and don’t feel old. They aren’t looking for the care-based housing model that they may have experienced vicariously through their parents. They’re not passive. Instead, they ask themselves, “How do I live my next chapter?” Baby boomers want choice, independence, and a place tailored to their preferences.

“The boomers are finally here,” said panel participant Bob Kramer, NIC co-founder & strategic advisor, and founder & fellow at Nexus Insights. “They are looking for places, activities, and programs to help them repurpose themselves to live with satisfaction and purpose.”

The discussion was led by Susan Barlow, co-founder, managing partner and COO at Blue Moon Capital Partners. Other panelists included Ryan Frederick, founder & CEO, SmartLiving 360; Jake Rothstein, founder & CEO, UpsideHōM; and Sara Zeff Geber, founder of LifeEncore.

2021_Fall_Boomer_600x300

Kicking off the session, Barlow asked: “What do baby boomers want?”

Kramer put the discussion in context, noting the huge growth in the number of baby boomers, those in the 65-84 age group. “The demographic wind is at our back,” he said. But instead of looking at demand in terms of age and income, he cited a study on rethinking demand in terms of life expectancy. While the industry mostly cares for people in the last five years of life, baby boomers are not yet customers for a care-driven product.

When rethinking demand, developers and investors should consider what consumers can afford. Baby boomers want health and longevity, but they also want to have the dollars to support themselves. They wonder if their lifespan will match their health span, and their wealth span. Kramer noted that NIC’s study on the “Forgotten Middle” shows that a large number of baby boomers will not be able to afford a traditional community.

Kramer emphasized that baby boomers want to avoid assisted living. Instead, they want experiences that make life worth living for the next, as he put it, “8,000 days.”

Panelist Geber observed that baby boomers seek a sense of community. Her work focuses on “solo agers”—those elders, mostly women, without children or those aging alone for other reasons. In fact, one in five baby boomers is childless. This group does well living alone because they’ve created a community or social network of friends and family for support. “They do not want to give that up,” said Geber.

Communities that offer opportunities to remain active and help provide a sense of purpose will attract these boomers. “Solo agers will need senior housing that appeals to the lives they live today,” she said.

Place Matters

Panelist Frederick emphasized that “active adult” is a product type, not a consumer. He authored a book titled, “Right Place, Right Time.” It looks not just at the physical dwelling space but also the individual’s neighborhood, wider community, financial security, physical and mental health, and sense of purpose. He suggested that developers and operators ask themselves: “Are you in the senior housing business, or are you in the business of creating places and services to help people thrive?”

Frederick cautioned senior living providers about the changing competitive landscape. Active adult projects for baby boomers are only a small sliver of housing options. There are multifamily, multi-generational projects. Co-housing arrangements can facilitate a sense of community. Pocket neighborhoods in walkable locations are another option.

Technology will play a role. UpsideHōM is a technology platform that connects people to housing and services that have been vetted by the company. “Technology can drive positive experiences,” said panelist Rothstein.

The UpsideHōM platform connects older adults to age-diverse apartment communities. The older adult is assigned a personal assistant or navigator to help manage day-to-day life and maintain community connections. Services are tailored to the individual. “No one size fits all,” said Rothstein. Seniors can get food delivered or transportation, but only if they want or need it. “Think about how to customize service and support,” he suggested.

What does this mean to the investor? Kramer noted that it’s crucial to understand the customer and take a wider view. The demand pool of baby boomers is broad, but thin for any particular type of development. Product categories will be highly segmented based on the personal preferences. “This is about the consumer and what they want,” said Kramer.

Moderator Barlow asked the panelists about market risks and what’s ahead.

2021_Fall_Boomer_Seated_600x300

Frederick noted that the world is more complicated, and people have more choices. “Housing for older adults will be a matter of trial and error,” he said.

Rothstein believes technology will be essential to create a meaningful end-user experience. “We have to be thoughtful about using technology to drive meaningful engagement,” he said.

Solo agers want to continue their lifestyle and may consider a congregate living arrangement if it is presented to them in a way that makes them feel comfortable. Small neighborhoods make more sense for them than big high-rise buildings.

The panelists agreed that the senior living market for baby boomers will be fragmented and diverse. Innovative approaches and new ways of thinking will be needed to meet the demand. “Huge change is coming to our industry,” said Kramer.

Considerations for a Successful Middle Market Product: A Strawman

A growing number of senior housing operators and capital providers are expressing interest in the “Forgotten Middle,” a term coined by NIC in 2019.

Introduction

A growing number of senior housing operators and capital providers are expressing interest in the “Forgotten Middle,” a term coined by NIC in 2019 in its seminal research to describe the large middle-income seniors cohort by its demographic characteristics as well as its housing and healthcare needs. The middle market includes Americans who have too much wealth to qualify for government support programs such as Medicaid, but not enough financial resources to pay most private pay options for very long. Identifying the right balance of hospitality, services, and care delivery, while still maintaining a monthly rental price that can be paid for by this group, is the cornerstone to a successful middle-market strategy.

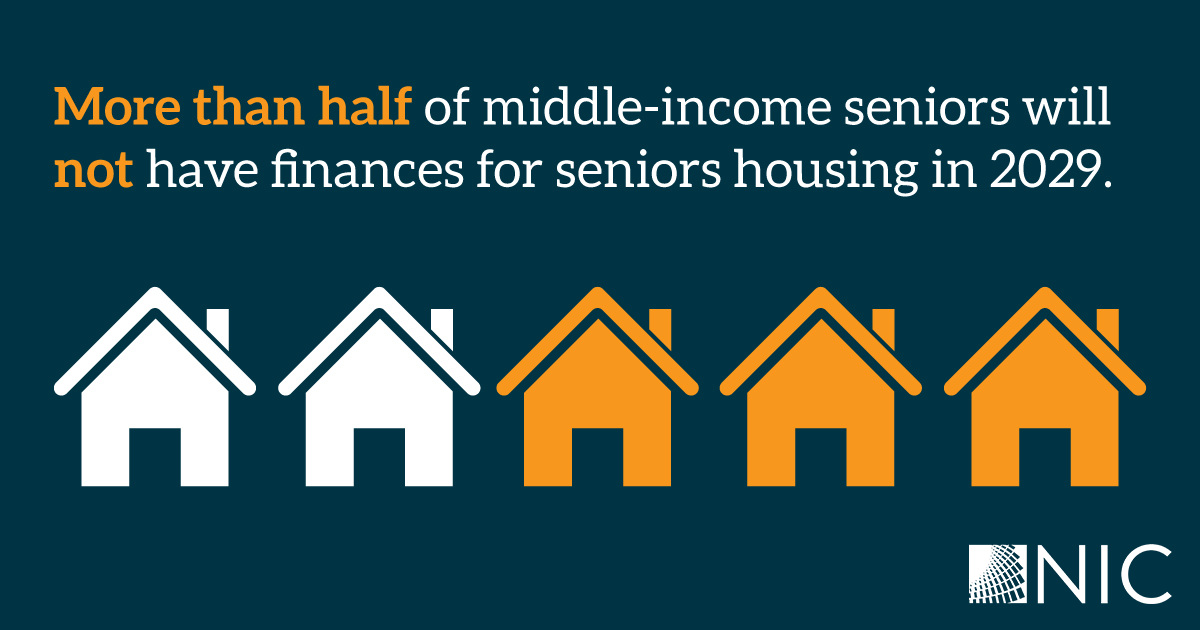
In 2014, there were 7.9 million seniors aged 75 or older who were in the middle-income cohort. By 2029, that number is projected to increase to 14.4 million. A variety of social and demographic trends are causing the size of this cohort to grow at a rapid and steady pace. Foremost is the aging of the baby boomers who are turning 75 every day (baby boomers were born between 1946 and 1964 and as this cohort ages, the middle-income senior population will nearly double). By 2029, middle-income seniors will make up 43% of all seniors. These trends will only grow over the next 20 years since the oldest baby boomer is 83 in 2029. Further, a shift away from pensions and defined benefit plans, an increasing likelihood of being unmarried, and fewer available family caregivers are other key factors influencing this cohort. More than half of this cohort are projected to not have the financial resources to pay for traditional average-priced seniors housing and care in 2029.

NIC_MiddleMarketInfographic

Looking at the health characteristics of the projected cohort of 14.4 million middle-income seniors, it becomes clear that a significant portion of this group will require care as they age that may present challenges to living at home. Roughly 8% of this group will have some form of cognitive impairment, 60% will have mobility limitations, and 20% will have high needs – defined as having three or more chronic conditions and one or more functional limitation.

Further, it is likely that the COVID-19 pandemic has increased the size of this cohort, supporting additional consumer interest in moderately-priced senior housing options. To be viable, however, operators and their capital partners need to think through a variety of considerations in formulating a middle-market strategy. What follows are some key factors to consider for operators and capital providers interested in serving the middle-market segment that NIC has gleaned from conversations in the years since the study’s publication. Please note that this is intended only to serve as the groundwork for further discussion and is not intended to be a comprehensive list of all factors affecting middle-market senior housing.

Key Factors When Considering a Middle Market Strategy

Understand Your Consumer

The most important first step to consider in providing care and housing to the “Forgotten Middle” is to understand the resident that is likely to live in the property. Focus groups have revealed that middle-market consumers are not that interested in high-end services, such as luxury amenity spaces, elegant meals, and customized services. The middle-market consumer desires value, peace of mind, and independence. This suggests a host of considerations that may differ from higher-end senior housing and care. This group does not automatically want to pay for weekly housekeeping, dining room servers, and full-time fitness instructors. This may also mean that there are fewer high-end finishes such as granite countertops and less robust food menus. This is a group of seniors who are used to parking their own cars and carrying their own bags.

Marketing and sales teams should take the approach of marketing the value proposition of senior housing. This includes safety, security, socialization, engagement, room and board, care coordination and lifestyle.

Expense Item Scrutiny and Unbundling to Offer à la Carte Services

Powerful business intelligence (BI) tools have enabled a new approach to senior living pricing. These new pricing approaches are key for middle-market operators looking to understand how frequently certain services are rendered and how delivering those services impact the time and effort of a labor force.

For example, for communities that are positioned within walking distance to shops and restaurants, or near public transportation, it may not make financial sense to continue operating a shuttle that gets little use. The cost of gas, vehicle maintenance, insurance, and the driver’s time may be more effectively used elsewhere, or even to simply reduce the monthly rent. Moreover, the common and easy use of Uber or other on-demand transportation services may make transportation less necessary.

More broadly, à la carte services in general are likely more appealing to the middle-income cohort, where they can choose the frequency or apartment cleaning, meal plans and other services.

Maintain a Universal Workforce & Utilize Volunteers

The single biggest line-item expense for senior housing operators is labor, and it is also most often the real cost that drives up monthly fees for consumers. Unfortunately, the COVID-19 pandemic only exacerbated the labor challenge and brought with it a wave of higher labor costs.

For middle-market operators in particular, labor cost management is a crucial tenet to maintaining affordability. Some operators may find success by not having workers focus on one singular task or rather use the so-called universal worker. The workforce potentially needs to be managed in such a way that allows them to shift to where the needs are greatest. Gone are the days of a dedicated front desk or reception area employee. No longer can employees be dedicated as drivers only.

The labor force for middle-market operators needs to be agile, flexible, and able to repurpose themselves to where the demands are – whether that be making rounds, answering phones, delivering meals, or leading a class. Workers need to be cross-trained to perform multiple duties.

Volunteerism is another concept for middle-market operators to embrace. Some operators have found success in reducing staffing and overhead costs by having residents volunteer as a requirement of residence. Volunteering can be a way for residents to maintain engagement. Oftentimes, residents will be able to volunteer doing something that they love – assisting in the library, running the book clubs, or tending to the gardens and landscaping. Not only does resident volunteerism reduce the operating costs, but it provides residents another avenue for both purpose and socialization. In fact, volunteer requirements in some communities can even be seen as an attraction to residents.

Utilize Partnerships for Low-Cost Support Services

Location and proximity to restaurants, cafes, shopping, theatres, and entertainment can create a range of no-cost support services for the middle-market consumer, ranging from dining to socialization. Partnerships with dining establishments can serve as a win-win situation for both restauranteurs and operators alike. If operators can guarantee a minimum, predetermined order amount, restaurant owners may be willing to offer discounted meals to residents. A partnership in this sense, at the very least, reduces the need for cafeteria labor and potentially the build-out of a full commercial kitchen. With the right dining partnerships, perhaps the need for an on-premises dining option is eliminated altogether.

When it comes to delivering home care services, middle-market operators can work closely with a home care agency which can assign a few dedicated staff persons who can share care responsibilities among many different residents. In this way, care can be delivered to residents where they reside, and it can be affordable to residents because they are only paying for the services that they need. These services do not have to be paid for or subsidized by the operator, which would thereby lower operating costs. But an operator can ensure that a resident gets care by partnering with a home care agency who specializes in best-in-class care provision.

There are also acuity limitations that need to be considered when filling a unit. Consider some of the frailer or less healthy middle-income seniors. When thinking about what a higher-acuity, middle-income senior is going to require, it becomes clear that a community cannot provide all the supports and services that are needed and continue to remain affordable. As such, clear guidelines may be needed to set limits on what type of resident can be served in the community. Residents with multiple comorbidities, ambulatory challenges, or those requiring assistance with one or more activities of daily living (ADL) may not appropriate for middle-market property needing to maintain costs at an affordable level.

New Development, Repurposed Building, or Distressed Asset Acquisition?

It may not be possible to build new construction and still meet the needed price-point for the middle-market given the costs of entitlement, land values and pandemic-related surge in materials and soft costs. Keeping acquisition or development costs and related debt low is key to achieving success in the middle-market arena. Purchasing distressed assets – senior housing properties facing bankruptcy due to low occupancy rates or alternative property types such as motels, shopping centers, and offices could potentially reduce the cost basis.

For situations where development may pencil out, a strategy of developing multiple sites and replicating a building model and design that has been shown to work may be cost-effective. Incorporating middle-market buildings into existing communities can be done by converting existing, often older, units to more affordable options. Moderately priced buildings may need to be designed or retrofitted differently and not include elaborate common spaces. Providing smaller units or having double occupancy with higher density may also lower the price-point for middle-market seniors.

Indeed, the concept of roommates sharing quarters in senior housing had been trending in the years leading up to the COVID-19 pandemic. This trend allowed for more affordable senior living through cost sharing. Unfortunately, the practicality of offering housing in such a way could now be more problematic, with the emphasis on infection control and contagion prevention.

Operators and capital providers will also want to pay close attention to market demographics when choosing to develop a middle-market property. Areas with a high concentration of seniors with annual incomes of less than $75,000 a year may generate the most demand. It is also important to remember, however, that incomes can vary widely between different market areas and as such, so too should rental rates that target middle-market seniors.

When looking to identify the most appropriate market, another factor to consider may also be Medicaid assisted living waivers that are available in select states. According to the Medicaid and CHIP Payment and Access Commission, 29 states use Medicaid Home- and Community-Based (HCBS) waivers to cover services in residential care settings. In some states, assisted living is specifically identified as being covered by Medicaid, while in others assisted living services are only covered for individuals with certain health conditions, such as Alzheimer’s Disease or related dementia.

Ryan_Brooks_Fall_Conf_Middle_Market_1024x528
Conclusion

Because of the increasing demand, targeting the middle-market can be a successful strategy for senior housing operators and investors. But when beginning the middle-market journey, it is vital to remember that throughout each stage, the goal is to make the project more economical to build and operate. This process begins with design and construction but must remain consistent through the planning of amenities and services as well. There are of course other aspects to consider – like how to effectively finance these developments – but this article is intended to serve as a starting point for discussion on how to move from theory to reality in the middle-market senior housing sector, by outlining the key considerations that have been identified through our ongoing conversations related to the “Forgotten Middle.”

Available Resources: