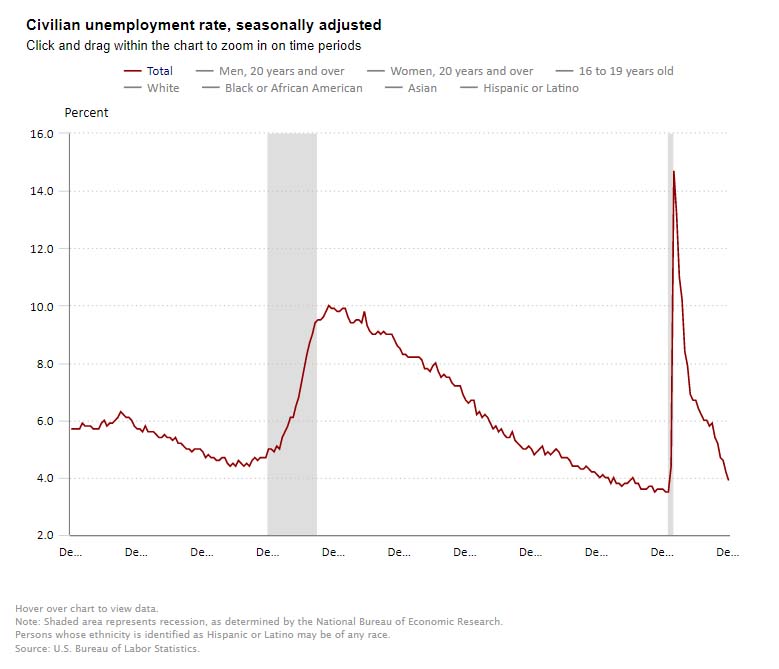
The Labor Department reported that the jobless rate fell 0.3 percentage point to 3.9% in December, down 2.8 percentage points from year-earlier levels.
The Labor Department reported that the jobless rate fell 0.3 percentage point to 3.9% in December, down 2.8 percentage points from year-earlier levels. The jobless rate is now 0.4 percentage points above the pre-pandemic level of 3.5% seen in February 2020, and well below the 14.7% peak seen in April 2020.
The supply of labor as measured by the labor force rose by 168,000 in December, while household measure of employment rose by more than 651,000 in December. These factors pushed the jobless rate lower to 3.9%. This rate is below the Fed’s estimate of its longer-term unemployment equilibrium level.
Concerns about rising wage costs are supported by this report. Average hourly earnings for all employees on private nonfarm payrolls rose by $0.19 in December to $31.31, a gain of 4.7% from a year earlier.
The household survey data supports the Fed’s view that the labor market is at or close to maximum employment and will provide further evidence that a shift in monetary policy away from being accommodative to a more restrictive stance is appropriate. Indeed, at its most recent and final meeting of the year in December, the Fed changed course sharply as it shifted away from dovish policies of low interest rates and Quantitative Easing (QE) to support overall growth to one that is more hawkish to deliberately fight inflation by slowing its monthly bond buying program and raising interest rates. Reflecting this new tone, it is likely that the Fed will raise short-term interest rates in 2022, possibly three times and further in 2023. The Fed’s bond buying program will also “taper” much more quickly than initially announced, meaning that purchases could now end in February 2022 or sooner, thereby doing less to stimulate the economy which would theoretically and eventually slow price gains as demand wanes. The exact timing depends upon when officials judge the labor market is back at “maximum employment,” with Fed Chair Jerome Powell arguing that the economy has made “rapid progress” towards that goal. The December jobs report will add evidence that this goal has been achieved or is very close to being achieved.
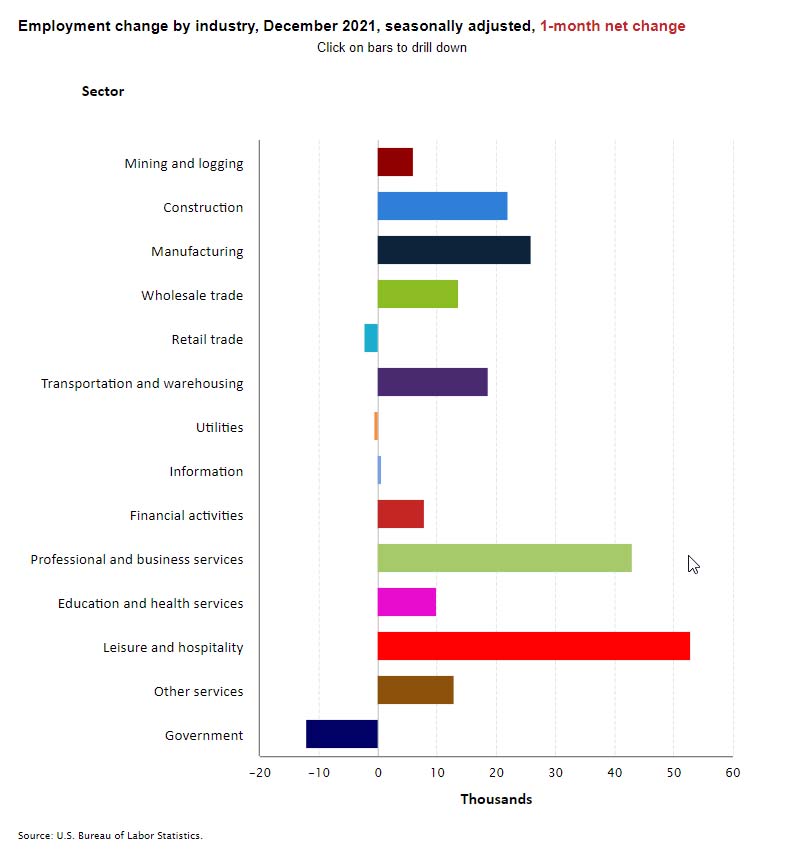
Separately and from a different survey, the Labor Department reported that nonfarm payrolls rose by 199,000 in December 2021. The consensus had been for an increase of 447,000. This was a sharp slowdown from October when jobs increased by 648,000 (originally reported as 546,000) and from November when jobs grew by an upwardly revised 249,000 (originally reported as 210,000). On average, job growth averaged 537,000 in 2021. Nonfarm payrolls have now increased by 18.8 million since their pandemic trough in April 2020 but are still down by 3.6 million or 2.3% from their pre-pandemic level in February 2020.
The potential negative impact of the newly identified omicron variant on jobs is likely not reflected in the December data because the survey week occurred prior to the big surge in omicron-linked cases. But the data show that the labor market continues to be affected by the delta variant especially in the service sector. Indeed, leisure and hospitality payrolls edged up by a muted 54,000, following large gains of 200,000 per month earlier in the year.
Health care lost 3,100 jobs in December. And within health care, nursing and residential care facilities lost 6,100 jobs. Losses were offset by gains in residential mental health facilities. Jobs have been on the decline in nursing care since 2011.
The underemployment rate or the U-6 jobless rate was 7.3%, down from 7.7% in November 2021. This figure includes those who have quit looking for a job because they are discouraged about their prospects and people working part-time but desiring a full work week.
The labor force participation rate was unchanged at 61.9% in December but remains 1.5 percentage points lower than in February 2020. The employment to population ratio increased by 0.1 percentage point to 59.5% in December but is 1.7 percentage points below its February 2020 level.
3Q2021 NIC Analytics Demand Pulse Metric
Third quarter 2021 NIC MAP® data showed the largest improvement in demand in a single quarter since NIC MAP® began to report the data in 2005.
This blog features the NIC Analytics Demand Pulse Metric (DPM) for third quarter 2021 (3Q2021), a measure that examines senior housing demand (occupied units) for the NIC MAP® 31 Primary Markets and provides a window into the strength of a market based on occupied stock trends. The demand pulse metric pinpoints when 3Q2021 demand levels were last seen before the pandemic began to influence the senior housing sector in 1Q2020 and tracks demand growth and progress across the 31 Primary Markets.
Aggregate Market Demand Pulse
Third quarter 2021 NIC MAP® data, powered by NIC MAP Vision, showed the largest improvement in demand in a single quarter since NIC MAP® began to report the data in 2005. For the 31 Primary Markets, 12,318 units were absorbed on a net basis, a 2.3% increase from the prior quarter. This pushed occupied units back to their 2Q2018 level. Said another way, it was 1.75 years (7 quarters) ago – counting back from pre-pandemic 1Q2020 levels – that occupied units equaled the level achieved in 3Q2021. Prior to the 3Q2021 jump in net absorption, occupied units had only recovered to their 2Q2017 levels (2.75 years or 11 quarters, counting back from pre-pandemic 1Q2020 levels). And while a very welcomed improvement, 3Q2021 occupied stock was still 4.7% below pre-pandemic 1Q2020 levels.
The DPM Exhibit below provides a visual of these metrics for the Primary Markets as well as the individual metropolitan markets that comprise the aggregate measure.
Market-Specific Demand Pulse
Based on the positive momentum in net absorption patterns in 3Q2021, the level of occupied units in both Washington, D.C. and Kansas City had returned to 1Q2020 pre-pandemic levels. In fact, the level of occupied units in Washington exceeded pre-pandemic levels by 0.9%, while demand in Kansas City was near 1Q2020 levels and fell short by only 55 units, equivalent to a gap of merely 0.4% compared with 1Q2020 levels.
There were 10 markets where occupied units in 3Q2021 were at levels seen as recently as one year ago or less compared with 1Q2020 levels. This includes Atlanta (3Q2021 demand was the same as in 4Q2019 and remains 1.9% below 1Q2020 levels), Orlando (same as 3Q2019); Minneapolis, Sacramento, Cleveland, Houston and Las Vegas (same as 2Q2019); Dallas, Phoenix and Denver (same as 1Q2019).
Despite the recent improvements in demand across all the 31 Primary Markets, the level of occupied units in 3Q 2021 remains far below 1Q2020 levels. This is the case for Pittsburgh, where the number of occupied units remains below levels reported since at least 2005, when NIC began reporting data. Similarly, the number of occupied units in Los Angeles remains below 1Q2020 levels by almost 10 years and is now at levels seen in 2Q2010, and San Jose remains eight years below 1Q2020 levels and is now at levels seen in 4Q2011. Notably, 3Q2021 demand relative to 1Q2020 levels in Los Angeles stood at negative 9.6%, while 3Q2021 demand in San Jose and Pittsburgh remains 7.0% and 6.9% below 1Q2020 levels, respectively.
This analysis suggests that factors that influence demand are stronger in some markets than in others and that there will be some markets that will return to pre-pandemic demand levels sooner while others will take longer. Separately, and not surprisingly, a recent analysis by NIC Analytics looked at the share of same-store properties within individual metropolitan markets that had reached their pre-pandemic occupied unit levels and found that the demand recovery paths and timelines for properties also varied significantly. Hence as property performance goes, so goes broader metropolitan area performance.
In summary, positive senior housing demand momentum was evident in both the 2Q2021 and 3Q2021 NIC MAP® data after four consecutive quarters of pandemic-related weak demand. The upcoming 4Q2021 NIC MAP® Quarterly Data Release on January 6, 2022, will showcase if the demand recovery continued to expand or slowed down, and which other markets have fully returned to pre-pandemic 1Q2020 demand levels and which ones continued to lag.
Recovery in Senior Housing Demand Uneven Across Markets and Properties
Senior housing properties have all experienced wide-ranging pandemic-related challenges, but the demand contraction has differed across markets.
Since the start of the pandemic, senior housing properties have all experienced wide-ranging pandemic-related challenges, but the depth of the demand contraction has differed across markets.
As senior housing demand began to recover in the second quarter of 2021 and registered its strongest increase the following quarter (3Q2021), NIC MAP® data, powered by NIC MAP Vision, shows that certain markets are recovering quickly, while others continue to lag. Due to the skewed pandemic impact the sector has experienced, the demand recovery paths and timelines are proving to be uneven across both markets and properties.
Methodology
In this analysis, we examine senior housing demand recovery across the 31 NIC MAP Primary Markets by looking at the share of “same-store” properties where pre-pandemic occupied unit levels have been achieved. Same store is defined as properties that have been open and reporting data at least since 3Q2019, three full quarters before the pandemic began to influence the senior housing sector. Within the 31 NIC MAP Primary Markets aggregate, we identified 4,863 same-store senior housing properties.
This analysis is based purely on demand, as defined by changes in net absorption or occupied units and does not take supply conditions within the same-store properties into account. Additionally, closed and newly opened properties since 3Q2019 have been excluded from this analysis.
The concept of demand or the number of occupied units is critically important to evaluate senior housing markets’ recovery. Occupancy rates are a broader concept and take into account new supply or newly opened units in the last 18 months, in addition to the upcoming inventory currently under construction.
Senior Housing Demand Recovery
Exhibit 1 below shows that 1Q2020 pre-pandemic occupied unit levels have been achieved or surpassed in nearly one-third (31.3% – equivalent to 1,521 properties) of same-store properties within the NIC MAP Primary Markets aggregate. In fact, occupied units within this cohort grew by about 14,100 units between the first quarter of 2020 and the third quarter of 2021, equivalent to 10.6% of pre-pandemic occupied stock. Further, the occupied stock in this cohort as a share of overall demand within the 4,863 properties identified in this analysis went from 24% in 1Q2020 to 29% in 3Q2021, up five percentage points.
By contrast, the number of occupied units within roughly two-thirds of properties (68.7%) in 3Q2021 remained substantially below pre-pandemic 1Q2020 levels, with 51,000 units still placed back in the market, equivalent to 12.3% of pre-pandemic occupied stock. Additionally, the occupied stock in this cohort as a share of overall demand went from 76% in 1Q2020 to 71% in 3Q2021, down five percentage points.
The COVID-19 pandemic recovery has been uneven between markets and properties. If we were to graph this recovery, we would get a shape that resembles a “K,” with an increase in the share of occupied stock across properties that have already achieved or surpassed pre-pandemic occupied unit levels, and a decrease in the share of occupied stock across properties where demand remains below pre-pandemic levels.
Exhibit 1: Share of Same Store Properties Where Pre-Pandemic Occupied Unit Levels Have Been Achieved
Market-Specific Demand Recovery
Drilling deeper into select metropolitan markets within the NIC MAP Primary Markets, Houston and Las Vegas had the largest share of same store properties where 3Q2021 occupied units have returned to the same level or exceeded 1Q2020 pre-pandemic occupied unit levels at 43.6% and 42.9%, respectively, while San Jose had the smallest share among the 31 Primary Markets at 13.3%. Notably, San Jose is a bit of an anomaly. It is one of the very few markets that has experienced negative inventory growth associated with units being pulled off the market throughout the pandemic, and some of these units were occupied in 1Q2020.
Overall, pre-pandemic occupied units across 14 of the 31 Primary Markets have been achieved or surpassed in at least 30% of the same store properties within each market, some of these markets include Washington (39.1%), Dallas (39.1%), Detroit (31.7%), and Boston (31.4%). Other than San Jose, the lowest shares of same-store properties where pre-pandemic occupied units have been achieved or surpassed were seen in Sacramento (23.1%), Miami (24.8%), and Los Angeles (25.0%).
Aggregate Market Demand Growth
Exhibit 2 below provides another way to look at demand growth, comparing the share of same store properties reporting an increase, decrease, or no change in occupied units (quarter-to-quarter) since 3Q2019. Notably, the market’s initial contraction was identified in the second quarter of 2020, and developed over subsequent quarters, through the first quarter of 2021. As demand improved in the second quarter of 2021, seniors housing properties began to see promising signs of improvement. This has translated to increases in demand within 46% of same store seniors housing properties within the aggregated 31 NIC MAP Primary Markets.
In the third quarter of 2021, the share of properties reporting an increase in occupied units rose by six percentage points to 53% as demand improved and registered its strongest increase in the number of occupied units since NIC MAP began reporting the data back in 2005. At the same time, 20% of properties reported no change in the number of occupied units from the second quarter of 2021, and 27% of properties reported a decrease in occupied units over the same period, down eight percentage points from the second quarter of 2021. This was the smallest share recorded throughout the pandemic.
While the majority of same store senior housing properties (53%) experienced an increase in demand in the third quarter of 2021, with 16,600 occupied units absorbed in one quarter, demand continued to trend downward across 27% of properties, with 8300 units lost or placed back in the market, half of the units absorbed by those properties reporting an increase in demand.
The key takeaway from this analysis is that the path to recovery looks different at the property level and will be influenced by how resilient properties were in 2020 and the first half of 2021. If we look at the second quarter of 2020, while the majority of senior housing properties experienced a dramatic decrease in occupied units (20,800 occupied units lost in one quarter), 22% of properties did relatively better and even experienced an increase in occupied units with 5,600 units absorbed at the height of the pandemic.
Exhibit 2: Share of Same Store Properties by Demand Growth (Quarter-to-Quarter)
As the recovery in senior housing continues and as the industry continues to navigate its way through the pandemic, there are likely to be further twist and turns, and ups and down, but the sector has proven itself to be agile and resilient and will bounce back. That said, and as this analysis has shown, the recovery paths and timelines of demand may differ from one market to another, and from one property to another.
Interested in learning more about NIC MAP® data? To learn more about NIC MAP data, powered by NIC MAP Vision, schedule a meeting with a product expert today.
SafelyYou Leverages AI to Reduce Falls & Costs: A Conversation with Tom Bang
Falls are a constant worry and costly problem for senior living owners and operators. The solution could include artificial intelligence (AI).
Falls are a constant worry and costly problem for senior living owners and operators. The solution could be better fall management with artificial intelligence (AI). San Francisco-based SafelyYou has developed an AI-enabled fall management program to detect and prevent falls. The SafelyYou system has already been installed in more than 100 communities, with the backing of REITs, insurers, and healthcare payors.
NIC Senior Principal, Healthcare Strategy, Ryan Brooks recently talked with SafelyYou Chief Strategy Officer Tom Bang about how the program works and the results. Here is a recap of their conversation.
Brooks: Can you tell me a bit about SafelyYou and how it differs from other products in the fall prevention and management space?
Bang: We’re using some of the most advanced artificial intelligence (AI) to address the industry’s most persistent risk challenges, beginning with falls. The financial and emotional costs are enormous.
We’re the first and only fall prevention and mitigation technology-enabled solution that’s been proven, as published and peer-reviewed, to reduce falls by 40% and emergency department visits resulting from falls by 80%. Notably, given these outcomes, we’re also the only solution paid for in part by REITS, liability insurers, and most recently, healthcare payors.
We’re changing the long-standing perception that falls can’t be avoided and must be accepted by providers, residents, and families. Communities and facilities using SafelyYou are winning move-ins, doubling length-of-stay, empowering staff, increasing staff efficiency while reducing risks and liabilities. Few solutions address so many of the needs of today’s operators.
Brooks: When was the company formed?
Bang: The company was launched in 2017 by George Netscher based on his research at the UC Berkeley Artificial Intelligence Research Lab. His family had a history of dementia, and he wanted to create a system with AI to help them.
Brooks: How big is the company?
Bang: We have more than 50 employees. We closed our Series A funding 120 days ago. In the third quarter of 2021, Omega Healthcare Investors led our Series B funding. The SafelyYou system will be installed in Omega facilities. We work with several operators and owners across more than 100 communities.
Brooks: What is your role?
Bang: As chief strategy officer, I’m focused on the ecosystem of REITs, insurers, payors, and all those entities that expect a return from the technology.
I’ve led several senior, and acute care technology providers, including It’s Never 2 Late, a person-centered engagement tool. I consulted with George Netscher, and after 60 days, I approached him and said I want to work for you. SafelyYou addresses the operator’s most pressing needs: occupancy, length-of-stay, staff efficiency, staff empowerment, and the ability to reduce risk and liabilities. As an operator, those are the things you worry about. We are mitigating falls, but the impact that falls have across the community places a substantial value on what we offer.
Brooks: Can you explain how the system works?
Bang: In the typical memory care/assisted living setting, we know that 94% of falls go unwitnessed. We could have put cameras in the residents’ rooms a decade ago to assess their capabilities and make appropriate changes. But we can’t do that from the standpoint of privacy compliance. With the advent of AI, machine learning enables a camera in the room to determine when a human being is on the floor. The video from the camera is deleted by the machine when the resident is not on the floor. But when a person is on the floor, the machine saves the previous 10 minutes of video. In that 10-minute vignette, the staff can see what happened and determine if the person might be injured. We know that 40% of the time, individuals who are not fully ambulatory are self-lowering, putting themselves on the floor. They may want to get to the bathroom or reach something across the room. They might be getting on the floor to exercise or pray. But as an operator, the only way you know how to treat the incident from a liability standpoint is to presume the person has fallen.
Brooks: What happens when the system detects someone on the floor?
Bang: As soon as the technology detects someone on the floor, the SafelyYou team receives an alert. They are available 24/7. They validate that someone is on the floor, and the community is alerted immediately. Other alert systems generate a lot of false positives, creating noise fatigue among the staff. Our system identifies someone on the floor with 99.7% accuracy. When staff gets an alert from SafelyYou, they know it’s the real thing, not noise. Someone is on the floor or was on the floor. We also now know that 17-20% of residents self-recover. The staff can view the video and see whether the resident is ok. They will still examine the resident, but the staff knows what happened and can determine the seriousness of the fall from the video review. If the person is uninjured, a trip to the emergency room is avoided.
Brooks: Since you are using a camera, are there still privacy concerns?
Bang: Both leading operator defense attorneys and liability insurance have embraced our unique solution. And state regulatory agencies also support what we’re doing. Some in fact have stated that our solution should be available in all communities. The only videos that exist are those where the machine detected an on-the-floor event. And those videos are only accessible by the operator’s approved staff. And of course, our solution is HIPPA compliant.
All residents and families are given a choice to opt-in. And our customers enjoy a 90% opt-in rate. We conduct educational sessions with residents and families. About 60-70% of families initially opt-in. But once other families see that they’re not getting calls at 3 a.m. or having to pay for emergency medical services (EMS), the opt-in rate increases.
Brooks: Does the system have other advantages?
Bang: Yes, the staff can see what may have caused the fall. We provide a weekly or bi-weekly fall huddle with a physical or occupational therapist to determine what changes can be made to the environment to make it safer and help prevent future falls.
Brooks: In the senior housing and care industry, there is tremendous concern about labor shortages and workforce retention. In what ways does partnering with SafelyYou impact frontline staff? Does it make their job easier?
Bang: Yes, our customers tell us that we make the staff’s jobs easier, freeing them for other resident care while reducing emotional strain. Our customers also say the staff feels empowered. For the first time, the caregiver can now tell families not only how someone fell but also how their loved one’s falls will be mitigated going forward. Provider magazine recently published a piece showing that an empowered staff is key to retention.
Remember, 94% of all falls go unwitnessed when not using SafelyYou. And with our technology, we now know that over 40% of the time, someone’s mother, father, or loved who was found on the floor didn’t fall but self-lowered themselves.
Knowing that significantly reduces family concerns, emotional stress, and operator liability. There is also a dramatic efficiency gain for caregivers, first simply by reducing the number of falls but also by reducing reporting and the need for neurological checks in a skilled nursing setting. Think through that a minute. Out of 100 previous fall events, 40 of those are routinely mislabeled as falls! That’s a considerable staff burden and liability exposure, all due to mislabeled events in which operators were unknowingly putting themselves and their businesses in harm’s way.
Brooks: What types of properties is SafelyYou found in?
Bang: Though we began our go-to-market efforts in memory care, which remains our largest footprint, SafelyYou is being deployed in assisted living and skilled nursing settings at an increasing rate. After just a few years of commercialization, we’re now installed in more than 100 communities and facilities, with many of the industry’s leaders.
Brooks: How many units is SafelyYou currently monitoring?
Bang: We see 2,000 falls per month and have evaluated over 25,000 falls in total across our install base. As such, we are unequivocally the leading fall expert. Our occupational and physical therapists staff review all fall events and share their insight and expertise with our customers. We also conduct free monthly webinars, our National Fall Huddles, for the market at large.
Brooks: Falls are a significant concern in senior care facilities and can become significant liability issues. What impact does partnering with SafelyYou have on an operator’s liability?
Bang: Industry legal experts have advised that our 40% reduction in falls leads to a 20% decrease in liability claims. As a result, Church Mutual Insurance now subsidizes our technology for their customers. Further, our customers tell us they’re now armed for the first time with factual information—our videos and data—to reduce false narratives which they previously had no way of disputing.
For example, residents may tell their families they were on the floor for hours, but their loved ones received care from staff members within minutes. Or when a resident is admitted to the emergency room and the attending physician records that the injury is more likely from abuse than a fall, our video detection shows the injury was from a fall and not abuse.
We reduce claims for insurance carriers. We reduce unnecessary defensive medical claims for payors. And we enhance and protect the investments of owners. Exposure and liability are reduced across the ecosystem for operators and their sponsors.
Brooks: Does SafelyYou provide any training directly to staff to aid in their fall prevention abilities?
Bang: Yes, we provide initial training as part of our implementation. We then meet weekly or bi-weekly with our customers to review their falls and enhance their training. As I mentioned, we offer monthly webinars to the broader market to share what we are learning.
And finally, we’ve created SafelyYou University, a free video educational program available to all. It’s the first such program of its kind that combines dementia awareness training and fall prevention education.
Brooks: Activating a SafelyYou system can prevent unnecessary emergency department (ED) utilization, avoiding not only stress and anxiety but saving on out-of-pocket costs as well. Has SafelyYou quantified the cost savings to an average resident?
Bang: Yes, residents/patients and their families see direct out-of-pocket co-pay expense reduction from reduced EMS and emergency department visits. Our operators successfully use that to win competitive move-ins and gain some price elasticity.
But we haven’t stopped there! We’ve just finished our first claims analysis across one CMS region. The reduction in EMS and ED visits, and other direct medical claims, is estimated to produce a medical claims savings of over $7,000 per Medicare participant. All payors will benefit, including those sponsoring Medicare Advantage (MA) and Institutional Special Needs Plans (I-SNPs).
Brooks: What impact does activating a SafelyYou system have regarding resident length-of-stay?
Bang: Our customers have seen a two-fold increase in length-of-stay over several two-year studies. These customers experienced a four-fold increase in length-of-stay in the first 90 days in the same studies. Length-of-stay increases can have a significant impact on an operator’s profitability.
Brooks: Can you tell me about SafelyYou’s Fall Technology Grant Program?
Bang: We’ve been very proactive in addressing current market challenges for communities and facilities alike. The most critical concern right now is staffing, and SafelyYou eases the burden on care staff. Our grants are a way to support residents, staff, and fall management goals. Each grant covers the cost of implementation of SafelyYou and also includes a complete assessment of the current fall management program from our fall experts. In addition, we’ve also created “active camera pricing,” which selectively allows customers to enjoy significant discounts and to pay as their business improves with increased occupancy and resident participation, in part driven by SafelyYou.
Bang: Yes, as mentioned, we’ve partnered with many entities including, REITs, insurers, payors, and Direct Supply, to address this pervasive industry challenge. Many environmental factors create person-centered fall risks. Through our videos, staff better understand these factors, including the best use of mobility aids. Direct Supply is one of our great partners, committed to reducing falls to improve quality of care and reduce costs by advocating for enhanced services that our operators can now provide to their residents, patients and families.
Monthly NIC Intra-Quarterly Snapshot Tracks Agility and Evolution
From March through May, the headlines reflect cautious optimism of stabilization, which then begins to take hold in June 2021, as demand improved.
A Pandmeic Initiative
In spring 2020, responding to the onset of the COVID-19 pandemic, NIC launched numerous initiatives to help senior living leaders understand and improve their responses to the crisis. Given the pace of change impacting the industry, NIC began to produce a high volume of relevant and timely data and analysis more frequently than ever before. In just a few months, NIC produced an entire suite of resources aimed at improving access to data and analysis relevant to the impact of COVID-19 on the senior housing and care industry. Part of that effort was to release the NIC Intra-Quarterly Snapshot reports, which, like several other pandemic-related NIC initiatives, is still being produced today.
Each monthly report, based on three-month rolling data from NIC affiliate NIC MAP Vision, provides the most timely comprehensive review of the sector’s market fundamentals and trends. In addition, the report provides economic trends, inventory growth data, and occupancy rates, with analysis and insights from the NIC Analytics team, including myself and NIC Chief Economist, Beth Mace. In addition to analysis of the most recent data, the reports show three-month rolling data on either total or stabilized occupancy for both seniors housing and nursing care properties over the prior 13 months, offering a perspective on broader trends.
Today, Intra-Quarterly Snapshot reports continue to provide a powerful and closely watched means to stay ahead of industry trends, even as senior housing markets sustain a fast pace of evolution and adaptation, amidst an apparent recovery.
Intra-Quarterly Snapshot Headlines Track the Trends
A look back at Intra-Quarterly Snapshot headlines, pulled from the top of every report published over the eighteen months, illustrates just how well these reports have tracked with industry trends, practically in real time. Each headline, as charted below, tracks with the key trends and inflection points over the pandemic to date. The The market’s initial contraction was identified in the first Intra-Quarterly Snapshot, in April 2020, and developed over subsequent months, through February 2021. From March through May, the headlines reflect cautious optimism of stabilization, which then begins to take hold in June 2021, as demand improved. From July of this year, each report has reflected improvements in occupancy rates.
If we chart just the changes in occupancy and stabilized occupancy, as reported in Intra-Quarterly Snapshot headlines, we find similar tracking with current market trends.
Changes in occupancy/stabilized occupancy as reported in Intra-Quarterly Snapshot headlines.
All-occupancy is defined by NIC MAP® as percent of existing inventory’s units that are occupied by residents as of the end of the month. Stabilized occupancy is defined by NIC MAP® as the occupancy of properties that are (a) at least two years old, or (b) if less than two years old, properties that have achieved occupancy of at least 95.0% since their opening.
Phase 1: March 2020 to March 2021
From March 2020 to March 2021, the largest occupancy decreases were reported in the April and July 2020 and January 2021 reporting periods. During this period, senior housing all-occupancy fell by 8.7 percentage points (pps) and stabilized occupancy fell by 8.5pps. Meanwhile, senior housing inventory increased by 2.8%, or 17,950 units. Demand through this period, as measured by occupied units of senior housing properties for the NIC MAP Primary Markets decreased by 7.5% or 42,344 units.
Phase 2: March 2021 to June 2021
During this time period as the vaccine rollout was nearly completed for most residents in seniors housing and skilled nursing properties, occupancy started to stabilize but continued to be challenged due to inventory growth. Quarterly absorption (% change in occupied units) turned green for the first time since the onset of the pandemic. Senior housing occupancy remained largely unchanged, mainly due to inventory growth offsetting demand growth. The inventory of senior housing properties for the NIC MAP Primary Markets increased by 0.7% or 4,354 units and demand increased by 0.6% or 3,364 units.
Phase 3: June 2021 to September 2021
Occupancy started to improve as demand rebounded over the Summer of 2021. The industry registered its strongest increase in the number of occupied units since NIC MAP began reporting the data back in 2005. The inventory of senior housing properties for the NIC MAP Primary Markets increased by 0.5% or 3,441 units and demand increased by 2.3% or 12,318 units. During this period, occupancy saw the largest quarterly growth since 2005 of 1.4pps.
To view what is happening today, and to gain insight into the continuation of occupancy gains, see the recently released October 2021 Intra-Quarterly Snapshot report.
Future Outlook
The October Intra-Quarterly Snapshot reveals that senior housing stabilized occupancy rose for the fourth consecutive reporting period. Notably, the stabilized occupancy rate for senior housing increased to 82.6% in the October 2021 reporting period for the NIC MAP Primary Markets, up 1.6pps from its time series low of 81.0% in the June 2021 reporting period and 0.4pps from the September 2021 reporting period on a three-month rolling basis. Senior housing stabilized occupancy continued the road to recovery but remained seven full percentage points below pre-pandemic March 2020 levels of 89.6%.
We cannot yet know how pandemic-derived challenges will unfold in future months, or when they will be fully behind us, but as the Intra-Quarterly Snapshot’s headlines reveal, the senior housing industry has weathered this extremely difficult period and begun the path to recovery.
At the 2021 NIC Fall Conference, senior housing constituents, while addressing the most pressing challenges facing the industry, nevertheless demonstrated reasons for optimism over the short, intermediate, and long term. The positive gains in occupancy over the last four intra-quarterly reporting periods provide a bullish indicator that the senior housing market outlook remains positive. Taken in combination with other market realities, such as the resilience of need-based demand, the ready availability of affordable financing, and major demographic tailwinds, conference attendees were understandably ready to look to the future with excitement and renewed positive energy.
Many conference attendees reflected on the past eighteen months, which for many may have been the toughest period in memory. Analysts may agree that the senior housing sector underwent perhaps its most severe era of demand loss and uncertainty on record. However, as revealed in every month’s Intra-Quarterly Snapshot, the industry is clearly demonstrating that, through innovation, collaboration, creativity, and risk tolerance, it is agile and resilient enough to bounce back even from that.
The data underlying every Intra-Quarterly Snapshot report is available to NIC MAP Vision clients. Data highlights, along with expert analysis and commentary, are provided in the complimentary Intra-Quarterly Snapshot monthly publication, available for download on nic.org.
The November 2021 IQ Snapshot report will be released on nic.org on Thursday, December 9, 2021 at 5:00pm.
We use cookies on our website to give you the most relevant experience by remembering your preferences and repeat visits. NIC's privacy policy can be viewed here. By clicking “Accept”, you consent to the use of ALL the cookies.
This website uses cookies to improve your experience while you navigate through the website. Out of these cookies, the cookies that are categorized as necessary are stored on your browser as they are essential for the working of basic functionalities of the website. We also use third-party cookies that help us analyze and understand how you use this website. These cookies will be stored in your browser only with your consent. You also have the option to opt-out of these cookies. But opting out of some of these cookies may have an effect on your browsing experience.
Necessary cookies are absolutely essential for the website to function properly. This category only includes cookies that ensures basic functionalities and security features of the website. These cookies do not store any personal information.
Functional cookies help to perform certain functionalities like sharing the content of the website on social media platforms, collect feedbacks, and other third-party features.
Performance cookies are used to understand and analyze the key performance indexes of the website which helps in delivering a better user experience for the visitors.
Analytical cookies are used to understand how visitors interact with the website. These cookies help provide information on metrics the number of visitors, bounce rate, traffic source, etc.
Advertisement cookies are used to provide visitors with relevant ads and marketing campaigns. These cookies track visitors across websites and collect information to provide customized ads.



 Bang:

