Senior Housing Sector Shows Improvement with Rising Occupancy Rates
Senior housing all-occupancy rate for the NIC MAP Primary Markets increased to 83.5% in the April 2023 reporting period.
According to intra-quarterly NIC MAP® data, released by NIC MAP Vision, the senior housing all-occupancy rate for the NIC MAP Primary Markets increased to 83.5% in the April 2023 reporting period, up 0.3 percentage points (pps) from the March 2023 reporting period on three-month rolling basis. From its time series low of 77.8% in June 2021, occupancy increased by 5.7pps, as evident in the exhibit below, with 20 of the 22 reporting periods showing positive gains (from June 2021 to April 2023).
Strong demand suggests a positive outlook for senior housing. According to NIC’s Executive Survey Insights (ESI) for the month of April 2023, this positive trend is supported, with one-half of responding operators (52%) reporting an acceleration in the pace of move-ins, the highest share of operators reporting an acceleration since April 2022 when 54% of organizations reported the pace of move-ins to be accelerating.
Occupancy Recovery by Majority Property Type. At 85.3%, the all-occupancy rate for majority independent living (IL) properties for the NIC MAP Primary Markets edged up 0.1pps from the March 2023 reporting period on a three-month rolling basis but remained 4.4pps below the March 2020 level. For majority assisted living properties (AL), the all-occupancy rate for the NIC MAP Primary Markets was up 0.5pps to 81.7% from March 2023 and is now 2.8pps below March 2020 levels. Despite the faster improvement in assisted living, the overall occupancy rate is still lower than that of independent living.
From its pandemic related low (June 2021), the all-occupancy for majority assisted living increased by 7.8pps, 4.2pps more than for majority independent living (up 3.6pps since June 2021). Occupancy for assisted living continued to recover relatively fast compared with independent living despite the relatively large inventory growth since the onset of the pandemic. However, in the past 12 months, assisted living inventory was less than that of independent living. The inventory of independent living and assisted living for the NIC MAP Primary Markets increased by 1.7% and 1.5%, respectively, from year-earlier levels in the April 2023 reporting period.
Occupancy Recovery Across Select Metropolitan Markets. In 11 of the 31 NIC MAP Primary Markets, assisted living occupancy rates have either returned to pre-pandemic March 2020 levels or exceeded them, with some markets being within less than 1pps from returning to their March 2020 levels. Notable examples include Dallas, where occupancy stands at 83.1%, surpassing the March 2020 level by 2.9pps, and Kansas City, with occupancy at 85.4%, exceeding the March 2020 level by 1.9pps. Other markets such as Phoenix, Orlando, Denver, Detroit, Tampa, Cleveland, Atlanta, San Antonio, and Portland have also demonstrated notable recovery in assisted living occupancy rates. Additionally, 20 of the 31 Primary Markets saw assisted living occupancy rates above 80% in April 2023.
For independent living, out of the 31 NIC MAP Primary Markets, only four have returned/exceeded March 2020 occupancy levels, or are within less than 1pps of reaching that benchmark. Some of these markets include San Antonio (87.0%, 1.8pps above March 2020 level), and Pittsburgh (89.7%, 0.6pps above March 2020 level). While the majority of the 31 NIC Primary Markets still have independent living occupancy rates differing by more than 1pps, it is important to note that all markets currently maintain occupancy rates above 80% (ranging from Houston at 80.1% to Boston 93.4%). This highlights the overall resilience and strength of independent living, even amidst varying levels of recovery.
Keep track of the most timely comprehensive review of the sector’s market fundamentals and trends. The NIC Intra-Quarterly Snapshot monthly publication, available for complimentary download on our website, continues to provide a powerful and closely watched means to stay ahead of industry trends, even as senior housing markets sustain a fast pace of evolution and adaptation, amidst an apparent recovery.
The May 2023 Intra-Quarterly Snapshot report will be released on our website on Thursday, June 8, 2023, at 4:30pm.
Interested in learning more about NIC MAP Intra-Quarterly data? To learn more about NIC MAP Vision data, schedule a meeting with a product expert today.
Issuance of New Construction Loans for Senior Housing Low in 4Q 2022
The issuance of mini-perm/bridge debt for senior housing bounced back in fourth quarter 2022 to levels seen earlier in the year.
NIC Analytics released the 4Q 2022 NIC Lending Trends Report today. The quarterly report, available complimentary to NIC constituents, includes data trends over six years for senior housing and nursing care construction loans, mini-perm/bridge loans, and permanent loans, from 3Q 2016 through 4Q 2022.
Takeaways from the 4Q22 NIC Lending Trends Report
After a sharp decline in the third quarter 2022, the issuance of mini-perm/bridge debt for senior housing bounced back in fourth quarter 2022 to levels seen earlier in the year. The use of mini-perms and bridge debt reflects difficulties in sourcing permanent debt, given the challenges in the overall capital markets and lending environment. Specifically, the jump in mini-perm/bridge loans for senior housing suggests that some borrowers are opting for mini-perm loans over permanent loans for some deals, likely due to elevated interest rates, inflation, and moderately low occupancy rates in general.
Closed new permanent loan volumes increased to levels seen earlier in 2022 but remained well below those levels seen in 2018 and 2019. For the sample of lenders in the Lending Trends Report, new permanent loans closed for nursing care was 38% less than that of senior housing.
Separately, senior housing new construction loan closings inched up slightly in the fourth quarter of 2022 but were generally weak by historic standards. Only two other periods in the time series were as low — the third quarter of 2022 and the first quarter of 2021. The issuance of construction debt for nursing care was almost negligible, in line with its pattern of limited debt financing for new nursing care property construction since NIC began collecting the data in 2016. In general, there has been limited development of new nursing care properties for the past several years.
The total balance of delinquent loans for senior housing inched higher in fourth quarter 2022, but was well below the high levels seen in 2020. Delinquencies as a share of total loans increased to 1.3% for senior housing from 1.2% in the third quarter. For nursing care, the delinquency rate slipped to 1.1%. Note that loans in forbearance are reported in the delinquent loan data for some debt providers. Notably, some foreclosures were reported for the sample in fourth quarter 2022 for senior housing.
As background, the Fed raised interest rates by 1.25 percentage points (pps) to 4.25%-4.5% in the fourth quarter of 2022 (+0.75pps in November 2022 and +0.5pps in December 2022). Subsequently, the annual inflation rate in the U.S. slowed for a sixth straight month to 6.5% in December 2022, down 2.6pps from the highs seen in June 2022 (9.1%). Meanwhile, senior housing construction starts remained relatively low in the fourth quarter of 2022, and the number of senior housing units under construction in the 31 NIC MAP Primary Markets remained near its lowest level since 2015, according to data released by NIC MAP Vision.
Download the complimentary 4Q 2022 NIC Lending Trends Reportfor full details on these and other trends in senior housing and skilled nursing lending.
Note: These data are not to be interpreted as a census of all senior housing and skilled nursing lending activity in the U.S., but rather reflect lending activity from participants included in the survey sample only.
The 1Q2023 NIC Lending Trends Report is scheduled for release in mid-August 2023.
Interested in participating? The NIC Lending Trends Report helps NIC Analytics to deliver on NIC’s mission to enable access and choice by further enhancing transparency of capital market trends in the senior housing and care sectors. We very much appreciate our data contributors. This report would not be possible without them.
If you would like to participate and contribute your data, please contact us at analytics@nic.org. As a courtesy for providing data, data contributors receive this report early before publication on the website. The information provided as part of the survey will be kept strictly confidential. Individual answers will be combined with the answers of all other respondents. Data acquired from this survey will only be reported in the aggregate, and therefore, the resulting aggregated data will not be attributed to you or your company upon distribution.
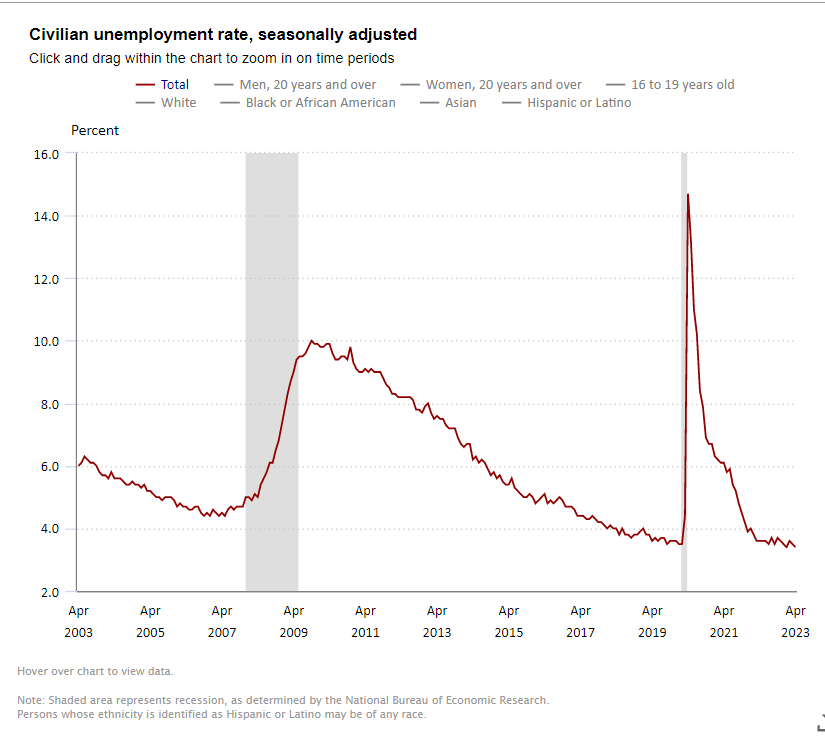
Jobless Rate Slides Back to 3.4% in April
The unemployment rate slipped back to 3.4% in April 2023, at the same level as in January at 3.4%, which was its lowest level since 1969
The Bureau of Labor Statistics (BLS) reported that the unemployment rate slipped back to 3.4% in April from 3.5% in March. This places it at the same level as in January at 3.4%, which was its lowest level since 1969. It has been hovering in a narrow range for many months now and underscores the ongoing tightness of the labor market.
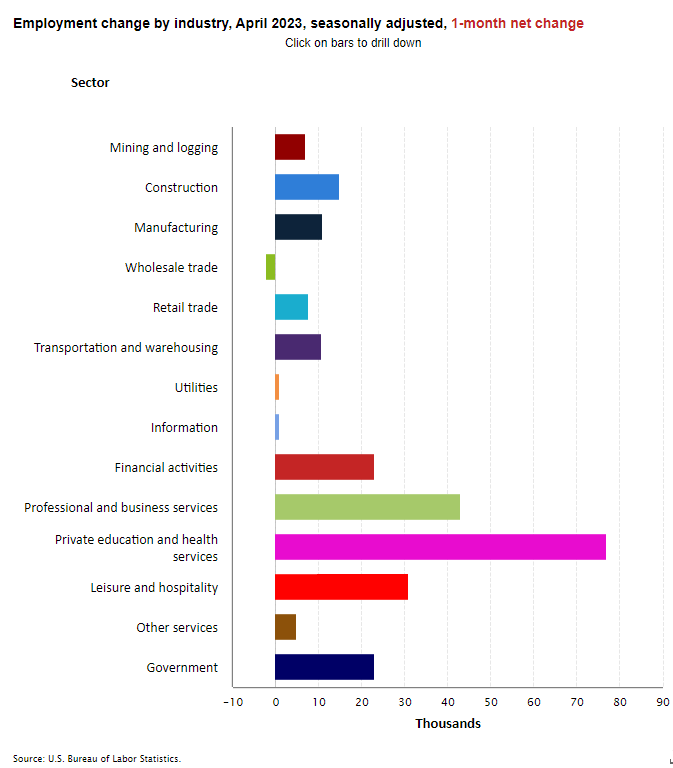
Separately, the BLS also reported that nonfarm payrolls rose by 253,000 in April 2023, below the monthly pace of 290,000 over the prior six months, but still strong. The three-month average gain in nonfarm payrolls was 222,000 as of April, below the 295,000-pace seen in March and the 430,000 pace in February. Market expectations had called for a gain of 185,000 jobs. Of note, revisions subtracted 149,000 positions to total payrolls in the previous two months.
Average hourly earnings for all employees on private nonfarm payrolls rose by $0.16 in April to $33.36 or up 0.5% from the prior month, the largest monthly gain in the past year. This was an increase of 4.4% from year-earlier levels, slightly more than in March at 4.3% (revised from 4.2%). The average hourly earnings data suggest that wage pressures are not easing rapidly. Earlier this week, the BLS released the employment cost index (ECI) which also showed that underlying pressures on inflation remain. Wages and salaries paid to workers rose 5.1% in March from a year earlier.
Today’s report shows the labor market remains tight, with the economy still creating jobs at a solid, albeit slowing pace. Notably, the gain occurred despite the turmoil in the banking sector. In fact, financial sector payrolls rose by 23,000 and professional and business services increased by 43,000. Employment in health care rose by 40,000 in April, compared with the average monthly increase of 47,000 over the past six months. Employment in nursing care facilities grew by 2,600 jobs from last month and 55,100 from year-earlier levels and stood at 1,397,300 positions. Jobs increased by 3,800 positions in CCRC and assisted living facilities and were up by 60,700 from year-earlier levels to 946,500 jobs.
The Fed is not likely to be heartened by the report in terms of observing a slowdown in the economy and inflation pressures. Earlier this week, the Fed raised interest rates another 0.25 percentage points to a range of 5.0-5.25% to its highest fed funds rate in 16 years as it continues to combat inflation. The Fed is looking for evidence of a softer labor market to help ease wage pressures and prevent a wage/price inflationary spiral from occurring.
Other employment data reports are starting to show a slightly slowing labor market, however. Indeed, earlier this week, the Labor Department released the Job Openings and Labor Turnover report (JOLTS) that showed that the demand for labor is starting to cool down a bit. The ratio of job vacancies to unemployed—a measure that Fed Chair Powell frequently references—was 1.64 in March from 1.68 in February. It has trended lower from an all-time high of 2.01 in March 2022 but remains higher than the 1.19 average in 2019, ahead of the pandemic. Total separations, which includes quits, layoffs and discharges rose by 91,000 in March to reach 5.9 million.
In the household survey, the jobless rate slipped 0.1 percentage point to 3.4%, down from 3.5% in March. Both months’ unemployment rates were well below the 14.7% peak seen in April 2020. The drop in the jobless rate reflected a decline in the civilian labor force (43,000) coupled with a relatively small rise in household employment (139,000). The underemployment rate was 6.5% versus 6.7% in March.
Among the major worker groups, the April unemployment rates were 3.1% for adult women, adult men (3.3%), teenagers (9.2%), Whites (3.1%), Hispanics (4.4%), Blacks (4.7%), and Asians (2.8%).
The labor force participation rate inched up to 62.6% in April, unchanged from March and up from 62.5% in February, which followed three prior monthly increases in the rate. It was below the February 2020 level of 63.3%, however. The number of long-term unemployed (those jobless for 27 weeks or more) was 1.2 million in April. These individuals accounted for 20.6% of all unemployed people.
Executive Survey Insights | April 1 to April 30, 2023
This ESI survey includes responses from April 1, 2023, to April 30, 2023, from owners and executives of 45 senior housing and skilled nursing operators.
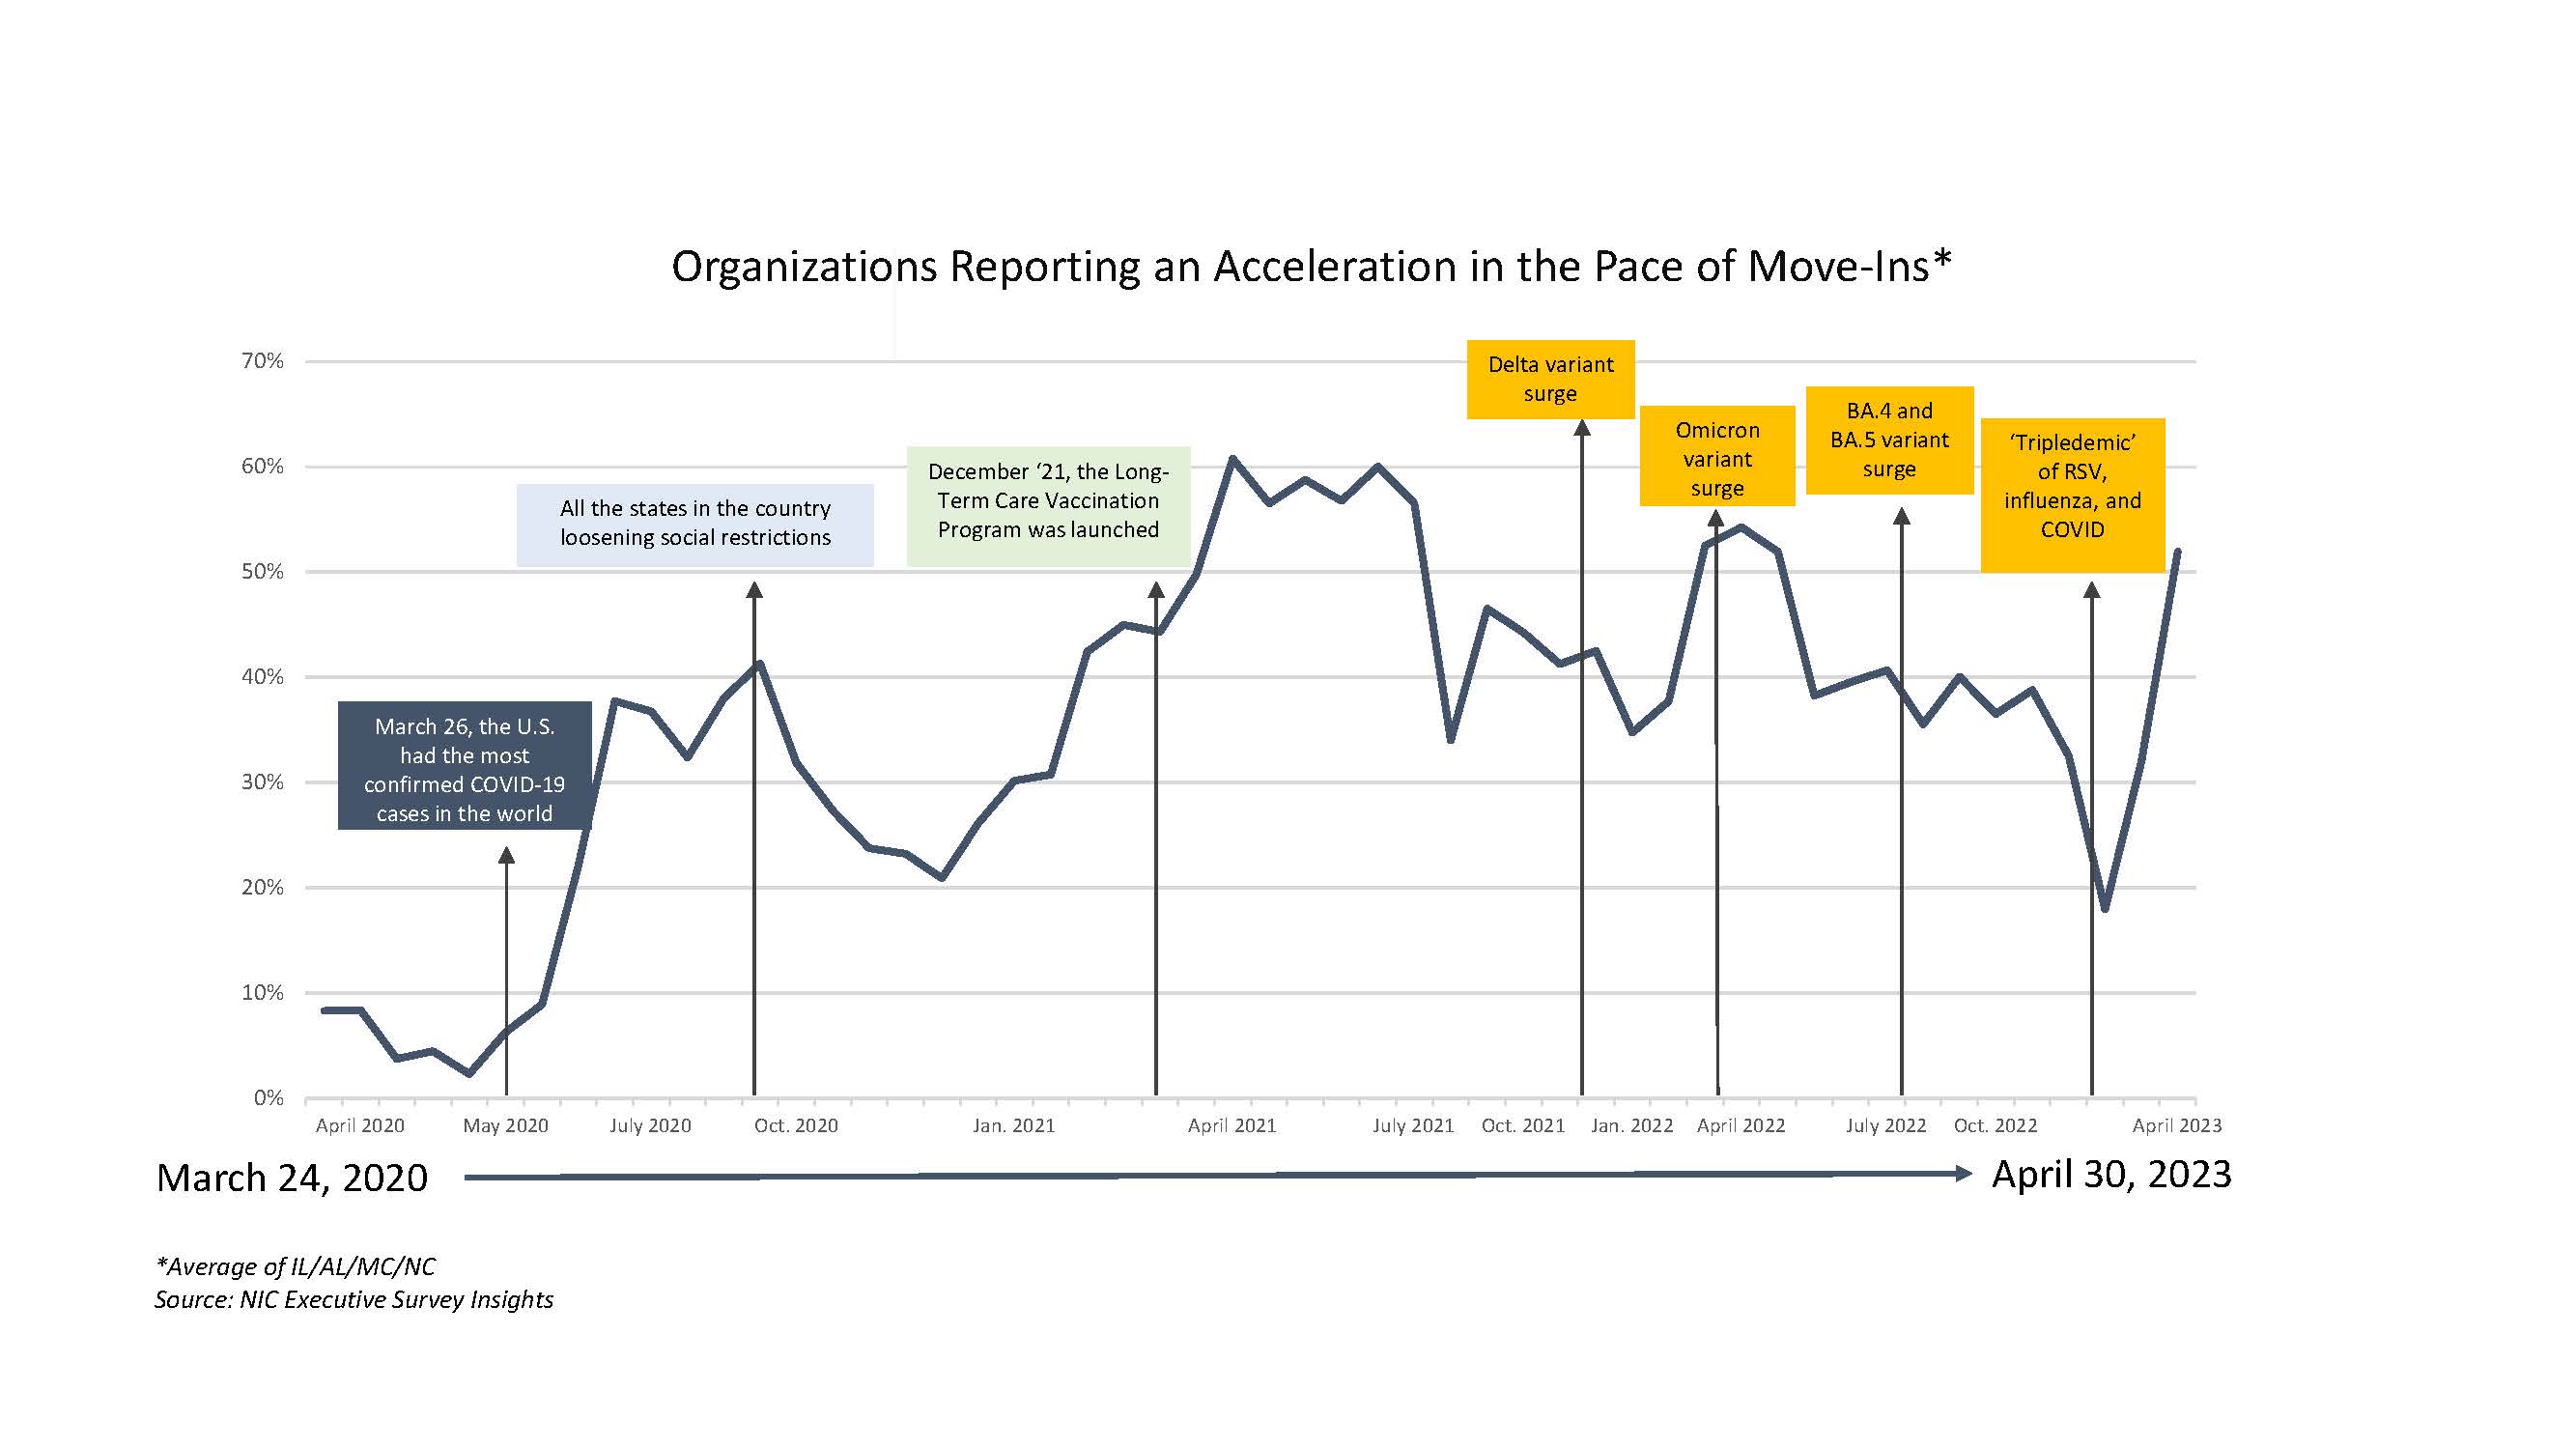
“When aggregated across all care segments, one-half of responding operators (52%) report an acceleration in the pace of move-ins in April 2023. This marks the highest level of operators reporting an acceleration since April 2022, when 54% of organizations reported the pace of move-ins to be accelerating. However, this is still below the peaks experienced from April to July 2021, when approximately 60% of operators reported an acceleration in the pace of move-ins.
The higher cost of debt is having an influence on organizations’ development pipeline. More than one-half of independent living operators (57%) report the higher cost of debt is having a significant impact to their development pipeline, followed by one-half of memory care (50%) and assisted living (49%) operators. Just under one-third of nursing care operators (29%) report the higher cost of debt having a significant impact on their development pipeline.”
–Ryan Brooks, Senior Principal, NIC
This ESI survey includes responses from April 1, 2023, to April 30, 2023, from owners and executives of 45 small, medium, and large senior housing and skilled nursing operators across the nation, representing hundreds of buildings and thousands of units across respondents’ portfolios of properties. The number of properties owned or operated by survey respondents in the April 2023 ESI ranges from one to as many as 400. More detailed reports for each “wave” of the survey and a PDF of the report charts can be found on the NIC COVID-19 Resource Center webpage under Executive Survey Insights.
In the April 2023 ESI, the share of operators reporting an acceleration in the pace of move-ins in the past 30 days has increased across all care segments. More than one-half of assisted living (56%), memory care (56%), and independent living (52%) operators report an acceleration in the pace of move-ins. For independent living operators, this marks the third consecutive month with an increase, up from 37% in March 2023 and from 27% in February 2023. Slightly fewer than one-half of nursing care operators (44%) report acceleration in the pace of move-ins, up from 28% the previous month.
When aggregated across all care segments, approximately one-half (52%) of operators report an acceleration in the pace of move-ins in April 2023. This marks the highest level of operators reporting an increase since April 2022, when 54% of organizations reported an increase. However, this is still below the peaks experienced from April to July 2021, when approximately 60% of operators reported an acceleration in the pace of move-ins.
The increasing proportion of organizations reporting an acceleration in the pace of move-ins is creating optimism with regard to the anticipated timeframe for occupancy to recover to pre-pandemic (March 2020) levels. Across all care segments, almost two-fifths of operators (38%) anticipate occupancy to recover in 2023, while one-quarter (25%) anticipate the recovery won’t occur until 2024. Only 6% of operators anticipate it will take until 2025 or later for occupancy to recover.
Perhaps predictably, the needs-based settings are the most optimistic about the occupancy recovery timeline, with almost one-half of nursing care (46%) and two-fifths of assisted living (41%) and memory care (40%) operators anticipating occupancy recovery in this calendar year. Conversely, for the wants-based setting of independent living, only one-quarter of operators anticipate occupancy to recover to pre-pandemic levels in 2023.
Despite optimistic occupancy recovery timelines, difficulties persist on the labor front. Attracting community and caregiving staff is cited as the biggest challenge by respondents (78%), followed by rising operator expenses (76%) and staff turnover (67%). The proportion of organizations reporting more than 25% of full-time, open positions across their organization has more than doubled – to 12% — since the last time this question was asked in November and December 2022, when only 5% of organizations reported more than 25% of full-time positions as open.
These openings are a leading cause of operators experiencing a staffing shortage and greater than 90% of operators report experiencing a staffing shortage in April 2023. Among these operators, just under one-tenth (8%) indicate the shortage to be severe. Three-quarters (75%) of respondents indicate their staffing shortage to be moderate, followed by one-sixth (17%) who indicate the shortage to be minimal.
Agency staff is still being used to supplement job roles, with nurse aides (38%) and nurses (33%) being the roles that are most often being supplemented. Food services employees (13%) and plant operations employees (10%) follow as the next most likely job roles to be supplemented by agency staff.
Even with the open, full-time positions being high in April 2023 and attracting community and caregiving staff being cited as the biggest challenge, almost one-half (48%) of operators believe staffing challenges will improve in 2023, followed by one-quarter (28%) of operators who anticipate seeing improvements in 2024, and the remaining one-quarter not anticipating seeing improvements until 2025 or later.
New questions to the ESI survey ask about the impact of the current operational environment (occupancy rates, operating expenses, inflation, etc.) on the ability to service debt as well as the impact of the higher cost of debt on their organization’s development pipeline.
With regards to the impact of the current operational environment on the ability to service debt, half (50%) of nursing care operators reported there was no impact, followed by just under one-half of assisted living (46%), independent living (43%), and memory care operators (41%). Comparatively, just under one quarter of nursing care operators (23%) reported the current environment had a significant impact on their ability to service debt, while one-sixth of memory care operators (17%), and one-tenth of independent living (11%) and assisted living operators (10%) reported a significant impact.
While most respondents indicate the current operational environment is having no impact to their ability to service debt, the higher cost of debt is having an influence on organizations’ development pipeline. More than one-half of independent living operators (57%) report the higher cost of debt is having a significant impact to their development pipeline, followed by one-half of memory care (50%) and assisted living (49%) operators. Just under one-third of nursing care operators (29%) report the higher cost of debt having a significant impact on their development pipeline.
Despite the impact of higher debt costs, two-fifths of operators are still considering diversifying their product offerings in 2023. Among organizations who are considering product diversification, three-quarters plan to diversify into lower acuity settings (76%), while only one-sixth plan to diversify into higher acuity settings (18%). A small portion of responding organizations (6%) plan to expand into both lower and higher acuity settings.
April 2023 Survey Demographics
Responses were collected between April 1 and April 30, 2023, from owners and executives of 45 senior housing and skilled nursing operators across the nation.
Owners/operators with 1 to 10 properties comprise roughly one-half of the sample (56%). Operators with 11 to 25 properties and operators with 26 properties or more account each account for roughly one-quarter (22%) of respondents.
More than one-half of respondents are exclusively for-profit providers (58%), one-third operate not-for-profit seniors housing and care properties (33%), and 9% operate both.
Many respondents in the sample report operating combinations of property types. Across their entire portfolios of properties, three-quarters (71%) of the organizations operate seniors housing properties (IL, AL, MC), 22% operate nursing care properties, and 36% operate CCRCs – also known as life plan communities.
The May 2023 ESI survey is currently open and will be collecting responses through May 31, 2023. If you are an owner or C-suite executive of seniors housing and care and would like an invitation to participate in the survey, please contact Ryan Brooks at rbrooks@nic.org to be added to the list of recipients.
NIC wishes to extend a heartfelt thank you to the owners and operators who have contributed to this survey over the past three years. It is remarkable that we have now completed more than 50 waves of surveys. We have surveyed through numerous challenges — COVID-19, threats of a looming recession, labor shortages, inflation, and rising expenses — many of which still persist. As we continue to navigate through these challenges, your input and real-time insights help ensure the narrative on the senior housing and care sector is accurate. By demonstrating transparency, you build trust. Thank you.
Skilled Nursing Occupancy Increased but Still at Low Levels
NIC MAP Vision released its latest Skilled Nursing Monthly Report and showed occupancy increased 23 basis points from January to end February at 81.3%.
NIC MAP Vision released its latest Skilled Nursing Monthly Report on May 4, 2023. The report includes key monthly data points from January 2012 through February 2023.
Here are some key takeaways from the report:
Occupancy
Skilled nursing property occupancy increased 23 basis points from January to end February at 81.3%. Occupancy is up 196 basis points from one year ago in February 2022 as it continues to recover since the pandemic low of 74.6% set in January 2021. Occupancy has increased for three months in a row. To be clear, challenges do persist as staffing shortages continue to create difficulties within skilled nursing properties limiting the ability to admit new residents in some markets. However, the current occupancy trend does suggest that demand for skilled nursing properties is recovering, given the increase in occupancy in 2022 and continuing in 2023. Occupancy remains low compared to February 2020 pre-pandemic levels of 88.8% (7.5 percentage points).
Managed Care
Managed Medicare revenue mix declined slightly, dropping 5 basis points from January to end February at 11.6%. It has declined 78 basis points since its recent high of 12.4% in February 2022. However, it is up by 254 basis points from the pandemic low set in May 2020 of 9.1%. Expectations are that it will continue to increase over time with the growth of managed Medicare. Meanwhile, Managed Medicare revenue per patient day (RPPD) was flat, holding at $473 in February, but it is down 1.7% from last year in February 2022. It has decreased $119 (20.1%) from January 2012 and continues to pressure some operators’ revenue as managed Medicare enrollment grows around the country. However, some operators see managed Medicare as an opportunity for growth in patient volume.
Medicaid
Medicaid patient day mix increased slightly to 64.7 % in February. However, it has increased 138 basis points from the pandemic low of 63.3% set in January 2021. In addition, Medicaid revenue mix decreased slightly in February, representing just over half of property revenue at 50.5%. However, it has increased 202 basis points from the pandemic low of 48.5% set in February 2022. Meanwhile, Medicaid revenue per patient day (RPPD) increased to $269 in February. It increased 3.2% from $261 one year ago in February 2022.
Medicare
Medicare revenue per patient day (RPPD) decreased slightly from January to end February 2023 at $588. It has increased 2.6% since September 2022. Most of this increase in reimbursement is likely a result of the increase in Medicare rates to skilled nursing properties for fiscal year 2023 and potentially higher acuity patients, which also increases RPPD to care for more complex patients. Meanwhile, Medicare revenue mix decreased for the second month in a row. It decreased 30 basis points from January to end February at 22.1%. It is down from one year ago as well, decreasing 269 basis points from February 2022.
The report provides aggregate data at the national level from a sampling of skilled nursing operators with multiple properties in the United States. NIC continues to grow its database of participating operators to provide data at localized levels in the future. Operators who are interested in participating can complete a participation form on our website. NIC and NIC MAP Vision maintain strict confidentiality of all data received.
We use cookies on our website to give you the most relevant experience by remembering your preferences and repeat visits. NIC's privacy policy can be viewed here. By clicking “Accept”, you consent to the use of ALL the cookies.
This website uses cookies to improve your experience while you navigate through the website. Out of these cookies, the cookies that are categorized as necessary are stored on your browser as they are essential for the working of basic functionalities of the website. We also use third-party cookies that help us analyze and understand how you use this website. These cookies will be stored in your browser only with your consent. You also have the option to opt-out of these cookies. But opting out of some of these cookies may have an effect on your browsing experience.
Necessary cookies are absolutely essential for the website to function properly. This category only includes cookies that ensures basic functionalities and security features of the website. These cookies do not store any personal information.
Functional cookies help to perform certain functionalities like sharing the content of the website on social media platforms, collect feedbacks, and other third-party features.
Performance cookies are used to understand and analyze the key performance indexes of the website which helps in delivering a better user experience for the visitors.
Analytical cookies are used to understand how visitors interact with the website. These cookies help provide information on metrics the number of visitors, bounce rate, traffic source, etc.
Advertisement cookies are used to provide visitors with relevant ads and marketing campaigns. These cookies track visitors across websites and collect information to provide customized ads.