Senior Housing Occupancy Nears Record High as Majority of Markets Surpass 90%
Current construction rate meets just 10% of annual demand
NIC experts see potential shift toward development increases on the horizon
Annapolis, Md. (Oct. 1, 2026) — Senior housing occupancy surpassed 90% in the third quarter of 2026, according to the National Investment Center for Seniors Housing & Care (NIC), using data analyzed from NIC MAP. The third quarter of 2026 marks the 21st quarter of occupancy gains across senior housing categories.
Topline 3Q 2026 Data:
-
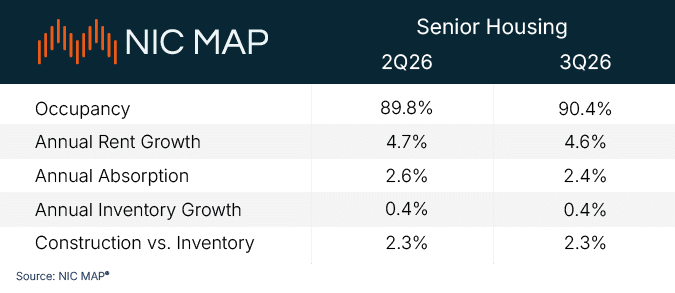
National Occupancy Rate: 90.4%, which is 0.6 percentage points up from 89.8% last quarter; occupied units are up 0.7% to 644,428, compared to 639,871 in the second quarter.
- Independent living occupancy: 91.7%, up from 91.3% in the previous quarter.
- Assisted living occupancy: 89.1%, up from 88.3% in the previous quarter.
- Active adult occupancy: 93.2%, up from 92.6% in the previous quarter.
-
Local Market Occupancy Rates: 16 of the 31 primary geographic markets tracked by NIC MAP are at 90%+ occupancy, compared to 15 in the second quarter.
- Highest Occupancy: Boston (94.0%), San Francisco (93.3%), and Minneapolis (92.7%).
- Lowest Occupancy: Houston (87.3%), Atlanta (87.2%), and Miami (86.5%).
-
Construction & Inventory:
- Construction fell by 1.0%, with 16,159 total units in development in the third quarter, split between independent living and assisted living.
- Inventory growth held steady at 0.4% year-over-year, near record lows.
Construction Trails Demand, Exacerbating Senior Housing Shortage
Demand for senior housing continues to outpace new construction nationwide. According to NIC MAP, holding national occupancy at 90% as the population ages would require more than 100,000 new units in most years through the late 2030s. The current pace of development is 10,445 units per year — roughly 10% of that requirement.
“For several quarters we’ve seen a widening gap between what Baby Boomers will need and what the industry is producing,” said Lisa McCracken, NIC’s head of research and analytics. “We’re hearing anecdotally that planning activity for new development is picking up, but until we see the trend reflected in the data, there will continue to be increasing pressure—and opportunity—to meet demand.”
Boston (94.0%) and San Francisco (93.3%) are nearing record-high levels of occupancy as of the third quarter, respectively climbing toward the highest occupancy rate ever observed in the 31 NIC MAP primary markets (95.6%). In high-occupancy markets like Boston, which has topped the charts for 21 quarters, operators are using waitlists to ensure fair access to housing, and older adults are increasingly faced with waiting years for desired housing to become available.
Coastal Construction, Acquisition Costs Indicate Potential Shift Toward Development
While market variances exist, most new development activity is concentrated on the coasts. Operators and investors report that acquisition costs of new properties are beginning to surpass the expenses required to rebuild or repair existing property, also known as replacement costs. Analysts believe this trend will push construction at a time when it is desperately needed to meet rising demand.
“As replacement costs start to drop below acquisition costs, we’re approaching a tipping point where new construction becomes a viable opportunity to meet the significant demand for senior housing,” said Arick Morton, CEO of NIC MAP. “But new construction alone won’t get us where we need to be. Adaptive reuse of large buildings, expansion of existing properties, or other creative ideas could also be a solution.”
Demand for Active Adult Housing Pushes Occupancy Above 93%
Occupancy in active adult housing increased by 0.6 percentage points to 93.2% in the third quarter, the highest level since 2024. It has increased by 1.3 percentage points since the end of 2025.
NIC MAP data show that fitness centers, clubhouses, pools, and activity coordinators are the most common amenities in active adult communities, highlighting the role that wellness and social connection play in the appeal of this housing type.
The improving occupancy trend comes as active adult construction has slowed alongside conventional multifamily. NIC experts say both segments are working through a wave of supply delivered in recent years, particularly in Sunbelt and lower-cost markets that attracted residents as remote work expanded during the pandemic.
“The occupancy gain is an encouraging sign that some of the softness we saw in the active adult market in 2025 has improved in 2026,” said Caroline Clapp, NIC’s senior principal. “With new units slowing after significant deliveries in 2024 and 2025, communities that align their offerings with residents’ priorities around wellness and social connection may be well positioned as the market absorbs recent supply.”
Performance varied across the 15 largest active adult markets. Occupancy reached 97.7% in Buffalo and 97.4% in both Los Angeles and San Diego, while Phoenix recorded the lowest rate at 88.7%.
# # #
An abridged report featuring the newly released data will be available at 4:30 p.m. ET on Thursday, Oct. 1, 2026. While the report is a complimentary resource, only NIC MAP clients can access the full underlying data and additional metrics at the metro level through the platform.
A summary of the NIC MAP Market Fundamentals Data, by NIC MAP, is below.
About the National Investment Center for Seniors Housing & Care
The National Investment Center for Seniors Housing & Care (NIC), a 501(c)(3) organization, works to enable access and choice by providing data, analytics, and connections that bring together investors and providers. The organization delivers trusted, objective, and timely insights and implications derived from its analytics, which benefit from NIC’s affiliation with NIC MAP, the leading provider of comprehensive market data for senior housing and skilled nursing properties. NIC events, which include the industry’s premiere conferences, provide sector stakeholders with opportunities to convene, network, and drive thought-leadership through high-quality educational programming. For more information, visit NIC’s website and follow NIC on LinkedIn, Facebook, and Instagram.
About NIC MAP
NIC MAP is the senior housing industry’s independent market-data service. We bring together occupancy, rate trends, and the construction pipeline across 35,000+ U.S. properties in a single platform built for senior housing — informing the investment, underwriting, and research decisions of the industry leaders who shape it, including the top senior housing operators, federal agencies, and major capital providers. For more information, visit www.nicmap.com