Economy Adds 2.64 million Jobs in 2018

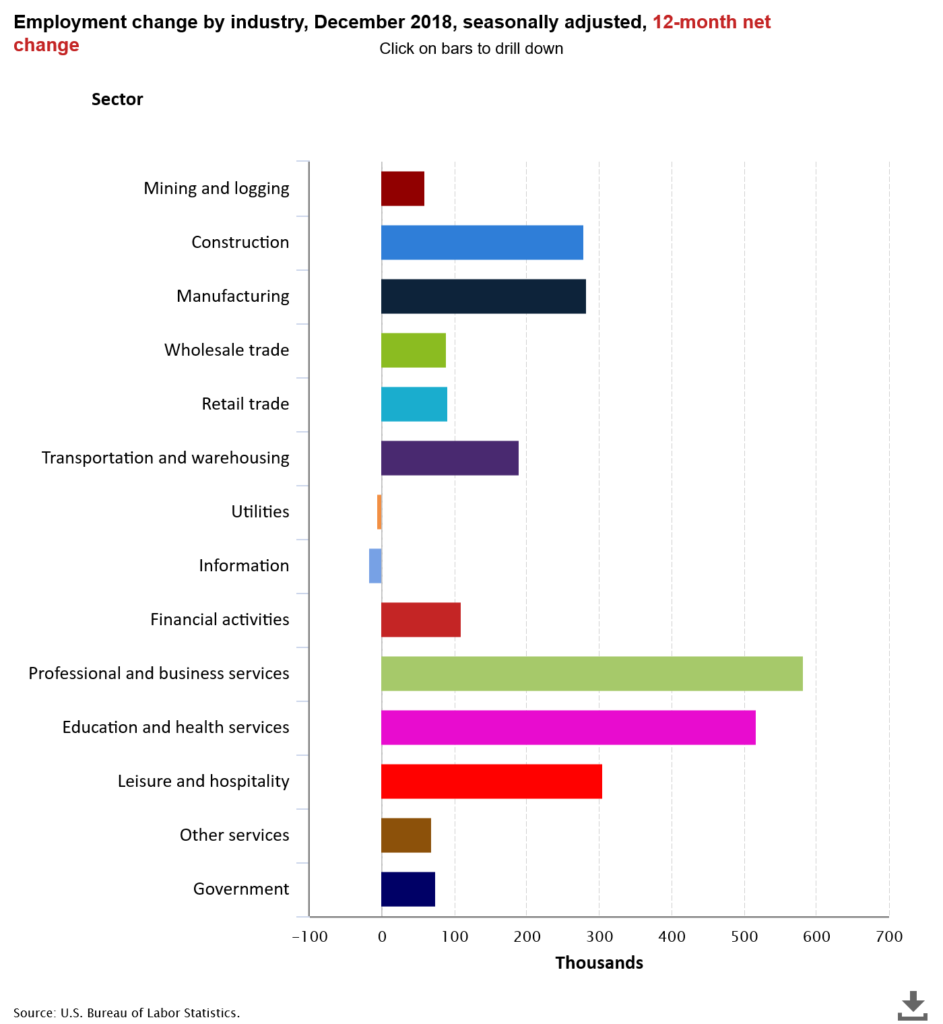
Over the year, the U.S. economy added 2.64 million jobs, making it the third best year for job growth since the recession a decade ago and the third best year since 2000.

The Labor Department also reported that there were 312,000 jobs created in the U.S. economy in December, well above the consensus expectation of 176,000. This was the 99th consecutive month of job growth. November was revised up from 237,000 to 274,000 and October was revised up from 237,000 from 274,000. With these revisions, employment gains in October and November combined were 58,000 more than previously reported.

In December, employment in health care rose by 50,000. In the past year, health care has added 346,000 jobs, more than the gain of 284,000 in 2017.

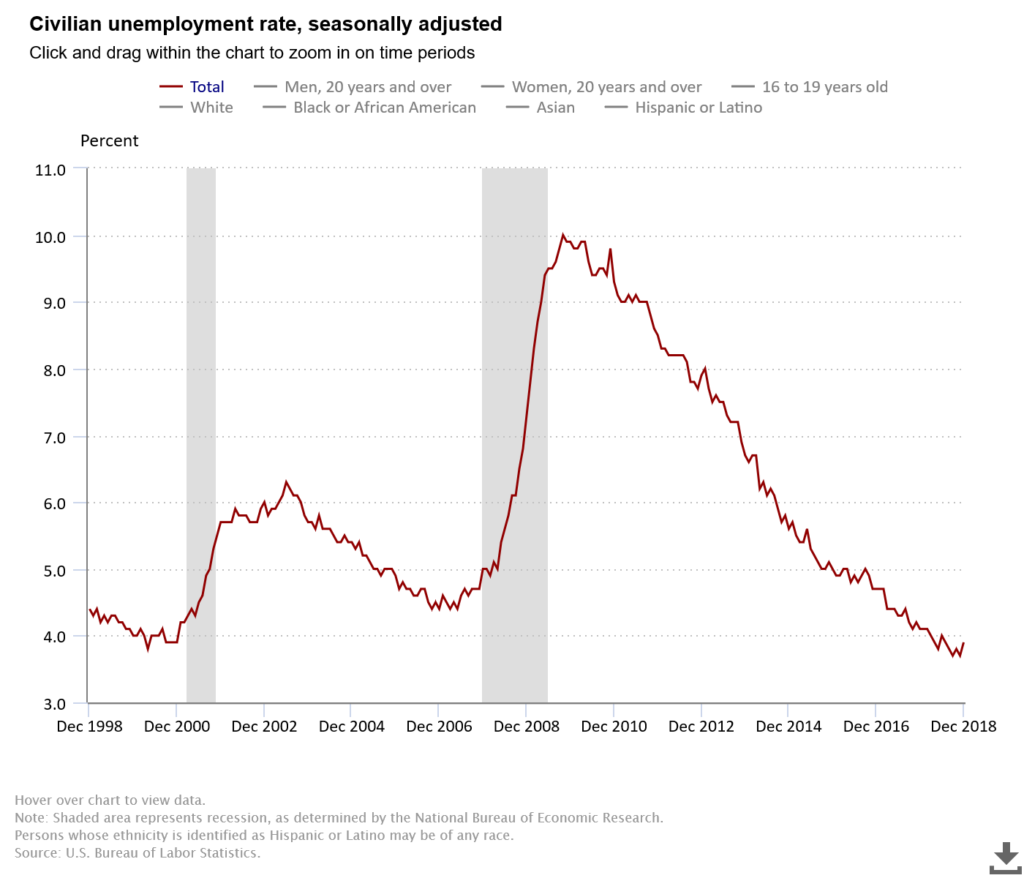
The unemployment rate increased 0.2 percentage points from a near-50 year low of 3.7% in November to 3.9% in December. Nevertheless, the jobless rate remains well below the rate of what is generally believed to be the “natural rate of unemployment” of 4.5%, which suggests that upward pressure on wage rates will continue. Further indications that this is in fact starting to occur were released in the report. Average hourly earnings for all employees on private nonfarm payrolls rose in December by eleven cents to $27.48. Over the past 12 months, average hourly earnings have increased by 84 cents, or 3.2%. This was the strongest pace since 2008. Last year, they rose by 2.6%.

A broader measure of unemployment, which includes those who are working part time but would prefer full-time jobs and those that they have given up searching—the U-6 unemployment rate—was unchanged at 7.6% in December.

It is important to note that the jobless rate is calculated from a different survey than the survey used to calculate the number of new jobs (the household versus the establishment survey, respectively).

The labor force participation rate, which is a measure of the share of working age people who are employed or looking for work rose to 63.1% in December from 62.9% in November, still very low but up from its cyclical low of 62.3% in 2015. The low rate at least partially reflecting the effects of an aging population.

As widely anticipated, the Federal Reserve hiked the fed funds rate by 25 basis points at its December 18th and 19th FOMC meeting to a range of 2.25% to 2.50%. This marked the fourth increase in 2018. The Fed has now raised rates by a quarter percentage point nine times since late 2015, after keeping them near zero for seven years. However, the Fed did shift its tone a bit and lowered its official projection for additional rate increases in 2019 from three to two increases.

Its notable that most economic data releases, including all of those published by the BEA, Commerce and Census Bureau, will be suspended while the Federal shutdown continues. However, media reports suggest that data releases from the BLS, including the Employment Report and CPI, will continue as scheduled.

The Implications of PDPM for Skilled Nursing

Medicare is changing the way skilled nursing operators are paid, effective October 2019. The new Patient-Driven Payment Model (PDPM) system replaces Resource Utilization Groups (RUGs) and will dramatically shift predictors of financial success, while raising new compliance concerns as operators change their business strategies to adapt. Skilled nursing investors, as well as owners, operators, and care/service providers will not want to miss PointRight Executive Vice President and Chief Clinical Officer Steven Littlehale’s upcoming NIC Spring Conference presentation on the subject. NIC recently discussed the session with Littlehale, which is recapped here: 

NIC: Can you tell us a little about yourself? 

Littlehale: I am a unique blend of advanced practice nurse and applied researcher. I’ve been a principal with a data analytics company called PointRight since its founding over 20 years ago. The way we at PointRight think about the changes in CMS programming, reimbursement, and quality measurement is very different than how most people would think about the same data. We use predictive and prescriptive analytics to plot a course for success. Investors work with us to make better-informed decisions, as well as manage their portfolios. We go much deeper than publicly-available information. Owner/operators work with us to ensure they have excellent clinical, regulatory, and financial outcomes. 

NIC: What’s the session all about? 

Littlehale: PDPM represents a massive shift in how CMS is reimbursing nursing homes for Medicare patients. It’s been just about 20 years since the current system was put in place. Transitioning to PDPM is not another “RUG update”, it really is a theoretical and conceptual shift in how nursing homes are reimbursed for Medicare patients. In my view, it’s restating many of the values embedded within the Affordable Care Act. I feel that PDPM is an evolution out of the ACA, something that many people, along with MedPAC, have been advocating for in the skilled nursing environment for quite some time. PDPM is also a stepping stone to a unified payment system for post-acute care, which will replace it in a couple of years. 

NIC: Who should attend the session? 

Littlehale: It’s really geared for the investor, as well as the owner/operator, who will come into the session with some solid background information on PDPM by February. The investor will be more sensitive in responding to the “PDPM rumor mill” and want to better understand how to anticipate PDPM pitfalls. Both groups will get great insights from the session.  

NIC: Why is understanding PDPM important? 

Littlehale: Because PDPM is just for Medicare reimbursement, many people will say “yes, but the Medicare population in skilled nursing is shrinking.” The reality is that many of the Medicare managed care programs will follow the values embedded within PDPM, along with the actual structure, and abandon the current RUGs system. Even though it’s just for Medicare, it will have a ripple effect through not only managed Medicare but also the Medicaid Case Mix state. They’re using the current RUGs system to understand and reimburse for Medicaid. That will be impacted as well. 

Also, I see PDPM as the federal government tipping their hand to indicate how they value skilled nursing, and what role they see it playing. PDPM rewards facilities that take care of very sick elders. They’re not rewarding an arbitrary allocation of therapy minutes. That is not to say that therapy isn’t essential in skilled nursing care – it will not be the tail wagging the dog. In the continuum of post-acute care, CMS is valuing skilled nursing to provide medical/nursing and rehabilitation to complex elders who often have a host of comorbidities. The upside is when, a few years from now, we get to a unified payment system, in which all post-acute care will be paid at the same rate, agnostic to the setting, skilled nursing will be the best, most cost-effective, institutionally based care setting. The long-term view is that PDPM is really setting us up for future success, if we don’t blow it. 

NIC: How did this session come to be? 

Littlehale: It came from clients asking great questions, like “what does PDPM mean to me? I’m a REIT and need to understand how to manage my portfolio, do I need to make changes?” or “I’m in the midst of an acquisition, is it going to be a winner or a loser under PDPM?” Owner/operators are asking what they need to do differently to be successful under PDPM. It’s also a response to a really obnoxious rumor mill around PDPM, that still exists today. Within moments of the proposed rule coming out of CMS on PDPM, the environment was saturated with experts who were making really bold statements. They’d say that MDS was now irrelevant, or that now you can get rid of the MDS coordinator due to lower volume of MDS assessments or eliminate therapy. It was foolishness. If someone was to hold on to that belief, they’d head off a cliff.  

There’s also another very important part of this. A lot of very smart people are trying to “figure out” how to win under PDPM. It happens in every industry – when the rules change, players come up with strategies to win the game. When you dig into PDPM, you see that what CMS has done is really quite brilliant. If you try to manipulate one part of the assessment, it will hurt another part of the assessment. There are checks and balances built into the system. It’s as if they’ve given providers enough rope to hang themselves. They’ve basically said “we’re not going to be overly prescriptive about when you have to do this or that assessment, or how you have to think about this concept. We’re going to let providers do the right thing. But we’re going to monitor the hell out of you, and if you abuse it, you’re going to get severely penalized.” Part of the session is to discuss PDPM from a compliance perspective. We’re trying to make sure they’re creating or updating a compliance program that avoids abusing PDPM. 

NIC: How will the session be structured to help attendees understand these issues? 

Littlehale: It’ll be very interactive. Following a brief didactic, I’m going to engage the audience with lots of questions and answers. I’ll ask, for example, “what are the most ridiculous things you’ve heard about PDPM since it first went live?” We’ll do a lot of myth-busting and will discuss what the truth is. 

NIC: What are the key takeaways you hope to leave attendees with? 

Littlehale: I hope they’ll leave confident that they know the right questions to ask. During mergers and acquisitions, that is so essential. Someone who is successful under the current RUGs system won’t necessarily be so under PDPM. The questions that will help you understand whether they’ll be successful, or whether they’re pulling the PDPM wool over your eyes, will be revealed by the end of the session.  

“The Implications of PDPM for Skilled Nursing” is scheduled for Friday, February 22, 2019, from 9:30 AM – 10:45 AM at the 2019 NIC Spring Conference in San Diego, California. To learn more, or to register, click here.
Deep Dive: A Three-year Look Back at Supply and Demand Dynamics by Metropolitan Market

As in all real estate, “its local” for seniors housing as well.  Indeed, while the seniors housing occupancy rate remained at a six-year low rate of 87.9% in the third quarter, not all markets were weak. There was a very wide disparity between the best and poorest performing markets with a 13.8 percentage point variance between the most occupied market (San Jose: 94.6%) and the least occupied market (Houston: 80.8%) in the third quarter. Every market performs differently as unique conditions and factors contribute to disparate development and demand patterns at the local and metropolitan market level.

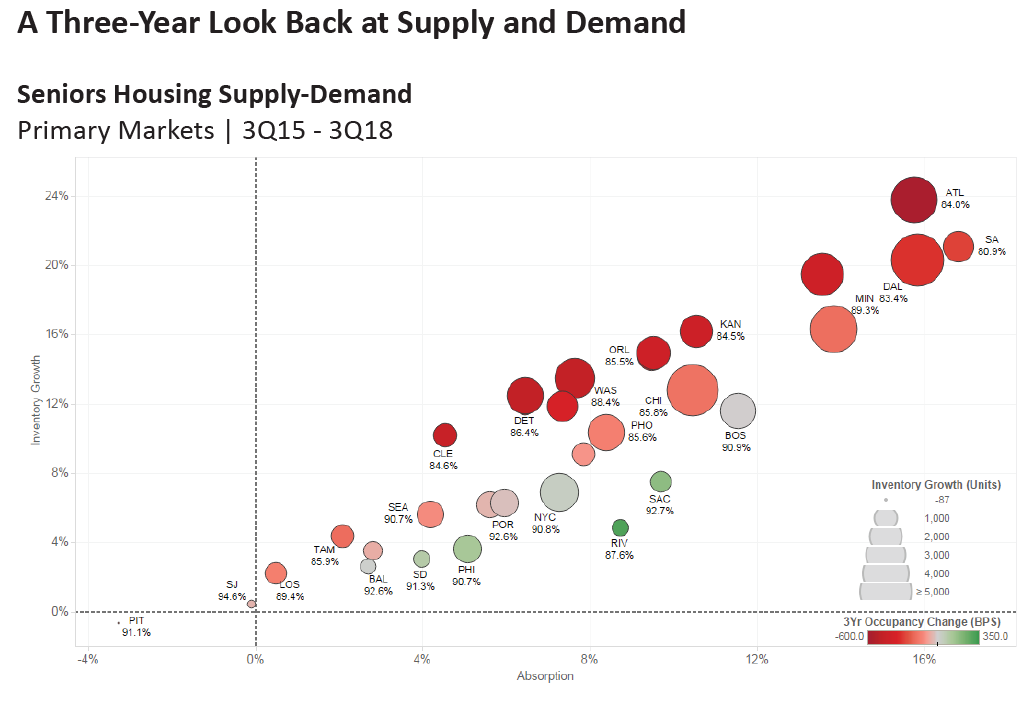
The chart below provides details of the supply and demand dynamics for the NIC MAP 31 Primary Markets in the past three years. The vertical axis shows annual inventory growth in percentage terms, while the horizontal axis shows annual net absorption growth for the past three years. The color of the circle depicts the movement of the occupancy rate over the past year: red for a deteriorating occupancy rate and green for an improving occupancy rate. The size of the circle shows how many absolute units were added to inventory in the past three years.

In the past three years, Houston, Atlanta, San Antonio and Dallas have all seen inventory grow by 20%, while Minneapolis, Kansas City, Denver and Orlando have seen a 15% increase in stock. In all these metropolitan markets, occupancy has fallen between two and six percentage points as the pace of new inventory growth has exceeded that of demand.

The strongest net absorption occurred in many of the markets that experienced the fastest growth in inventory. In the chart, this can be identified by the markets furthest to the right. This includes San Antonio, Dallas, Atlanta, Minneapolis, Houston and Kansas City. The fact that these circles are also red, however, shows that occupancy declined in these markets over the past three years and that, while demand was strong, it simply was not “strong enough.” However, there is a good chance that demand will start to catch up in some of these markets because projects currently under construction have declined significantly. This is particularly the case in San Antonio, which had less than 100 units under construction as of the third quarter.

The flip side is metropolitan areas that have not seen very much inventory growth and have seen occupancy rate improvement in the past three years. This includes Riverside, Sacramento, Philadelphia, Baltimore, San Diego and New York.

In terms of absolute unit growth over the past three years, the most unit inventory gains occurred in Dallas, Chicago, Minneapolis, Atlanta and Houston–those markets with the largest red circles in the chart. These five geographies accounted for 40% of the 54,000 units of inventory growth in the NIC MAP Primary Markets in the past three years. Behind this top five group are Washington DC, New York City, Detroit, Phoenix, and Boston. The top 10 markets for inventory growth accounted for 63% of inventory growth in the past three years. Offsetting these trends are markets with relatively little inventory growth over the past three years which include San Jose, Baltimore, Las Vegas, San Diego, Riverside, and Pittsburgh.

Taken together, this analysis supports the maxim that all real estate is local and that broad aggregate trends can obscure opportunities. It would appear that the much-ballyhooed supply story of San Antonio has been paid heed and units under construction currently have slowed dramatically, providing a pause in inventory growth to allow demand to catch up and occupancy to rise above 81%. Meanwhile, Phoenix currently has the most absolute number of units under construction at 3,524 units or 13.9% of its inventory, dwarfing the 2,368 units completed in the past three years. Eight other markets have greater amounts of units under construction today than what was completed in the past three years. Other than Phoenix, this includes Baltimore, San Diego, Riverside, Sacramento, Los Angeles, Philadelphia, New York, and Miami. These markets bear watching and deserve further examination to determine if demand in these markets will in fact be “strong enough.”

Seniors Housing Penetration Rates: Variation over Time, Variation Across Metropolitan Markets

Penetration rates vary across markets and across time.  Some of the variation may be due to differing demand factors such as population and household growth and size, consumer preferences, familiarity and comfort with the product, changes in the composition of inventory, and cultural influences. This blog post explores some of this variation.

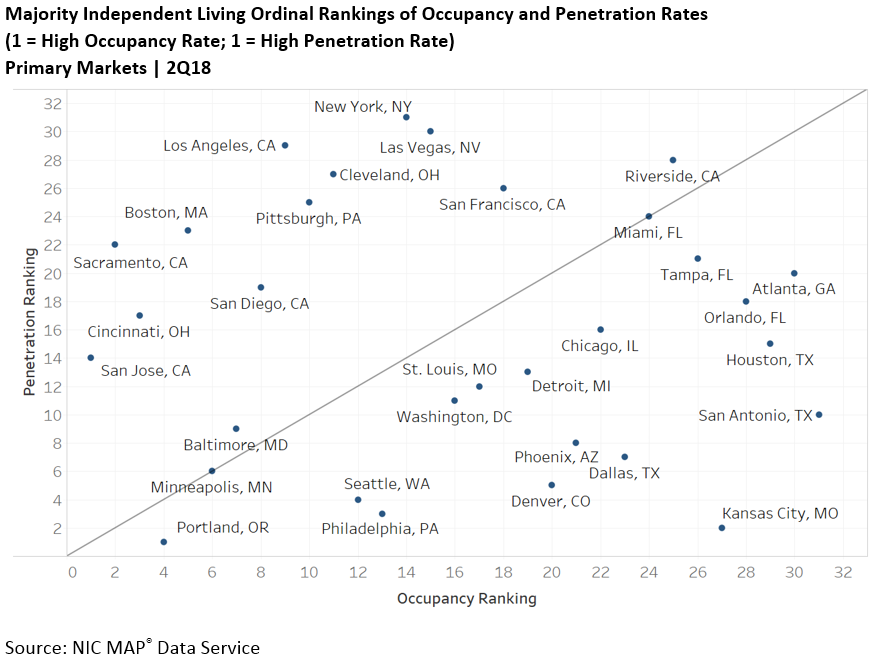
The chart above shows the ordinal ranking of occupancy rates and penetration rates for the Primary 31 markets for Majority Independent Living (IL) properties as of 2Q2018 from the NIC MAP® client portal. Although one might expect areas with high occupancy to also have high penetration, the data show that is not always the case and that there is variation in the relationship between occupancy rates and penetration rates.

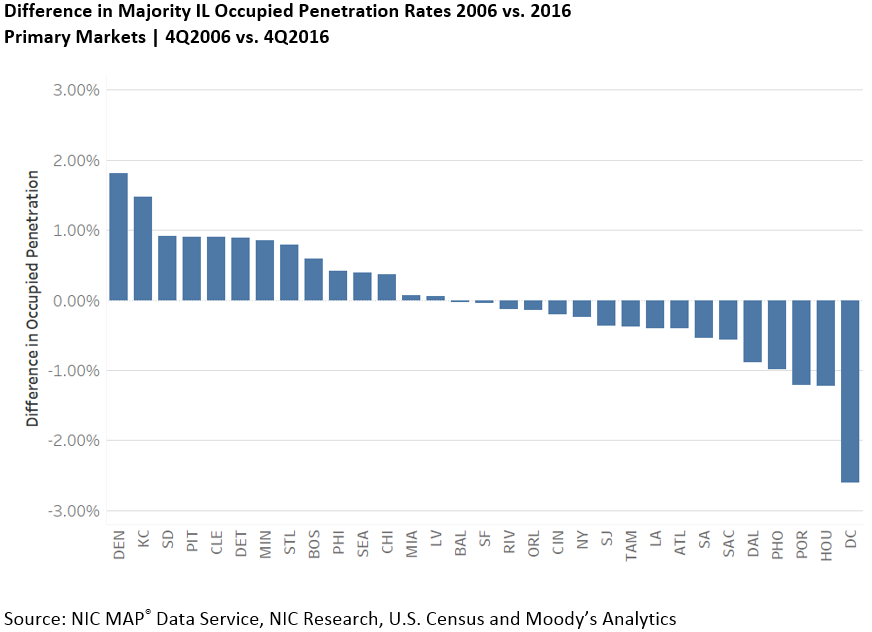
Penetration rates over time: Some have risen, some have fallen.  An analysis of metropolitan market penetration rates across time that uses NIC MAP seniors housing inventory and occupancy data and time series household demographic data from the U.S. Census and Moody’s Analytics reveals interesting results1 This analysis calculates two types of penetration time series: occupied penetration (calculated as the number of occupied units divided by households age 75+) and supply penetration (open inventory divided by households age 75+). After calculating the supply penetration rate and occupied penetration rate time series for the Primary 31 Markets, we also calculated the respective changes from 4Q2006 to 4Q2016 for each metropolitan market.

The data show wide differences in penetration rates by geography, with high penetration rates for Majority IL, Portland, Oregon; Philadelphia; Kansas City; and Seattle ranked high, while Los Angeles; Riverside; New York; and Las Vegas ranked low.

The analysis also examined changes in occupied penetration rates across time by metropolitan market. For Majority IL, 17 out of the 31 Primary Markets saw decreases in occupied penetration rates in the 10 years ending in 2016, while the other 14 showed increases. For the aggregate Primary 31 Markets, occupied penetration remained flat at 5.6% for Majority IL.

Why have some markets experienced rising penetration rates, while others have not?  The answer reflects underlying supply and demand factors, such as a comparison of growth in inventory compared with growth in households over age 75, demand-related factors such as familiarity with the product, demographic patterns of both seniors and their adult children, and in some cases idiosyncratic factors unique to each metropolitan area such as cultural comfort with the product offerings.  Operator reputation in a market may also help explain penetration rates.  This variability reinforces how important it is to evaluate conditions at a local market level.

Conclusion.  Penetration rates and occupancy rates do not have a clear-cut relationship across markets.  Penetration rates can increase when inventory growth outpaces household growth. In some instances, this may result in falling occupancy rates; but in others, occupancy rates remain steady.  Factors such as familiarity with the product type, marketing and education efforts, operator reputation, growth in the number of seniors and their adult children, variation in population health needs, local cost of living, affordability of product, and perhaps climate, can also influence penetration rates. 

1 The Moody’s Analytics time series data for Households over age 75 based on the U.S. Census at this time is currently only available through 2016.

Spring Keynote: Collaboration is not an Option

The 2019 NIC Spring Conference luncheon keynote talk will be delivered by bestselling author, consultant and futurist Ian Morrison. Morrison is an internationally known specialist in long-term forecasting and planning, with an emphasis on the changing business environment in healthcare. Known for his many books and articles on the changing healthcare system – and notorious for his Scottish wit – Morrison is ideally qualified to bring into focus the coming challenges and opportunities facing the seniors housing and care sector. 

With a luncheon audience expected to exceed 1,200 leaders in the space, including a small but growing number of executives from the healthcare sector, Morrison will have the ear of many of America’s seniors housing and care decision makers.  

While most conference attendees are executives in real-estate based businesses, healthcare partnerships are expected to be an essential component to success in coming years. Healthcare stakeholders, who have an active interest in understanding the opportunities in senior care collaboration – but may never have done so before – are investigating potential partnerships as they seek to address the needs of their patients in a value-based world. 

As the healthcare system adjusts to a value-based model, and as fundamental shifts in demographics, consumer demands, payment systems and business models form a new paradigm of healthcare delivery and payment, the seniors housing & care sector will need to adapt. Collaboration with new healthcare partners will not be an option, but a requirement, in a system increasingly focused on achieving better outcomes at lower costs.  

Be prepared for an engaging and convincing account of what lies just ahead for the sector, and even for a touch of wry humor, as Morrison applies his unique experience and perspective to the task of inspiring us to think differently about the role of our sector within a larger system in flux.