Deep Dive: Memory Care Performance in the Primary Markets

It’s no secret that the U.S. population of seniors living with dementia is expected to grow in the coming years and thus the demand for memory care (MC) services is expected to increase as well. As a result of anticipated demand, there has been notable growth in memory care units, especially between 2011 and 2016. This has occurred in freestanding memory care properties as well as in properties that offer memory care as part of a continuum of service offerings.  This blog post explores these trends and looks at how well demand has held up and its resulting effects on occupancy. Read further for a deeper dive into memory care in the Primary Markets. 

What Do We Mean by Freestanding Memory Care? 

Freestanding memory care communities offer memory care as the only level of care, whether these properties have a single building, or several. Because many freestanding memory care properties have smaller unit counts than other seniors housing properties, NIC tracks those that have 16 or more units, rather than the 25 or more units and/or nursing care beds that we require at other types of properties. 

The community type data cut was first introduced to the NIC MAP® portal in 2016, partially in response to a growing request from our client base to be able to separate out properties that had a majority of memory care units or properties that were freestanding memory care. As of 1Q2019, 89% of the memory care communities that were open for business in the Primary Markets were freestanding, meaning only 11% were combined properties, and none were continuing care retirement communities (CCRCS). CCRCs are distinct from all other community types using this categorization and require both independent living and nursing care to exist on the same property. Additionally, 97% of all the open MC communities in the Primary Markets were operated by for-profit operators in 1Q2019.  

Freestanding memory care communities are relatively young among the community types that NIC tracks, with a median age of having been open for 16 years versus 19.5 years for independent living communities, 20 years for assisted living communities, 40 years for nursing care communities, and 35 years for CCRCs for the Primary Markets as of 1Q19. This reflects freestanding memory care being the newest product type offered among the group. 
Has occupancy hit the bottom for freestanding memory care in the Primary Markets? 

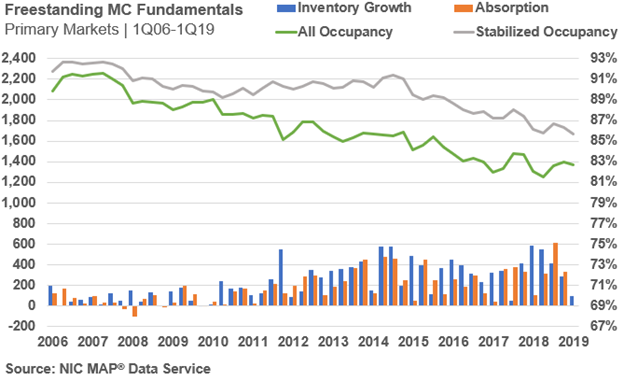
The chart above shows market fundamentals for freestanding memory care communities in the Primary Markets since 2006 when NIC began reporting the data. The broad trend since then has been falling occupancy rates as inventory growth outpaced demand (as measured by net absorption). Occupancy reached a recent low of 81.5% in the second quarter of 2018 as historical inventory growth dwarfed net demand by more than one third (11,743 units of inventory growth versus 8,438 units of net demand from Q1 2006 to Q2 2018).  Since then, freestanding memory care occupancy has increased by 120 basis points to 82.7% in Q1 2019. Stabilized occupancy stood at 85.7% in 1Q2019, 300 basis points higher than total occupancy, reflecting many units that have been opened, but not yet leased.    

The occupancy improvement reflects a strong year for freestanding memory care communities with 1,360 net units absorbed in 2018. The strongest recorded quarterly absorption for these communities was 611 units in 3Q2018. The strongest recorded quarterly inventory growth occurred in 1Q2018 with net 588 units coming online.  
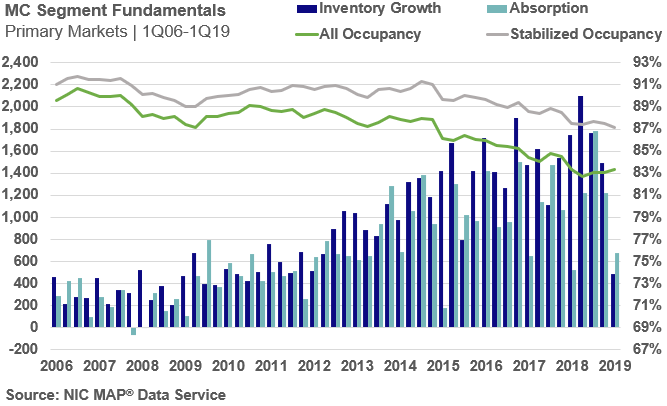
By Segment, Annual Inventory Growth meets Annual Absorption in 1Q2019. 

Freestanding memory care communities only account for 29.3% of the open memory care units in the Primary Markets. Looking at all memory care as a segment (i.e.: all open memory care units regardless of the property in which they are located), total open inventory in 1Q2019 equaled 87,025 units versus 25,472 units in freestanding memory care.   

The same broad trends of declining occupancy rates as inventory growth outpaced demand occurred for memory care as a segment.  The occupancy rate in the first quarter was 83.3% compared with 82.7% for stand-alone memory care units.   

It’s notable that net demand in the first quarter was stronger than in freestanding memory care (where net absorption was negative 1 unit), with 674 units absorbed in the memory care segment in the Primary Markets. That figure is down 541 units from 1,215 in the fourth quarter of 2018 but is up from 525 a year earlier in 1Q2018. Interesting to note is the recorded high of 1,778 units for memory care absorption for the Primary Markets in 3Q2018.  

Inventory growth of memory care units for the Primary Markets for 1Q2019 totaled 489 units, the fewest since 3Q2010, and 1,001 units less than 4Q2018’s inventory growth of 1,490 units. The recorded high for memory care inventory growth for the Primary Markets was 2,097 units in 2Q2018. 

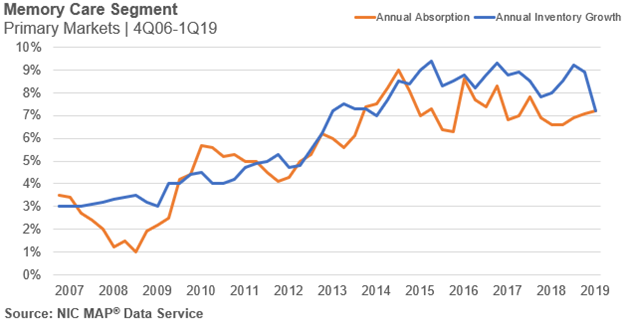
The chart below shows annual absorption (year-over-year percent change in occupied units) and annual inventory growth.  Both demand and supply show upward trends in the years since NIC has been reporting the data. The annual absorption and annual inventory growth for memory care for 1Q2019 were both 7.2%. This made 1Q2019 the first quarter where the annual inventory growth rate didn’t outpace the annual absorption rate since 3Q2014.  
Opportunity exists for seniors housing. 

Data through the first quarter of 2019 suggests that the bottom may have been reached for occupancy for both stand alone and continuum memory care units. Nevertheless, with occupancy still in the low 80% range, the sector faces challenges as operators and investors seek to meet their business plan requirements and pro formas. Although the first quarter of 2019 had some softer absorption and inventory growth, record high inventory growth and absorption occurred for both freestanding memory care communities and memory care as a segment in 2018.  The market will need some time to better establish an equilibrium position. Because of current predictions of rising dementia rates, and the special considerations associated with serving this population, operators who offer memory care should not only anticipate potential changes in demand when planning their offerings but also how to recruit and keep excellent employees who understand the needs of this population. While some investors prefer to partner with best-in-class operators with strong experience in stand-alone memory care with focused memory care offerings, others prefer operators with properties that offer multiple care levels to serve a wider range of needs (often AL and MC).   


196,000 Jobs Created in March 2019

The Labor Department reported that there were 196,000 jobs added in March, above the consensus expectation of 177,000.  This marked the 102nd consecutive month of job growth.  The latest three-month average is 180,000, less than last year’s 223,000 monthly average but still strong and consistent with more modest growth anticipated for 2019.

January was revised up from 311,000 to 312,000 and February was revised up from 20,000 to 33,000.  Combined, employment gains in January and February were 14,000 more than previously reported. Monthly revisions result from additional reports received from businesses and government agencies since the last published estimates and from the recalculation of seasonal factors.

In March, employment in health care rose by 49,000. In the past year, health care has added 398,000 jobs.  Notably, manufacturing employment fell by 6,000 positions after having seen steady growth of 22,000 positions on average over the past 12 months.

The unemployment rate held steady at 3.8% in March.  A broader measure of unemployment, which includes those who are working part time but would prefer full-time jobs and those that they have given up searching—the U-6 unemployment rate—remained at 7.3%.  This was the lowest rate since 2000.

Average hourly earnings for all employees on private nonfarm payrolls rose in March by four cents to $27.70. Over the past 12 months, average hourly earnings have increased by 3.2%, down from 3.4% last month.   For 2018, the year over year pace was 3.0% and in 2017 it was 2.6%.

The labor force participation rate, which is a measure of the share of working age people who are employed or looking for work fell to 63.0% in March from at 63.2% in February, very low but up from its cyclical low of 62.3% in 2015.  The low rate at least partially reflecting the effects of an aging population.

This report, in combination with other recent data on economic activity, will support the Fed’s recent position of pausing interest rate increases.

What Do Workers Want?

A conversation with human resources expert Valerie Armstrong on how to develop programs to match the needs of different generations. 

In a tight labor market, the recruitment and retention of top-quality staff is a big priority.  

The labor pool is not monolithic, however, according to Valerie Armstrong, a human resources expert who speaks at senior living forums.  It’s important to understand the motivations of different generations— older, more seasoned workers, millennials and the newcomers in Gen-Z. The creation of programs tailored to each group within the context of a community’s culture can help promote good hiring decisions while slowing turnover.   

NIC recently talked to Armstrong about strategies to find and keep good team members. She is a human resources business partner at Sodexo which provides services to senior living communities, including dining, facilities management and housekeeping.  

Here’s a recap of the conversation.   

NIC: What is your role at Sodexo?  

Armstrong: I have a multi–disciplinary role within human resources that includes onboarding, leadership and frontline training, engagement and retention. We train Sodexo employees as well as people employed by senior living communities. We are a true partner with senior living communities.   

NIC: What’s your approach?  

Armstrong: We help senior living communities brand themselves and market their stories to attract and retain team members at all levels from executive leadership to frontline staff. We help make sure the community’s branding, culture and behavior is aligned. It doesn’t matter what industry you’re in, if those three things are not aligned you will not be able to successfully identify and retain top talent.   

NIC: What are the different generations looking for in a workplace? 

Armstrong:  Many times, when employers start targeting certain groups, they leave others out. We need to take a broad and flexible approach. We have multiple generations in our workforce. That’s one of the things I talk about at industry meetings. Baby boomers are looking for stability. They want to know what the work hours will be and what they’ll be doing. Boomers want a career path they can see. They also have so much to offer the younger generations.   

Gen-Z and millennials want to learn and engage. So their onboarding plans and career paths look a little different than those for the boomers. Millennials want some flexibility to try new things and Gen–Z wants the ability to help build their own career paths.   

We cannot lose sight of diversity and inclusion. Sodexo has a platform on diversity inclusion because it is important to younger people. In fact, 77 percent of younger people will make their decision whether or not to work for an organization based on diversity & inclusion programs.    

If you step back and think about it, everything the younger generation does is about their brand. Gen-Z displays their lives like a museum on social media. They are the curators who invite us in and provide a tour.  This is their brand: a self-portrayal of how they identify themselves.  

NIC: What are some effective strategies?  

Armstrong: Let people know what it’s like to work at the community. It doesn’t have to be a high cost approach. Grassroots efforts are best. It could be something as simple as hosting a “Bring Your Friend to Work Day.” Or asking employees for referrals. We partner with job corps programs and veterans groups. Tap into community groups such as the YMCA and Lions Clubs.  At Sodexo, we may be working with a college down the street and be able to tap into that employee pool.   

The strategy is similar to the sales strategies that senior living communities use to find new residents by tapping into referral sources and local organizations.  Each community structures its own local approach.   

NIC: What about turnover?  

Armstrong: Turnover is extremely costly for any organization. When you have a lot of turnover, you also start to lose the essence of your culture. Reward and recognition programs work well. Flexible scheduling is a big plus for the younger generations and working parents.  Primarily, we focus on retention programs that meet the employees’ needs with coaching, communication and engagement. You have to listen and follow up with them.  

Over the last two years, we’ve focused on a two-plus-two coaching program. Conversations are held with employees at least quarterly to discuss two things they do exceptionally well and two things that they can work on to improve. That is the foundation of their career development plan.   

When a person joins a senior living community as frontline hourly employee, they may not be familiar with structured performance reviews once or twice a year. The two–plus-two coaching provides reinforcement and direction in a way that is positive, informal and approachable.  It’s an easy win. 

NIC: How do the different generations feel about feedback? 

Armstrong:  Gen–Z and millennials want frequent feedback. Gen–Z likes face–to–face engagement to help them see where their career is headed and how they can be successful. Baby boomers get a lot of personal reward just helping out their peers and engaging with their peers. They have a lot to offer and they like to engage with the younger workforce. Opportunities for mentoring and team projects are very positive.  

NIC: Minimum wages are increasing in a lot of places. Is the wage rate a big factor in worker recruitment and retention? 

Armstrong: We have to comply with state and federal rules on wage increases. But wages are not everything.  We focus on the enrichment of individuals’ lives.    

NIC: What would you like readers to take away from our discussion here today?  

Armstrong:  This is really all about connection. The recruitment and retention process is about that one–on–one connection. It sounds simple, but it’s not. It takes a well thought out strategy and follow through to make it work.   

Valerie Armstrong is director of human resources for Sodexo Seniors in North America. Connect with her on LinkedIn.  


### 

Feb. 13, 2019 

janekadler@gmail.com 

Game Changer! NIC MAP® Introduces Rate Tiers

NIC MAP® Seniors Housing Rate Tiers

Similar to the intent of “class categorizations” seen across other commercial real estate property types, NIC MAP® has recently developed a “rate tiers” approach to our seniors housing property database that is quantitative and objective, with a goal to further segment our data for our clients. Useful to investors, analysts and senior living operators who wish to benchmark their properties to properties with similar rate structures, this approach allows NIC to promote greater transparency within the seniors housing property type and creates greater comparability to other commercial real estate property types.

  • The NIC MAP Seniors Housing Rate Tiers Report provides a historical time series of average market rates (AMRs) and AMR annual rate growth, occupancy and inventory for majority independent living (IL) or majority assisted living (AL) property types by rate tier and metropolitan market for the 31 Primary Markets.
  • Additionally, the report includes market aggregates for the 31 Primary Markets, Secondary Markets (32-99), and the 99 Primary and Secondary Markets.
  • Defined uniquely for each metropolitan market (as opposed to a national average), three rate tiers for each metropolitan area have been estimated based on average market rate (AMR) data that is segmented by quartiles into three groupings: top tier (i.e., top quartile), middle tier (i.e., middle two quartiles), and bottom tier (i.e., bottom quartile). Each quarter, a property is classified into one of these three categories, and the designation of a property can change from one quarter to the next.
  • The NIC MAP Seniors Housing Rate Tiers Report has a “same-store” methodology for computing rate growth within each tier. Year-over-year rate growth is computed by using only the properties included within a respective rate tier from one period to the next.

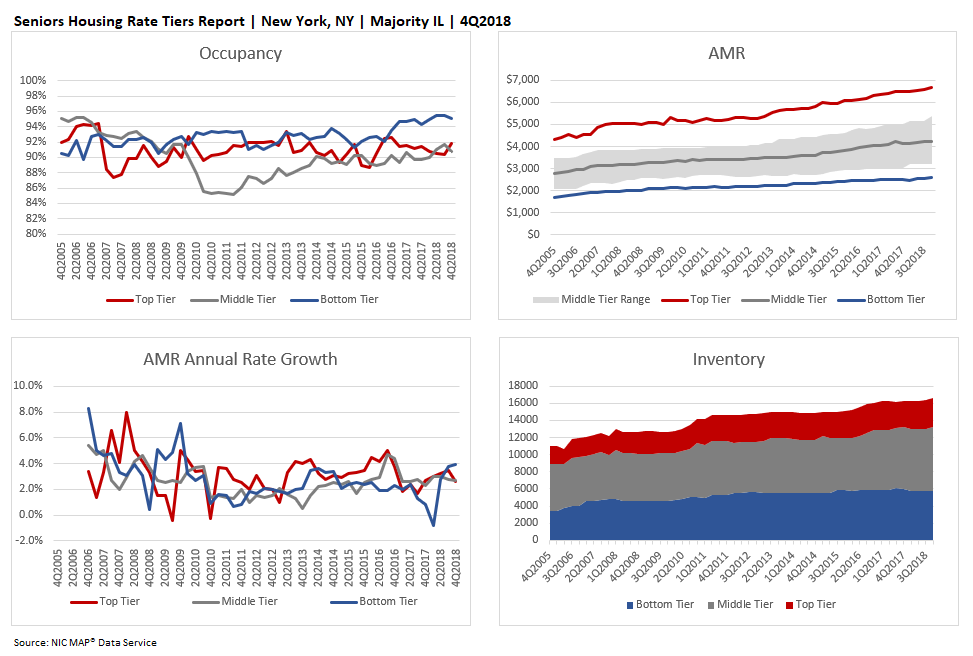
The example below shows the standard four charts found in this report for the New York metropolitan market from 4Q2018.

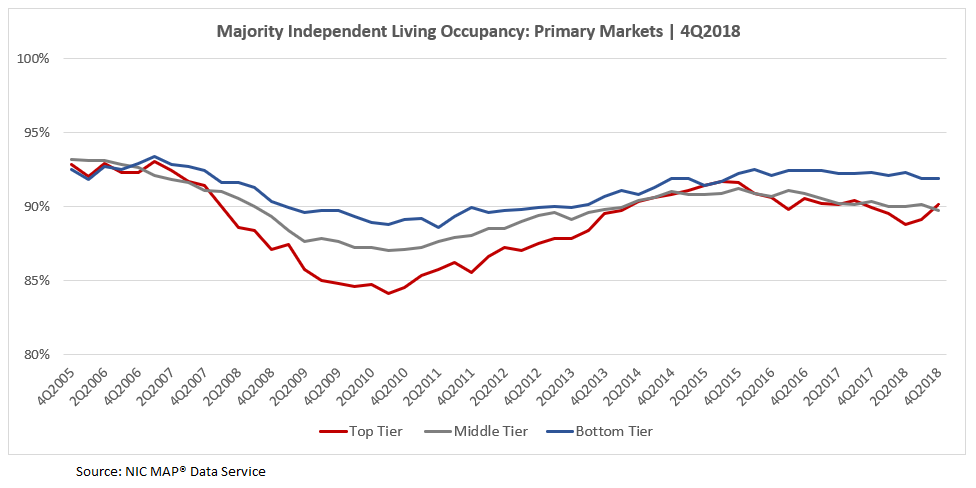
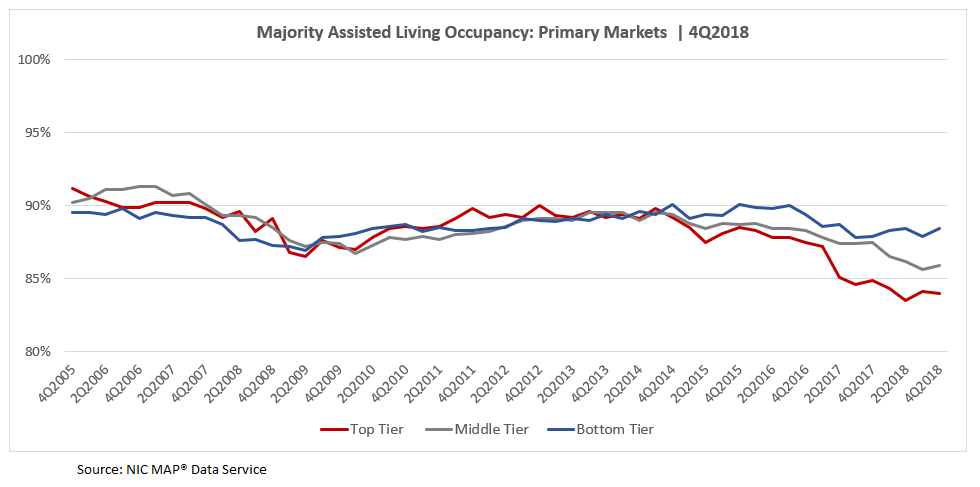
The following charts display occupancy by NIC’s three rate tiers for majority independent living and majority assisted living across the time series, aggregated for the 31 Primary Markets.

The data tells an interesting story in that independent living and assisting living occupancy results by rate tier have followed different patterns. The occupancy rate for bottom tier majority independent living properties in the 31 Primary Markets has generally outpaced the top and middle tiers since 3Q2006. The occupancy “spread” by rate tier was the greatest during and coming out of the Great Recession, perhaps due to the greater affordability of bottom tier properties, which may have allowed them to maintain higher occupancy rates than the top and middle rate tiers. More recently, majority independent living occupancy rates for the three rate tiers converged and reached a near-term peak close to 91% in the second and third quarters of 2015. Since then, and as the market has softened, the difference in occupancy rates between the bottom and top tiers widened to as much as 3.5 percentage points in 2Q2018, when the average occupancy rate of majority independent living properties in the 31 Primary Markets was at a 4-year low point. Currently, in 4Q2018, bottom tier majority independent living occupancy (91.9%) is 1.8 percentage points higher than in the top tier (90.1%).

However, rate tier occupancy for majority assisted living property types in the 31 Primary Markets followed a different pattern. Bottom tier majority assisted living property occupancy rates were lower than the top and middle tiers leading into and through most of the Great Recession. Coming out of the Great Recession, majority assisted living inventory grew at a faster pace than majority independent living, and occupancy across rate tiers was relatively narrow until it began to diverge around the fourth quarter of 2014, as strong supply growth outpaced demand. Since then, bottom tier occupancy rates have exceeded the top and middle tiers. In 4Q2018, majority assisted living occupancy in the 31 Primary Markets was 85.4%, near its record low rate of 85.3% reached in 2Q2018, when the difference between the bottom and top tiers was the widest at 4.9 percentage points. As of the fourth quarter, the difference between the bottom and top tiers is 4.4 percentage points.

In the coming months, NIC will begin to explore a number of intriguing questions raised by the data:

  • Are markets with high top tier AMR annual growth rates dominated by large chain properties?
  • Do markets with high variability between the top and bottom tiers suggest the need for greater local focus when analyzing the market fundamentals?
  • What are the benefits and drawbacks of investing in metropolitan markets with wide or narrow variations in top and bottom tier pricing?
  • Do top tier properties tend to be newer and bottom tier properties older?
  • Are top tier properties located in neighborhoods with higher property values than bottom tier properties?
  • Does the greater affordability of bottom tier properties help insulate them from occupancy pressures in times of fluctuating local demographic and economic conditions?
  • How does AMR annual rate growth relate to changes in inventory and occupancy by rate tier?

The “rate tiers” approach to NIC’s seniors housing property database is, indeed, a “game changer.” This new report provides NIC MAP clients another way to segment the data with increased granularity, allows for greater comparability to other commercial real estate property types, and delivers on NIC’s mission to promote greater transparency within the seniors housing sector.

2019 NIC Seniors Housing Boot Camp: The Art of Assessing the Deal

Seniors housing isn’t quite like other commercial real estate investments. Returns and valuations can be significantly influenced by operational performance which makes acquisition and investment decisions complex. Professionals new to the industry can find underwriting a deal difficult and challenging.     

To help these newcomers get a leg up, NIC is hosting the 2019 NIC Seniors Housing Boot Camp: The Art of Assessing the Deal, on Wednesday, April 10 from 10 a.m. to 4:30 p.m. at the AC Hotel Charlotte City Center.  

Designed for professionals with 1-3 years of seniors housing experience, Seniors Housing Boot Camp is an interactive workshop for professionals looking to familiarize themselves with the unique aspects of investing in seniors housing. 

Individuals with deal-making experience in other sectors will quickly gain practical knowledge by analyzing a “real” seniors housing acquisition opportunity with the input of talented industry veterans.  

Sponsored by NIC’s Future Leaders Council, the event is structured around a case study which includes all the details from a deal that was negotiated in the “real world”. Participants will learn how to evaluate a seniors housing opportunity from experts and then formulate a bid on a property. The actual outcome of the case study will be revealed at the end of the program.  

Prior to boot camp, participants will receive the case study outlining the key characteristics of a potential acquisition opportunity. Throughout the morning, experts will provide detailed descriptions on how to analyze the deal. Topics include: 

  • Supply and demand market dynamics 
  • Occupancy 
  • Operational performance 
  • Net income 
  • Rents 
  • Cost of care 
  • Staffing 

Participants will learn how to use tools such as the NIC MAP® Data Service, gaining skills which will help them better navigate the opportunities and challenges of the sector. They will then apply what they learn in small teams as they develop a bid for the property. Each group is guided by a table captain, a member of NIC’s Future Leaders Council.   

This year’s boot camp, co-chaired by council members Brandi Healey, Ryan Chase, Fritz Kieckhefer and Richard Wang, features several notable programming changes. It will feature a joint networking reception bringing together boot camp attendees and members of the Future Leaders Council.  The reception is a unique networking opportunity for Boot Camp attendees and Future Leaders Council members alike.   

Industry icon John Moore, the Chairman and Chief Executive Officer of Atria Senior Living, will be the keynote luncheon speaker. Moore will provide his insights into the trends impacting the industry and the major drivers shaping the future of seniors housing real estate.  

At the end of the day, teams will present their property bids along with the rationale for their offers. The results of the actual deal will be discussed so that participants can judge their work against the actual outcome. This aspect of the workshop provides attendees a chance to walk through a deal from start to finish. It’s also a great opportunity to network and get to know the future leaders of the industry.  

The 2019 Seniors Housing Boot Camp is fully booked. Learn more about future workshops here.