Market Fundamentals Amid Challenging Time for Skilled Nursing

The skilled nursing industry is currently facing numerous challenges, but many operators do see long-term opportunities.

It is no surprise that the COVID-19 pandemic had a tremendous impact on skilled nursing occupancy. But what exactly happened? This article provides the insights on supply and demand dynamics and the disparities between property level occupancy rates for freestanding skilled nursing properties.

Demand and Supply Dynamics for Freestanding Skilled Nursing Properties (2017 – 2022)

The COVID-19 pandemic caused an unprecedented global health crisis and human tragedy. Among the most affected groups and property types were older frail adults and skilled nursing properties. Indeed, the health crisis led to a dramatic loss in occupied beds for the skilled nursing sector. From the first quarter of 2020 to the first quarter of 2021, demand, as measured by occupied stock or the change in net absorption, fell by about 62,000 beds on a net basis for freestanding skilled nursing properties for the 31 NIC MAP® Primary Markets aggregate. This was equivalent to 15% of the pre-pandemic (1Q 2020) occupied bed stock. Net absorption rates averaged about negative 4% on a quarterly basis over this four-quarter period.

Subsequently, beginning in the first quarter of 2021 through first quarter 2022, demand patterns reversed course and the net absorption rate averaged 1.1% on a quarter-to-quarter basis — equivalent to over 15,350 beds absorbed on a net basis over this four-quarter period. Notably, 25% of the occupied beds lost for the Primary Markets aggregate during the first year of the pandemic (1Q 2020 to 1Q 2021) had been recovered during the second year of the pandemic (1Q 2021 to 1Q 2022). While this was a very welcome positive trend and does indicate light on the horizon, the sector continues to face concerning financial challenges unfortunately for a number of reasons. These reasons include very low occupancy rates, Medicare funding cuts and underfunding of Medicaid reimbursement in many states, incrementally higher expenses, and staggering staffing shortages restricting admissions of residents into some skilled nursing properties.

Interestingly, however, as Exhibit 1 below shows, supply and demand for freestanding skilled nursing properties were contracting even prior to the pandemic. Based on historical data since 2017, quarterly net absorption rates and inventory growth averaged negative 0.2% and negative 0.1%, respectively, over the period from 1Q 2017 to 1Q 2020, the three years preceding the pandemic.

Further, the data show that during the height of the pandemic and prior to widespread vaccination among residents (from 1Q 2020 to 1Q 2021), the decline in inventory for skilled nursing properties continued but at a much slower pace compared with historical patterns and averaged negative 0.03% quarter-to-quarter, less than one third the rate at which inventory had been declining prior to the pandemic (negative 0.1%).

Exhibit 1 – Supply & Demand Dynamics – Freestanding Skilled Nursing Properties

2022 NIC Notes Blog Skilled Nursing Facility Fundamentals Graph1 V2

The question is, why did this slowdown in the loss of skilled nursing beds occur during the first year of the pandemic? Perhaps fewer beds were taken offline because bed capacity was simply needed during the height of the pandemic to take care of the unprecedented numbers of ill older adults.

In hindsight, skilled nursing properties generally stood their ground and navigated through extremely uncertain and decentralized responses to COVID-19 when they were needed the most to care for individuals at high-risk for severe illness from COVID-19 and went even further by accepting COVID-19 patients from overwhelmed hospitals in many states.

During the second year of the pandemic (1Q 2021 to 1Q 2022), skilled nursing inventory decline accelerated once again, averaging negative 0.2% quarter-to quarter, twice the rate recorded prior to the pandemic (negative 0.1% quarter-to-quarter over the three years leading up to the pandemic, from 1Q 2017 to 1Q 2020), and nearly seven times the rate recorded during the first year of the pandemic (negative 0.03% quarter-to-quarter over the period from 1Q 2020 to 1Q 2021).

While vaccines have proven to be effective at limiting severe illness, hospitalizations, and fatalities from COVID-19, and the level of agility, preparedness and responsiveness among skilled nursing properties has never been higher, these statistics show that inventory nonetheless contracted during the second year of the pandemic. The inventory decline may have been the result of:

  • Closures due to inadequate funding leading to financial stress among some operators amid very low occupancy rates and incrementally higher expenses,
  • A move to more private rooms thereby removing some bed capacity at properties, and
  • The staffing shortages limiting admissions and occupancy recovery.
Occupancy Overview – Freestanding Skilled Nursing Properties

Since the outbreak in early 2020, the COVID-19 pandemic has challenged every aspect of the skilled nursing sector. In the span of one year, occupancy for freestanding skilled nursing properties for the Primary Markets fell 12.8 percentage points, from 86.3% in 1Q 2020 to a record low of 73.5% in 1Q 2021. Since then, occupancy climbed to 77.3% in 1Q 2022, up 3.8 percentage points from its lowest level but remaining 9.0 full percentage points below 1Q 2020 pre-pandemic levels. Additionally, 21% of freestanding skilled nursing properties reported an occupancy rate in 1Q 2022 at or above pre-pandemic 1Q 2020 levels, according to NIC MAP® data.

The occupancy loss for skilled nursing in the Primary Markets during the first year of the pandemic was mainly a function of a demand contraction. Whereas the occupancy loss for the private pay senior housing sector over the same period was a function of both an increase in supply and a decrease in demand. As background, occupancy for private pay senior housing properties for the Primary Markets fell by 9.2 percentage points from 1Q 2020 to 1Q 2021, 3.6 percentage points less than skilled nursing.

While the uncertainty bands remain wide in terms of when occupancy rates for skilled nursing properties will return to pre-pandemic levels, a key question is whether obtaining a sustainable level of occupancy and revenue growth will be sufficient to grow NOI and recoup the losses from the severe downturn in occupancy rates, the incrementally higher expenses, and inflationary impact associated with the pandemic.

Exhibit 2 – Occupancy Recovery – Freestanding Skilled Nursing Properties vs. Senior Housing Properties

2022 NIC Notes Blog Skilled Nursing Facility Fundamentals Graph2 V2

Occupancy Distribution

Average occupancy rates provide a window into an overall market’s performance. But in a time of severe and prolonged downturn, it is important to assess occupancy distribution to get a better understanding of property level performance. Exhibit 3 below depicts occupancy distribution for freestanding skilled nursing properties for the Primary Markets aggregate.

The pandemic triggered significant disparities between property level occupancy rates. For example, the spread between quartile 3 property level occupancy rates and quartile 1 (known as the interquartile range, which represents the middle 50% of the data), jumped to roughly 20 percentage points in 1Q 2021, the highest it has been since NIC MAP began reporting the data in 2005. In 1Q 2020 before the pandemic began to influence the skilled nursing sector, the interquartile range was relatively smaller at 14.2 percentage points, 5.7 percentage points below 1Q 2021.

Further, 75% of freestanding skilled nursing properties within the Primary Markets had an occupancy rate equal to or above 80.8% (quartile 1) in 1Q 2020, as depicted in the box plot in Exhibit 3 below. At the height of the pandemic in 1Q 2021 and based on the detailed distribution compiled by NIC Analytics, only 35% of skilled nursing properties had an occupancy rate above 80%, 15% had occupancy between 80% and 75%, and 50% had an occupancy rate below 75% (median), including 25% of properties with an occupancy rate below 64.1% (quartile 1).

In 1Q 2022, as demand increased for four consecutive quarters, the share of properties with occupancy rates above 80% grew to about 50% (median 79.4%). While 1Q 2022 stats have improved, 25% of skilled nursing properties continue to experience occupancy below 68.9% (quartile 1). Owners of these properties may find access to capital challenging since many may have been relying on COVID-19 era policies to support operations.

Exhibit 3 – Occupancy Distribution – Freestanding Skilled Nursing Properties2022 NIC Notes Blog Skilled Nursing Facility Fundamentals Graph3 V2

The recent improvements in skilled nursing market fundamentals have demonstrated that vigilance and preparedness among skilled nursing properties are key elements for protecting staff and residents from COVID-19 and restoring occupancy.

Methodology

In this analysis based on NIC MAP data, powered by NIC MAP Vision, we discuss recent market fundamentals for the skilled nursing sector and how it is faring after two years of the pandemic. We evaluate supply and demand dynamics for freestanding skilled nursing properties within the 31 NIC MAP Primary Markets (Primary Markets) since 2017. Additionally, we examine property-level occupancy distribution to get a better understanding of how widespread the effects of the pandemic have been.

The analysis examined approximately 4,000 freestanding skilled nursing properties within the Primary Markets. Note that combined properties offering at least two types of service and life plan communities (LPCs)/continuing care retirement communities (CCRCs) were excluded from this analysis.

—

To learn more about NIC MAP data, powered by NIC MAP Vision, an affiliate of NIC, and accessing the data featured in this article, schedule a meeting with a product expert today.
Financing Market Faces Headwinds, Rides Tailwinds

With the Federal Reserve taking aggressive steps to curb inflation, senior living stakeholders are sizing up the possibilities.

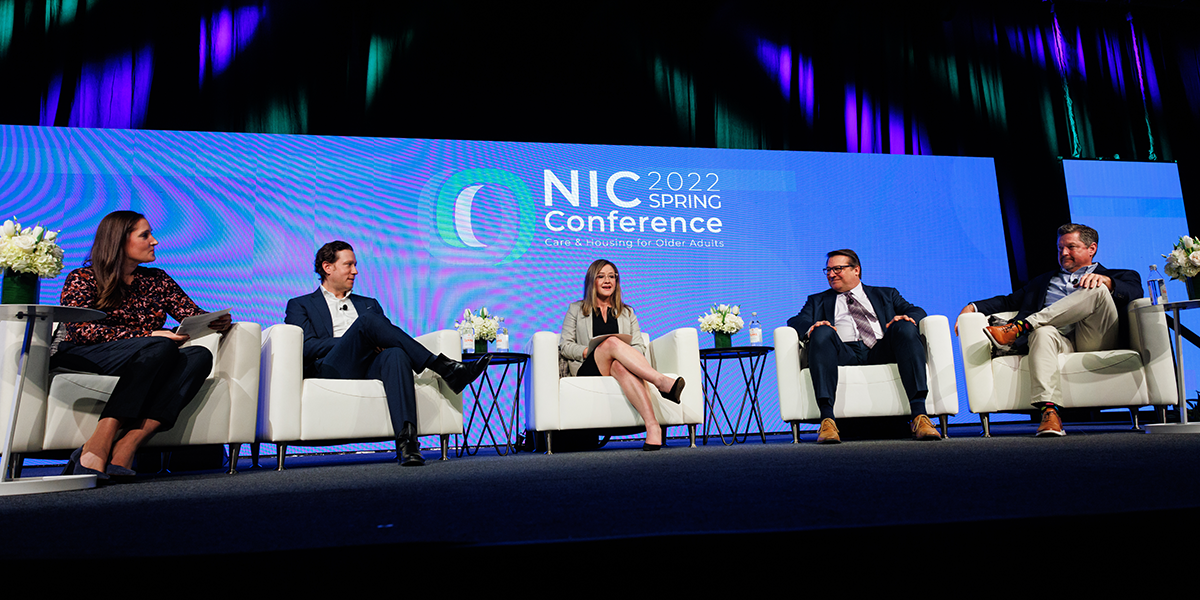
2022 NIC Spring Conference Session: “Debt & Equity Trends in Senior Living.”

With the Federal Reserve taking aggressive steps to curb inflation by raising interest rates through several hikes, senior living stakeholders are sizing up the possibilities of a slowing economy and higher debt costs. The labor shortage is another big concern.

Despite the headwinds, investors, lenders, and borrowers remain bullish on the senior living sector. Market fundamentals are continuing to improve as, hopefully, the pandemic recedes while a big surge of aging baby boomers is finally on the horizon.

2022 NIC Notes Blog May Debt and Equity Photo1 1200x600

“The industry has a lot of tailwinds,” said Elliot Pessis, managing director at Harrison Street, a Chicago-based investment fund. “That’s why we are long-term investors.”

Pessis joined a panel of lenders and investors during a session on debt and equity trends at the recent 2022 NIC Spring Conference in Dallas. Session moderator Morgin Morris, senior vice president, KeyBank Real Estate Capital, kicked off the discussion with a lightning round on key economic indicators.

The panel agreed interest rates will move higher, but cap rates could hold steady due to the high amount of liquidity in the market. The labor situation should gradually improve as more people return to work and the labor force participation rate rises.

In an innovative twist, session panelists were asked questions by industry stakeholders on video. The first question addressed the impact of higher interest rates.

Costs will rise, but the panelists expect to see more creative financing packages. “There’s a ton of deal volume out there,” said panelist Jessica Johnson, managing director, Healthcare Banking, Western U.S., BOK Financial. “But the deals that pencil out are harder to come by and it takes more work to get there.” She added that the focus is on high quality operators that understand the senior living sector and know their local market.


Selective Funding for Development

Another video questioner asked about financing trends for new construction vs. value-add acquisitions.

New development will continue to remain at a relatively low volume for now, according to panelist Darrin Smith, executive vice president, Investments, Sabra Health Care REIT. He cited the reasons as compressed operating margins because of the labor shortage and the rising costs of lumber and other materials putting the total cost to build under pressure. The silver lining is that the product that came on the market during the pandemic will be absorbed, he said.

Construction deals are picking up at BOK Financial, according to Johnson. Projects put on hold during the pandemic are now starting to seek funding. “Developers and equity partners are getting comfortable with the fact that they will have to accept lower returns initially and then increase rents over time,” she said.

2022 NIC Notes Blog May Debt and Equity Photo2 1200x600

Johnson noted the tremendous amount of equity in the market fueling interest in new development. Also, more lenders are getting into the space to put their money to work. Rates and cost of funds are rising, but spreads are compressing, she noted, helping to counteract the hikes. “Banks are becoming more competitive,” she said.

Harrison Street is partnering on development deals but focuses on higher barrier-to-entry markets. “We are being very judicious with capital,” said Pessis. He hasn’t seen many distressed property sales, a situation he attributes to lenders that stepped up during the pandemic to help their borrowers in addition to the resiliency of the sector.

BOK’s Johnson noted that skilled nursing properties benefited from federal government assistance during the pandemic. Some states have also helped by raising Medicaid rates, according to Sabra’s Smith. Florida, for example, recently passed a 7% increase in Medicaid reimbursement rates for nursing homes.

Lenders are watching capital expenditures. They want to know the building will still be a high-quality asset at the end of loan term. “We need to make sure there is reinvestment in the building,” said KeyBank’s Morris.


Underwriting Under Review

The pandemic has altered underwriting standards, the panelists said.

The most recent Ziegler NIC Lender Survey showed a wide variety of underwriting parameters leading to various valuations. Some lenders are underwriting COVID-related expenses but not the funds received to help support operations. Other lenders are underwriting all revenues and expenses. “Borrowers need to understand why and how lenders are underwriting the deals,” said panelist Don Husi, managing director at Ziegler Capital Markets.

2022 NIC Notes Blog May Debt and Equity Photo3 1200x600

Another big challenge is how to underwrite labor costs. Financial models should include a wage sensitivity analysis, according to Sabra’s Smith. “Partner with the right operators that understand labor issues,” advised Smith. In many cases, the panelists said, labor expenses are offsetting rental rate increases.

New debt trends are impacting the market. Banks are eager to lend, and debt funds are getting more creative, but bond buyers are risk averse, the panelists said.

Lenders are focused on the quality of operators and finding ways to bridge the gap when a property has upside, but insufficient cash flow. BOK Financial is working more with mezzanine lenders and structuring revolving credit facilities so owners can leverage as much equity as possible.

In wrapping up, the panelists expect some continued pain over the next 12-24 months as the sector continues to recover from the pandemic. But their overall outlook for the industry is quite optimistic given its resilience and the growth of the aging population. “A challenging environment is nothing new,” said Johnson. “Our industry is needs-based and will be more so in the future as baby boomers age.”

Employment Increased by 428k in April, Jobless Rate Unchanged at 3.6%

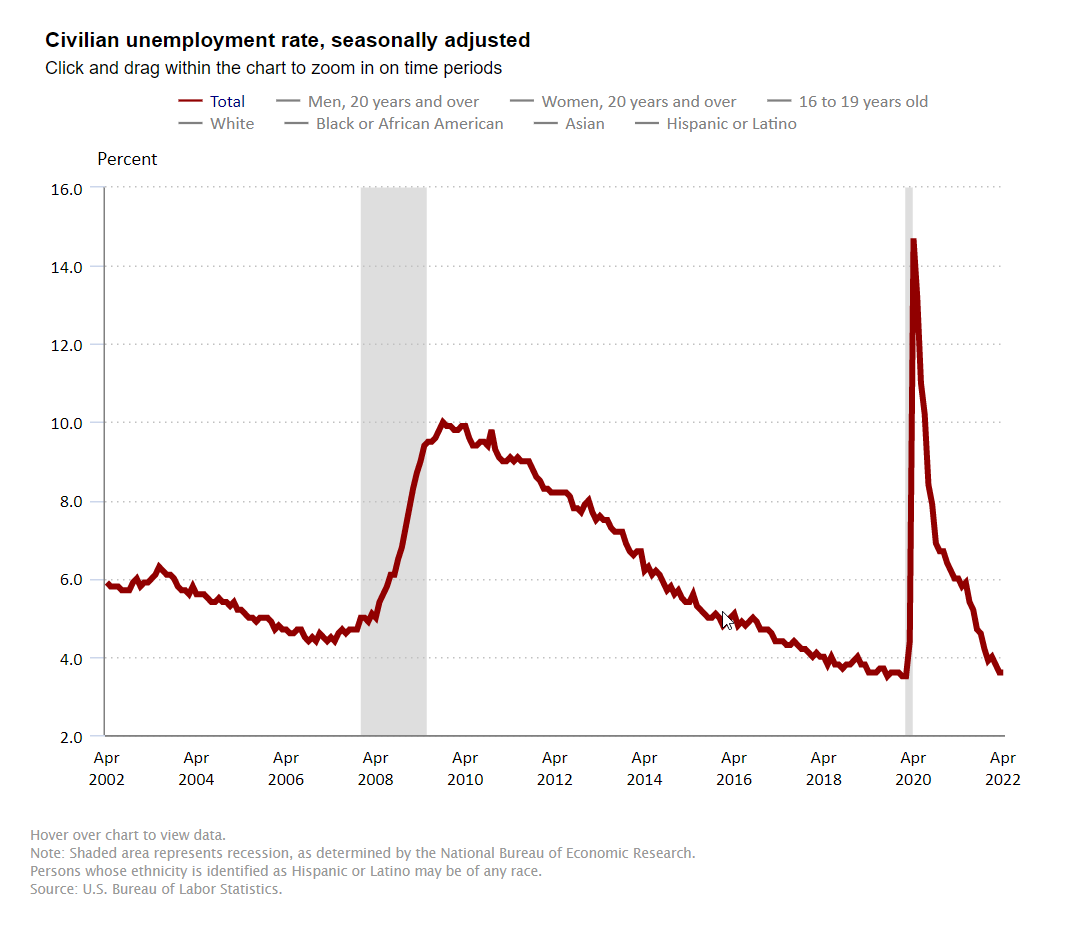
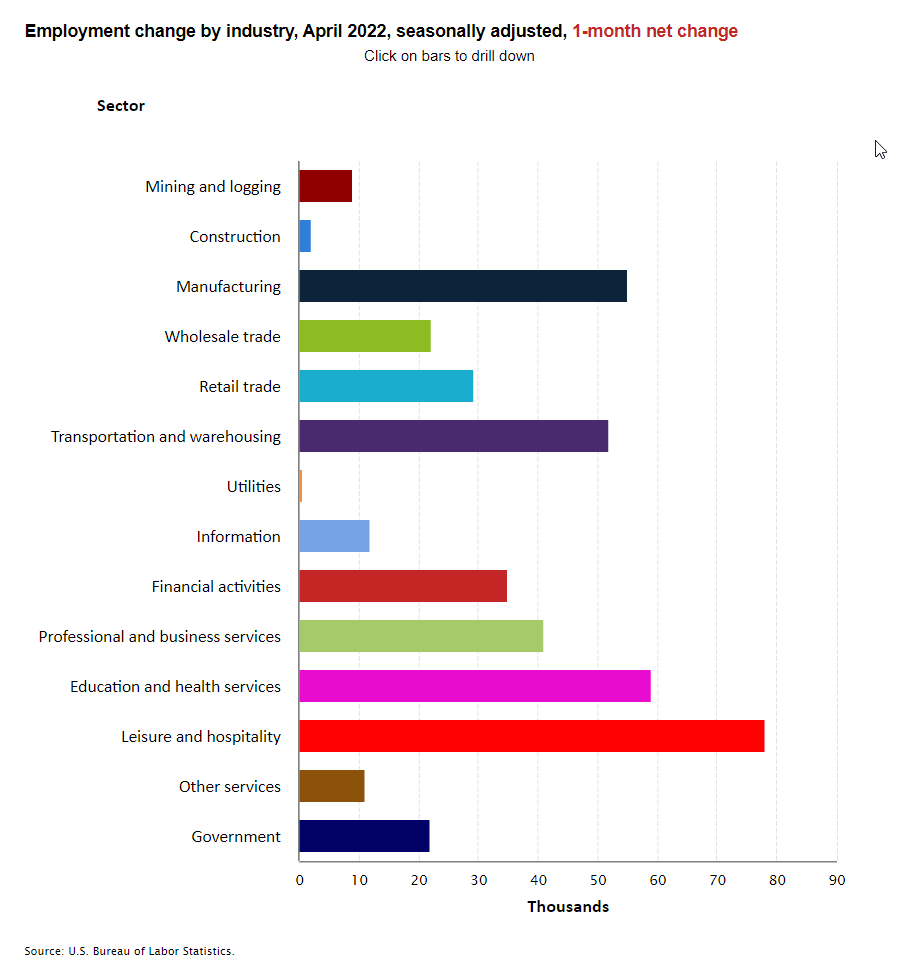
The Labor Department reported that nonfarm payrolls rose by 428,000 in April 2022 and the unemployment rate held steady at 3.6%.

The Labor Department reported that nonfarm payrolls rose by 428,000 in April 2022 and the unemployment rate held steady at 3.6%. The report confirms that the labor market remains resilient, despite the war in Ukraine and on-going supply-chain pressures. Concerns about rising wage costs and inflation are also backed by this report. Average hourly earnings for all employees on private nonfarm payrolls rose by $0.13 in April to $31.85. This was a gain of 5.5% from year-earlier levels, just slightly less than the 5.6% gain seen in March.

The data shows that the labor market continues to gain momentum and wage growth is accelerating. The report strengthens the Federal Reserve’s intention of raising interest rates further following the 0.50 percentage point hike in the fed funds rate announced earlier this week.

2022 NIC Notes Blog Employment May Unemployment Rate GraphV2

Jobs grew by an average of 523,000 per month in in the past three months, down from the three-month average of 602,000 in February 2022. Revisions subtracted 39,000 to total payrolls in the previous two months. Nonfarm payrolls were still down by 1.2 million or 0.8% from their pre-pandemic level in February 2020. The market consensus had been for a gain of 380,000.

In a separate survey conducted by the BLS, the jobless rate was unchanged at 3.6% in April 2022. The jobless rate is only 0.1 percentage point above the pre-pandemic level of 3.5% seen in February 2020, and well below the 14.7% peak seen in April 2020. The number of persons unemployed was essentially unchanged at 5.9 million but was still above the 5.7-million-person level seen prior to the pandemic.

Among the major worker groups, the unemployment rates for adult women (3.2%), adult men (3.54%), teenagers (10.2%), White (3.2%), Black (5.9%), Asian (3.1%), and Hispanic (4.1%) were little changed over the month.

The labor force participation rate fell 0.2 percentage point to 62.2% in April and was below the February 2020 level of 63.4%. The employment to population ratio was 60.0%, below the February 2020 level of 61.2%.

The report also showed that workers are returning to their place of work. Roughly 7.7% of employed persons teleworked because of the pandemic, down from 10.0% in the prior month, 23% in February 2021 and more than one third at the height of the pandemic.

2022 NIC Notes Blog Employment May Employment Change Graph

The April underemployment rate or the U-6 jobless rate was 7.0%, up from 6.9% in March 2022. This figure includes those who have quit looking for a job because they are discouraged about their prospects and people working part-time but desiring a full work week.

Employment in health care rose by 34,000 in April. Employment in health care was down by 250,000, or 1.5% from its level in February 2020. Employment in nursing care facilities rose by 900 positions to 1.345 million but was 44,000 less than year-earlier levels.

Executive Survey Insights | Wave 40: April 4 to May 1, 2022

Wave 40 survey includes responses from April 4 to May 1, 2022, from owners and executives of 65 senior housing and skilled nursing operators.

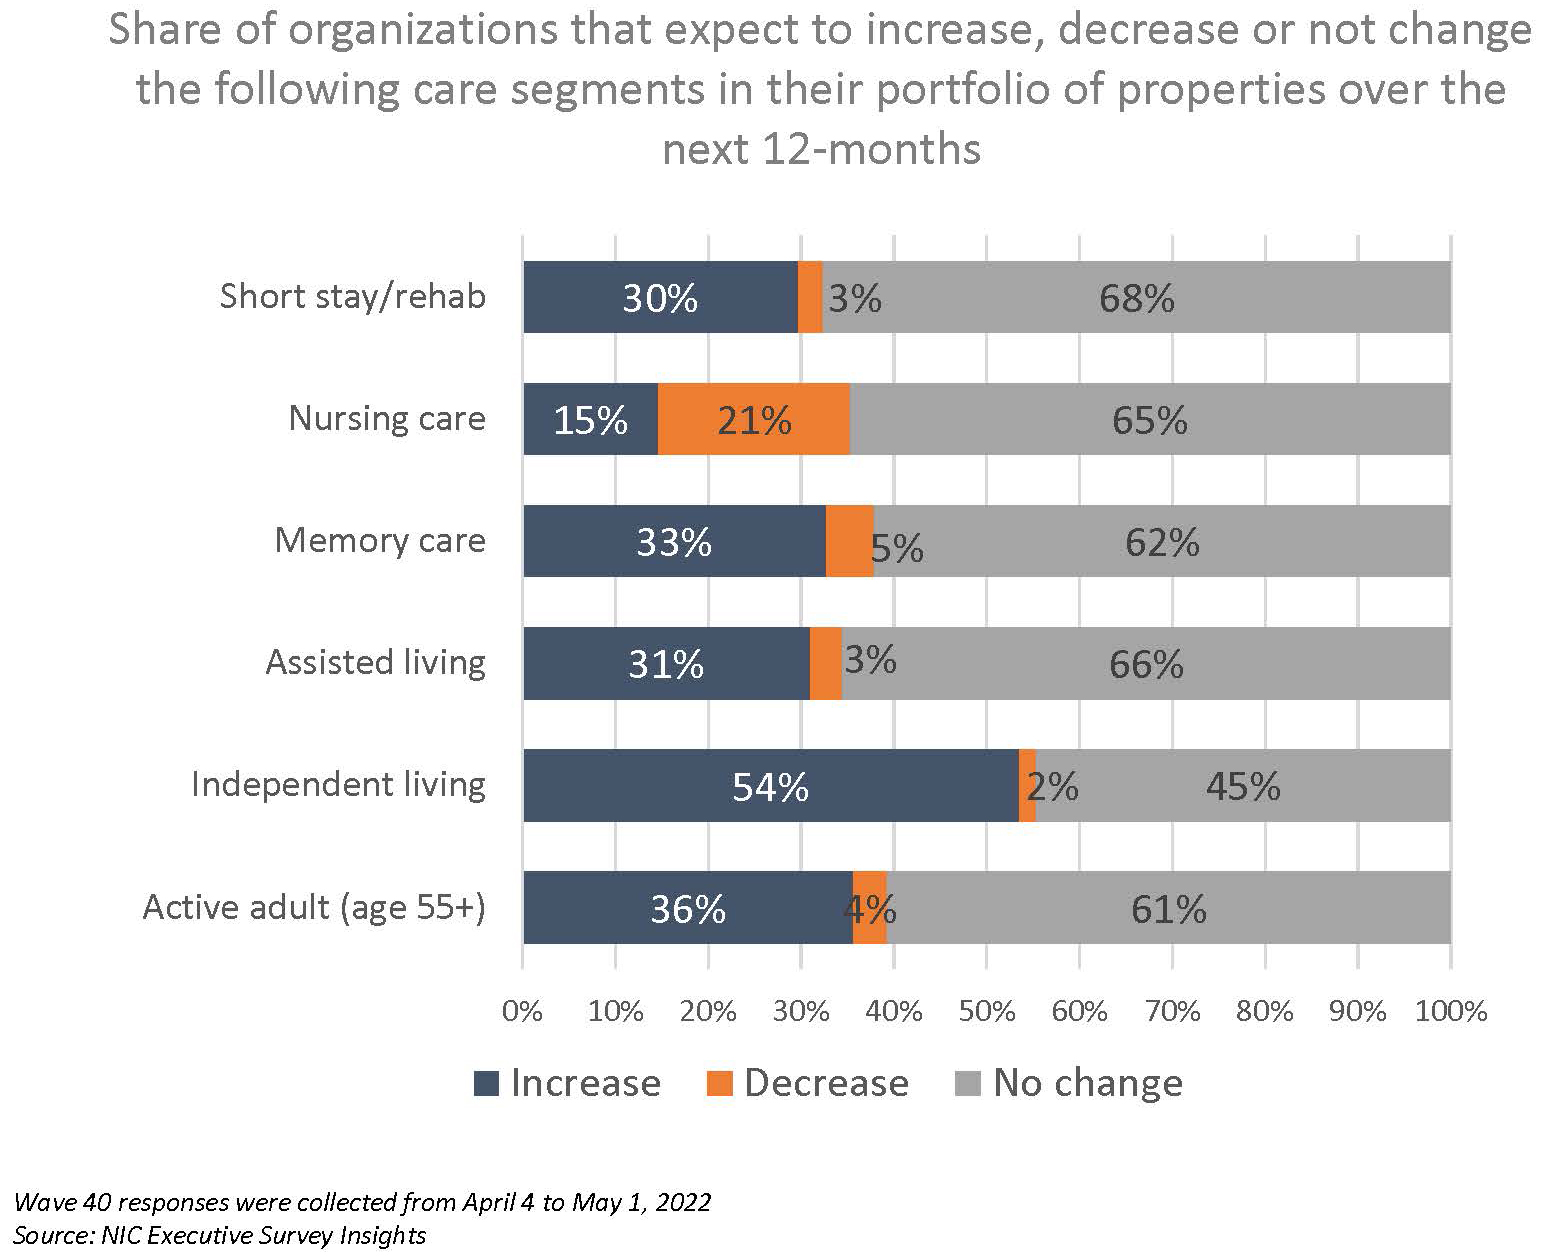
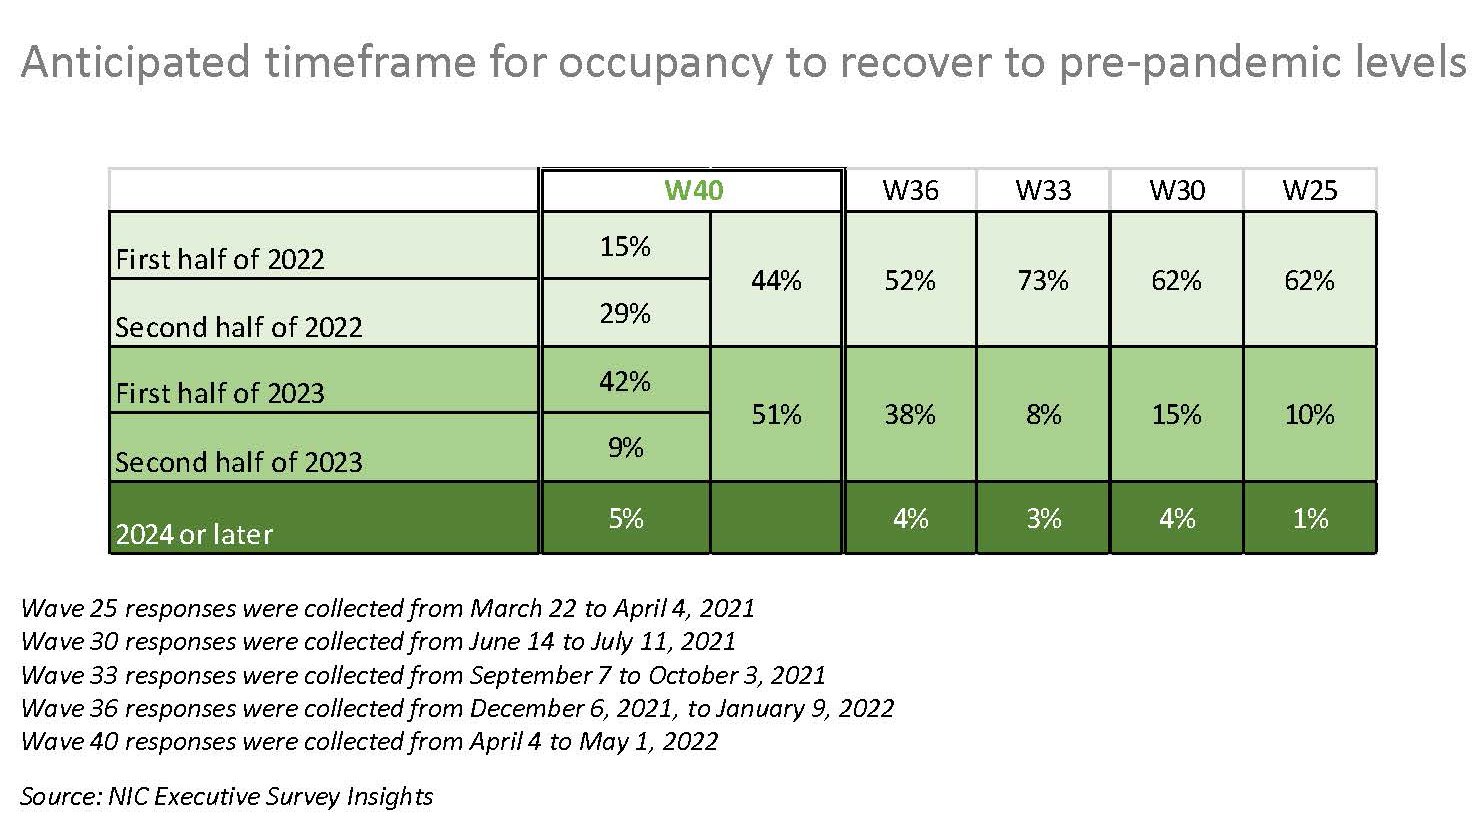
In a new question in the Wave 40 survey, respondents were asked whether they planned to increase, decrease, or not change their current care offering unit mix. Significantly, one-half of organizations expect to increase the independent living care segment over the next 12-months. On the flip side, one out of five respondents (21%) expect to decrease the nursing care segment. Regarding the current share of all full-time open positions across respondent organizations, in the Wave 40 survey, one-quarter have more than 20% of positions currently unfilled. Some innovative methods that have successfully recruited non-caregiving staff include quick hires with orientation scheduled several times during the week, educational incentives, directly recruiting in-person at nearby businesses, and more. The shares of organizations reporting acceleration in nursing care move-ins increased significantly—from 21% in Wave 37 conducted in January to 63% in Wave 40. One-half of respondents to the Wave 40 survey (52%) reported lead volumes above pre-pandemic levels in April—a notable increase from the Wave 38 survey reflecting results in February (33%). However, expectations for occupancy to recover to pre-pandemic levels in the near term have tempered over the past year. One-half of organizations currently expect occupancy recovery to occur in 2023, with the majority expecting it to happen in the first half of 2023.

–Lana Peck, Senior Principal, NIC

NIC’s Executive Survey of senior housing and skilled nursing operators was implemented in March 2020 to deliver real-time insights into the impact of the pandemic and the pace of recovery. In its third year, the “ESI” is transitioning away from the COVID-19 crisis to focus on timely industry topics. While some standard questions will remain for tracking purposes, in each new survey “wave,” fresh questions may be added.

This Wave 40 survey includes responses from April 4 to May 1, 2022, from owners and executives of 65 small, medium, and large senior housing and skilled nursing operators across the nation, representing hundreds of buildings and thousands of units across respondents’ portfolios of properties. More detailed reports for each wave of the survey and a PDF of the report charts can be found on the NIC COVID-19 Resource Center webpage under Executive Survey Insights.

In a new question included in the Wave 40 survey, respondents were asked whether they planned to increase, decrease, or not change their current care offering unit mix—some, or all of which may already be in the development pipeline. Significantly, one-half of organizations expect to increase the independent living care segment over the next 12-months. Of note, one out of five respondents (21%) expect to decrease the nursing care segment.

Wave 40 Report Charts_Final_Page_3
In the Wave 40 survey, three-quarters of respondents indicated the severity of their staffing shortages across their organizations was moderate (73%). Fewer respondents reported severe staffing shortages in the Wave 40 survey than in Wave 39 (19% vs. 27%). Attracting community and caregiving staff continues to be among operators’ most significant challenges, followed by rising operating expenses (89% and 80%, respectively).

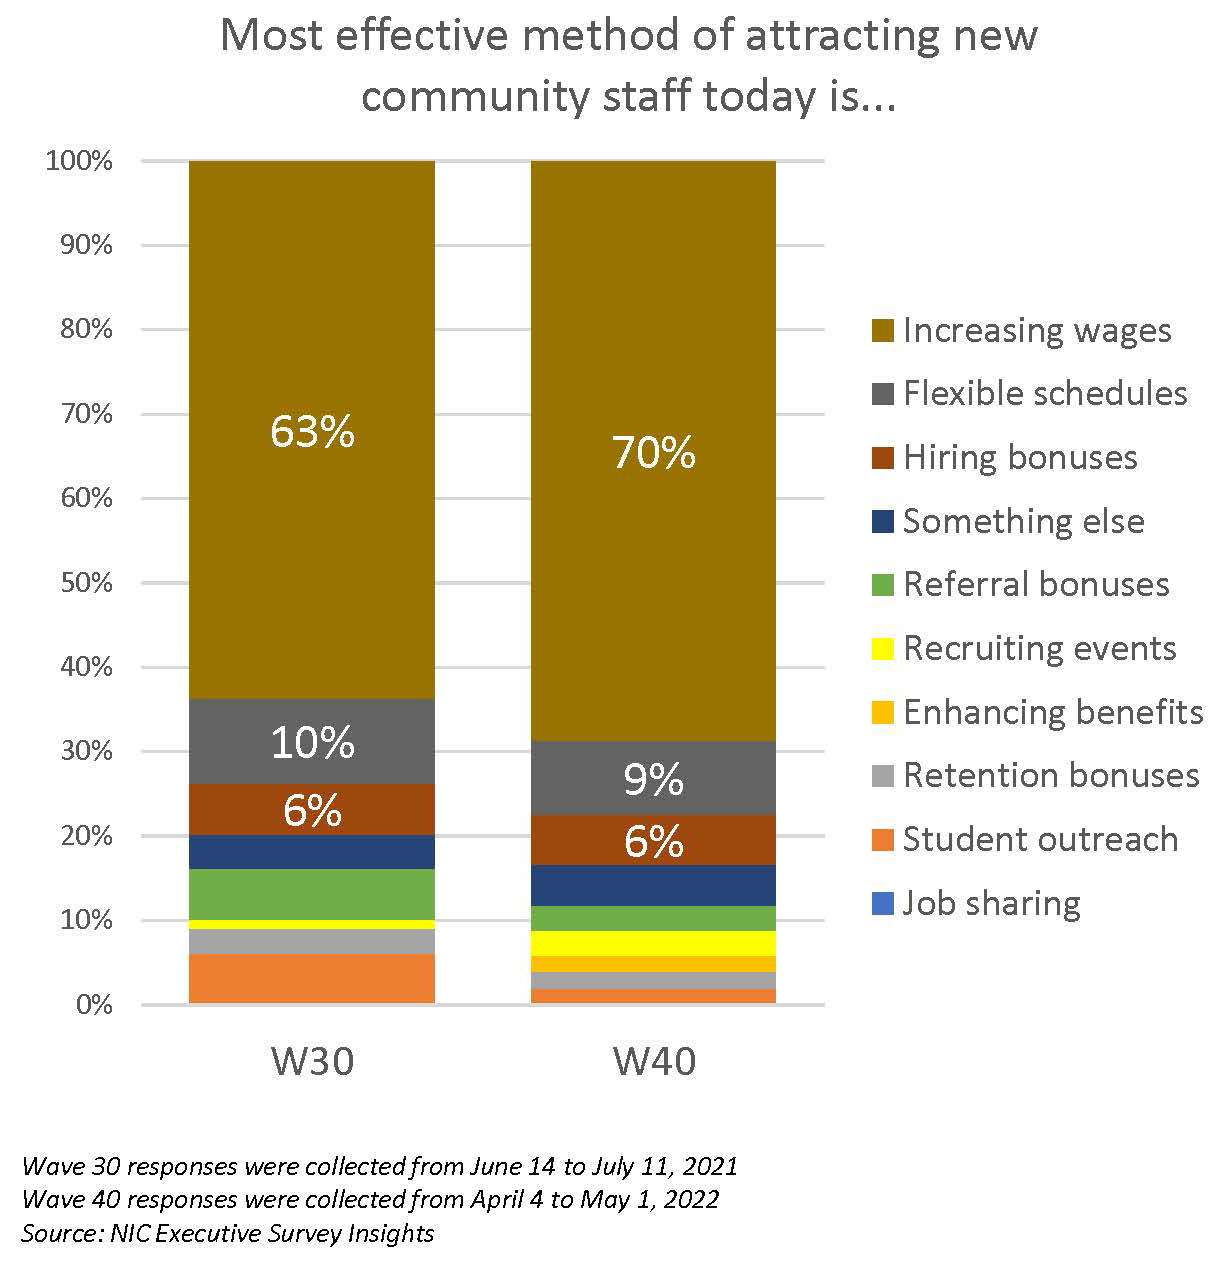
Regarding the most effective methods respondents have found for attracting new employees, increasing wages remain the most often cited. Comparing the Wave 30 survey conducted in June/July 2021 and the Wave 40 survey, 63% to 70% indicated that increasing wages continues to be the most effective.

With regard to the current share of all full-time, open positions across respondent organizations, in the Wave 40 survey, one-quarter have more than 20% of positions currently unfilled. One-half have between 11% and 20% of full-time positions unfilled.

Wave 40 Report Charts_Final_Page_4

In the Wave 39 survey, respondents were asked to share innovative methods they had found to be particularly successful in recruiting caregiving staff. In the Wave 40 survey, they were asked about innovative ways of recruiting non-caregiving staff. Beyond generally increasing wages, offering flexible schedules, hiring, and referral bonuses—all of which have been reported as effective to some degree—the list below includes alternative ways to attract non-caregiving staff as cited by respondents:

  • Quick hires with orientation scheduled several times during the week.
  • Quarter for quarter raise structure; all hourly employees receive a $.25 raise each quarter they stay with us.
  • Directly recruiting in-person at nearby businesses.
  • Attempting a daily pay option as a test to see if it has value as an incentive to staff.
  • Opportunities to grow in position by providing educational incentives.
  • Use of social media has had the most impact for us.

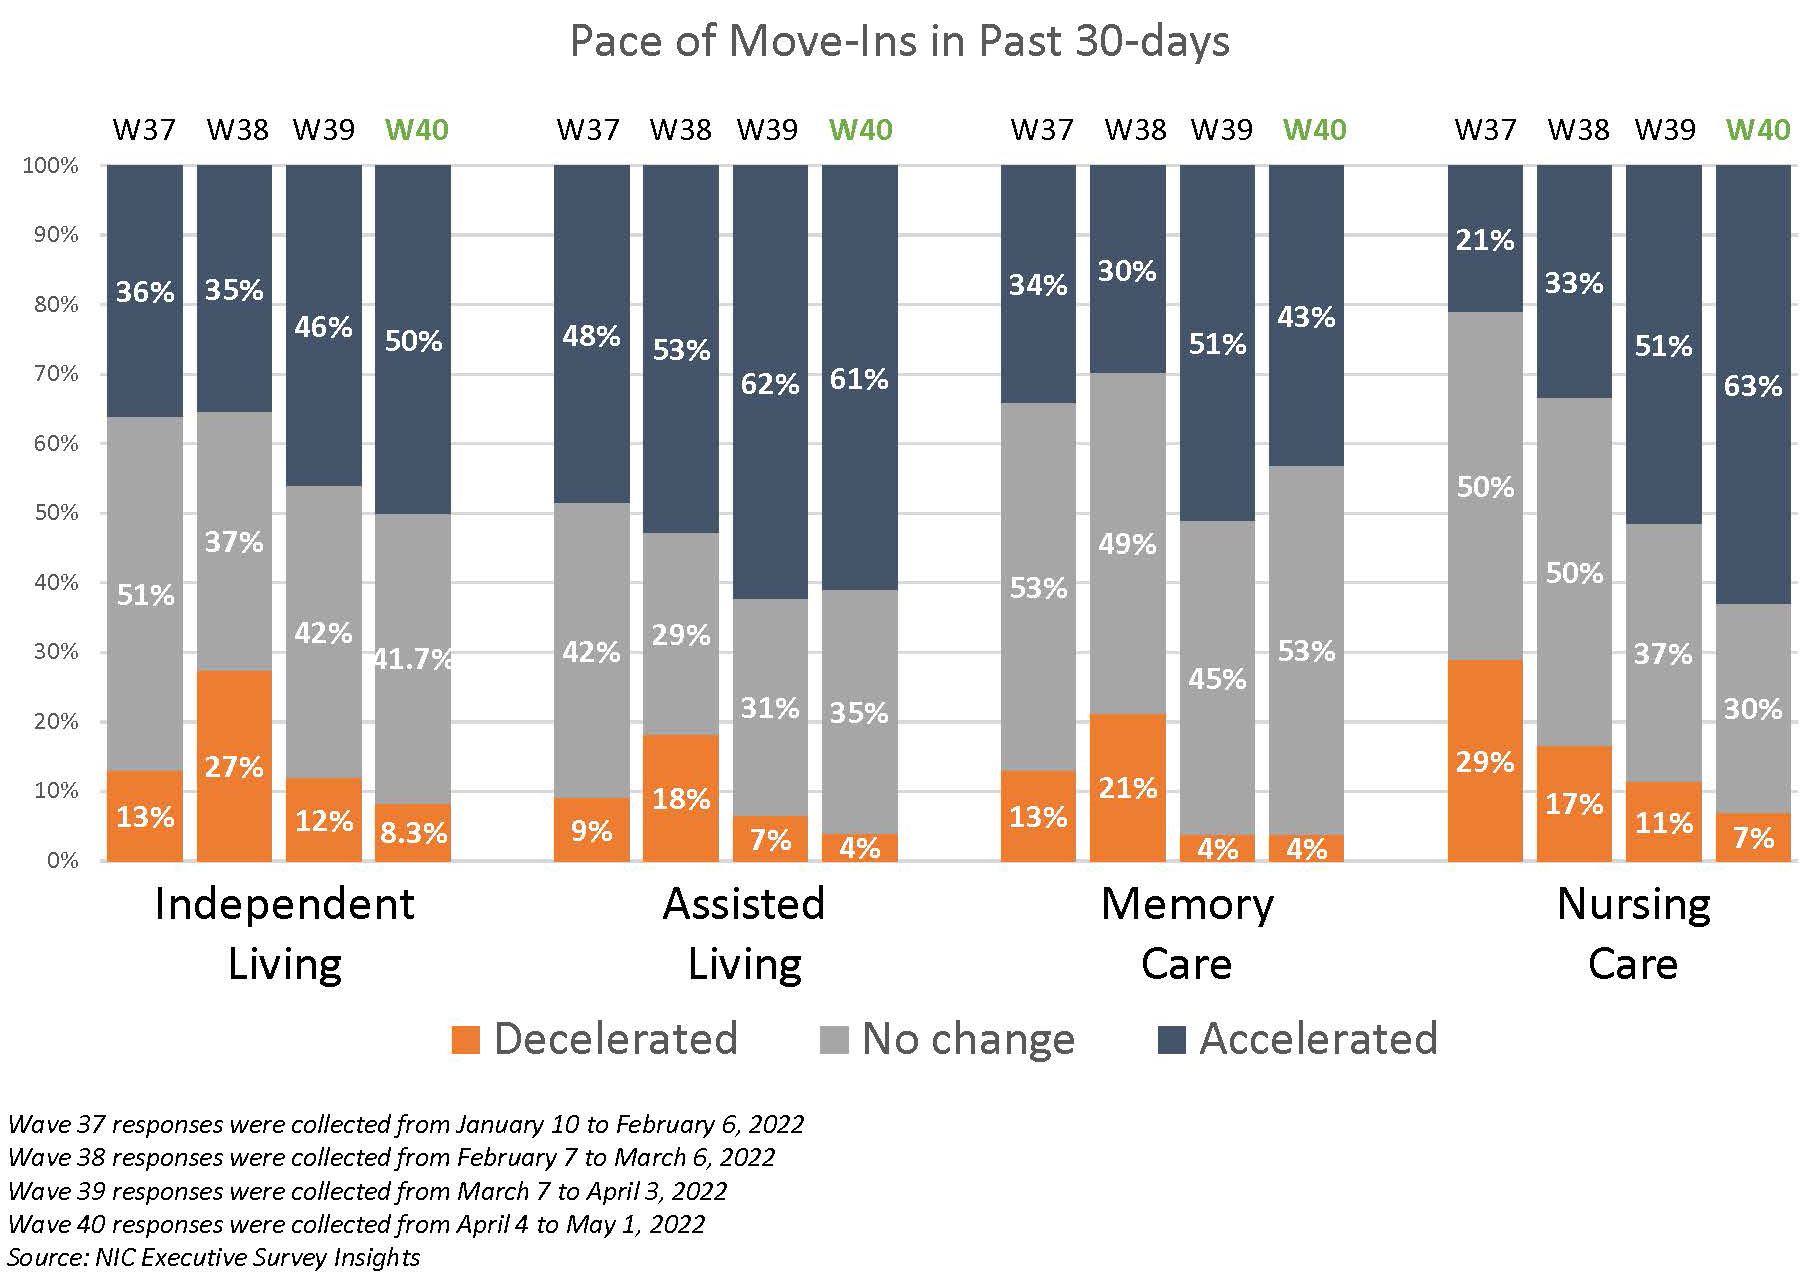
The timeline below shows the share of organizations reporting an increase in the pace of move-ins during the prior 30-days. Data from the Wave 40 survey reflects an increase in the share of operators reporting acceleration in the pace of move-ins after COVID-19 variant cases declined sharply in the U.S. Note that seasonality also may have an effect.

Wave 40 Report Charts_Final_Page_6

In the Wave 40 survey (reflecting operator experiences in April), between roughly 40% and 60% of organizations with independent living residences, assisted living residences, memory care residences, and nursing care beds reported an acceleration in the pace of move-ins. Since January, the shares of organizations that reported acceleration in nursing care move-ins increased significantly—from 21% in Wave 37 to 63% in Wave 40.

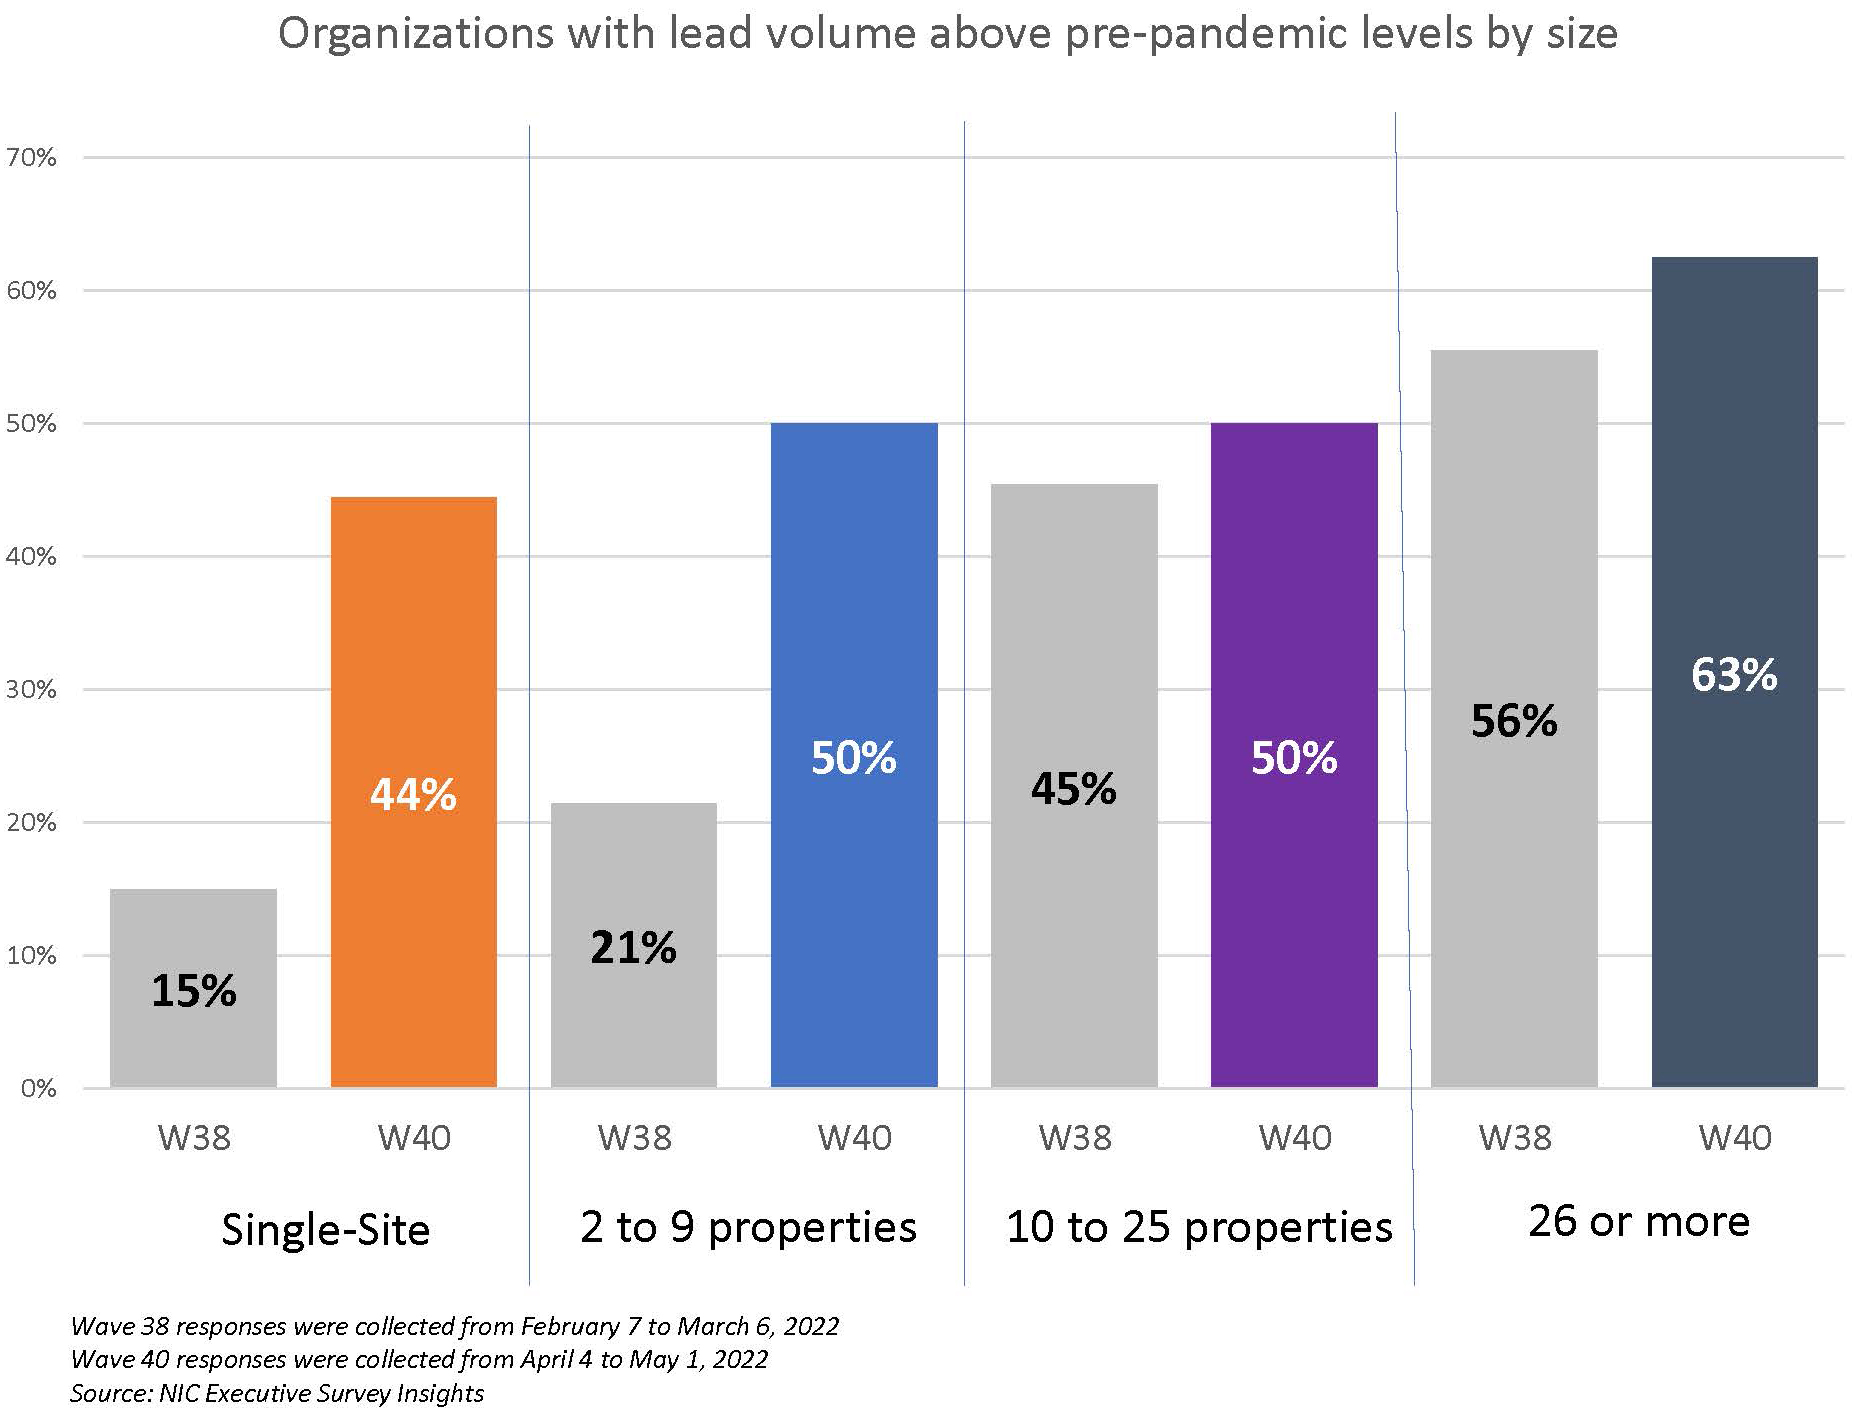
One-half of respondents to the Wave 40 survey (52%) reported lead volumes above pre-pandemic levels in April—a notable increase from the Wave 38 survey reflecting results in February (33%). Smaller organizations saw the most significant gains. Single-site operators with lead volume above pre-pandemic levels rose from 15% to 44% in Wave 40, and operators with 2 to 9 properties increased from 21% to 50%). Given pent-up demand coming out of the pandemic and questions about the sustainability of record-high absorption rates in the last half of 2021 per NIC MAP Vision data, this measure in the ESI may be a leading indicator to watch with regard to occupancy recovery.

Wave 40 Report Charts_Final_Page_7

Expectations for occupancy to recover to pre-pandemic levels in the near term have tempered over the past year. One-half of organizations (51%) currently expect occupancy recovery to occur in 2023, with 42% expecting it to happen in the first half of 2023. In the Wave 33 survey conducted in the fall of 2021, three-quarters of respondents expected their occupancy to recover to pre-pandemic levels by the first half of 2022.

Wave 40 Report Charts_Final_Page_8

Wave 40 Survey Demographics

  • Responses were collected between April 4 to May 1, 2022, from owners and executives of 65 seniors housing and skilled nursing operators across the nation. Owner/operators with 1 to 10 properties comprise roughly one-half (55%) of the sample. Operators with 11 to 25 and 26 properties or more make up the rest of the sample (20% and 25%, respectively).
  • More than one-half of respondents are exclusively for-profit providers (58%), one-third operate not-for-profit seniors housing and care organizations (33%), and 9% operate both.
  • Many respondents in the sample report operating combinations of property types. Across their entire portfolios of properties, 75% of the organizations operate seniors housing properties (IL, AL, MC), 22% operate nursing care properties, and 31% operate CCRCs (aka life plan communities).

Owners and C-suite executives of seniors housing and care properties, please help us tell an accurate story about our industry’s performance. If you are an owner or C-suite executive of senior housing and care and have not received an email invitation to take the survey, please contact Lana Peck at lpeck@nic.org to be added to the list of recipients.

NIC wishes to thank respondents for their valuable input and continuing support for this effort to provide the broader market with a sense of the evolving landscape as we recover from the pandemic. This is your survey! Please take the Wave 41 survey and suggest new questions for Wave 42.

“Terrific Environment” for Senior Housing and Care Investment

The educational programming topics at the recent 2022 NIC Spring Conference focused on the theme “A New Day” for the senior housing and care industry.

The educational programming topics at the recent 2022 NIC Spring Conference focused on the theme “A New Day” for the senior housing and care industry. Read below the opening remarks by Kurt Read, Chair of Board of Directors, NIC, and Principal, RSF Partners, in which he offered a glimpse into the new day, with opportunities awaiting in the sector.  


NICSpring-2022_0510


“Any time there’s a big moment of disruption, I think it’s really important to step back as an investor to look at the space that we’re in. Let’s set the stage a little bit here: We look like we’re at the end of a 12 plus year credit cycle, which in my 30 years in the industry, is the longest cycle that I’ve ever participated in.

Interest rates are rising. We have a war in Europe. Inflation is spiking. Market volatility is increasing. There is change everywhere, but capital is really interested in what we have to offer. We have a simple, easy to understand story around the drivers of growth in our space. And we have demonstrated good returns over the long run. Those are things that attract capital. However, the pandemic has accelerated the recognition that senior housing and care is an important part of the broader healthcare ecosystem. And many of the sessions here at NIC are going to talk about that.

So what does that mean to be part of the healthcare ecosystem? Let me give you a couple of fas just to set the stage on how we fit into this. As you know, healthcare spending is roughly 20% of GDP in the U.S. — that puts it at over $4.1 trillion a year. The health insurance industry has over $2 trillion a year in revenue. And just three of the larger companies in the health insurance space — United, Aetna CVS, and Humana — have more assets than our whole industry combined, about $480 billion. Why is that important? Because the health insurance industry is large, it’s healthy, and it’s well capitalized. And what are they looking at?

A growing number of their members live in our buildings and are more and more part of the equation of the increasing costs. And they require a lot of care. If you’re a health insurer or a risk taker in our space, they look at our space and say, “we’re not the senior living industry, we’re not the skilled nursing industry, we’re not the CCRC industry.” But, we have their members that are either pre-acute or post-acute. A pretty interesting distinction from the way we look at it.

And they have a business model that’s pretty easy to understand; sort of three things they’re looking at. One is they need to increase membership, particularly in their special needs plans, because those are the most expensive members they have. They need better, more integrated care delivery networks. Think about what that means. It’s all of you in this room (the care delivery network). And they need better, more integrated data. That’s why it’s so important for all of us to continue to contribute our data to NIC MAP Vision.

It’s pretty easy to see where this is going. Whether you’re a small operator, a developer, a large investor, we should all anticipate that this well-capitalized health insurance industry will be a force for change both in capital formation and in operations. At NIC and NIC MAP Vision, it’s clear that we need to remain at the forefront of creating more consistent, timely, useful data to engage with risk takers in the insurance industry at both the granular level (that means in your buildings) as well as at the industry level.

I’m a private equity investor. We’re raising our eighth fund. Am I bullish on investing in the senior living space? We are very bullish. We anticipate investing a lot of our next $500 million fund in the senior living business.

Why? Let me just remind you, other than the obviously wonderful demographic growth story, as we shift our focus to the baby boom generation, which is 62% larger than the silent generation we have been serving, let’s talk about the structural characteristics of our industry quickly that make it very favorable to invest in this space.

First, there’s an aging stock of supply in our industry. Second, rents are not correlated to the broader economy. Demand is inelastic; it’s driven by need. Our residents are not tied to the labor market (even though we’re having trouble with staffing) because they’re already retired. The industry is highly fragmented, which means there’s great opportunity for consolidation and growth. It’s notoriously difficult to scale. So those participants who can execute have a big advantage. Why is it hard to scale? Local markets matter. Customer demand, competition, land usage, and labor markets are all driven locally. Operations are a complex mix of real estate, wellness, healthcare, and hospitality. That’s hard to do. Branding has a limited effect. Families only make the decision to use our product once or twice in their entire lives. And regulations are a confusing mix of local, state and federal rules.

And lastly, one of my favorites is, you can’t offshore personal care.

All these factors favor dedicated, focused, expert participants and combine to create a terrific environment to earn a premium return on your effort.”