Emerging Trends in Senior Housing

Major factors influencing senior housing continue to evolve. Some trends are well known while others are still developing.

This article originally appeared in the “Emerging Trends in Real Estate® 2023” report issued by the Urban Land Institute and PwC. Data cited in article as of original publish date; more current data may be available. 


Major factors influencing senior housing continue to evolve. Some trends are well known while others are still developing. In 2022 and into 2023, trends for senior housing include the following:

  1. The growth of the sector into new product types differentiated by rate and service offerings as the sector continues to mature and evolve.
  2. The articulation of a new value proposition for senior housing as the proverbial “fountain of youth” for future baby boomer residents who seek a high quality of life, wellness, longevity, and purpose.
  3. The recognition that senior housing is truly part of the health care continuum.
  4. The gradual recovery of occupancy from the nadir reached during COVID-19, boosted by a recent slowdown in inventory growth and strong post-pandemic demand patterns.
  5. Outside exogenous factors including the national and global economies, inflation, and rising interest rates, which present new challenges for senior housing.
  6. Staff recruitment and retention as well as rising expenses associated with labor shortages, insurance, food, energy, and other goods and services. Collectively, these are squeezing operator margins, investment returns, and debt issuance.
  7. And, of course, U.S. demographic patterns, which are pushing greater numbers of individuals into the 75-plus cohort, creating a captive pool of potential new residents for senior housing.
  8. These and other topics will be further explored in this commentary.

Sector maturation. It is an exciting time in the senior living industry as the sector matures and product offerings become increasingly differentiated. Much like the hotel industry, with offerings from Motel 6 to the Ritz-Carlton, operators, developers, and capital providers are increasingly segmenting the senior housing market by both price point and service offerings. “Active adult” offers amenitized rental housing for the “younger old” cohort seeking community involvement, lifestyle, purpose, and connection. The “Forgotten Middle,” a term coined by the National Investment Center for Seniors Housing & Care (NIC) in its 2019 seminal study that assessed and quantified the need for more affordable housing and care options for middle-income seniors, offers care and housing options for the value-minded older adult consumer. And “ultra-luxury retirement communities” offer older adults high-end concierge lifestyle living options with wellness centers, five-star culinary options, entertainment, and A-list cultural events. And, of course, there remains the traditional senior housing product, with a price point that falls between the latter two and offers a value proposition of security, socialization, engagement, room and board, care coordination, and lifestyle

Wellness value proposition. Many operators are increasingly recognizing that senior housing provides an environment that can promote and support health and wellness, enticements to the baby boomers as they age and seek the proverbial “fountain of youth.” Further, the movement of many operators to incorporate wellness programs into their offerings has the ability to be a significant competitive advantage as potential residents seek communities that hold promise to improve the quality of their life through programs focused on the intellectual, physical, social, spiritual, vocational, emotional, and environmental dimensions of wellness as defined by the International Council on Active Aging (ICAA).

Senior housing as part of the continuum of care. Simply stated, senior housing operators influence social determinants of health for hundreds of thousands of older Americans. Operators can help manage chronic illness and keep older adults healthy—they have 24/7 eyes on residents and can systematically monitor changes in conditions. Properly managed, this can result in fewer resident hospitalizations, reduce federal and state-level health care spending, and act as a catalyst for future business opportunities and collaborations. Further, thoughtful care intervention can provide support to the overall health care ecosystem through the support and creation of conscientious awareness and follow-through. And, once senior housing is fully recognized as part of the health care continuum, senior housing operators will be able to participate in the revenue streams associated with a capitated risk-sharing model of care.

Tailwinds for occupancy recovery. There are two tailwinds supporting an ongoing occupancy recovery for senior housing. First, on the supply side, the number of senior housing units under construction in the second quarter of 2022 for the 31 NIC MAP Primary Markets was the fewest since 2015. And that pattern may remain in place—at least in the near term—because senior housing starts continue to linger at moderate levels and remain well below their peaks seen in the 2016–2018 period. This is because rising materials prices and inflation, labor shortages in the building trade industries, and the change in Fed policy of higher interest rates are collectively affecting plans for new development; many projects increasingly do not pencil out for reasonable returns.

Second, demand is also a tailwind for an ongoing improvement in occupancy. Indeed, demand, as measured by the change in occupied inventory or net absorption, was robust in the second quarter of 2022, increasing at its strongest pace ever recorded by NIC MAP Vision except for the post-pandemic boost in demand in the last half of 2021. Since the recovery began in the second quarter of 2021, 78 percent of the units placed back on the market have been reoccupied.

As a result of these conditions, the occupancy rate for seniors housing—where seniors housing is defined as the combination of the majority independent living and assisted living properties—rose 0.9 percentage point during the second quarter of 2022 to 81.4 percent for the 31 NIC MAP Primary Markets. This marked the fifth consecutive quarter where occupancy did not decline. At 81.4 percent in the second quarter, occupancy was 3.4 percentage points above its pandemic-related low of 78.0 percent recorded in the second quarter of 2021 but was 5.8 percentage points below its pre-pandemic level of 87.2 percent in the first quarter of 2020.

Outside influencing factors. Looking ahead, several exogenous factors will influence the strength of net move-ins and demand. These include demographics (as discussed further below) as well as the following:

  1. The broad performance of the U.S. economy,
  2. Consumer confidence (very low, according to the University of Michigan survey),
  3. The rate of inflation (the Consumer Price Index increased by 9.1 percent from year-earlier levels in June 2022, resulting in the largest increase since 1981),
  4. Interest rates (rising as the Fed tightens monetary policy and increases the fed funds rate),
  5. The pace of sales for residential housing (slowing from higher mortgage interest rates),
  6. The stock market (considered in a bear market),
  7. Pent-up demand for senior living settings (strong through the second half of 2022),
  8. Development currently underway (moderately paced compared with history),
  9. New competition in the form of recently opened properties since the pandemic began, and
  10. Local market area demand and supply pressures.

Staffing challenges. Importantly, labor also is a key consideration, with an increasing number of operators citing labor shortages as a potential limiting constraint on growth. In the WMRE/NIC Investor Sentiment Survey conducted in June 2022, just under half of respondents (41 percent) reported that labor shortages have caused a reduction in the number of operating units/beds in their portfolios. This is presenting challenges for operators seeking to maintain census, much less grow and expand.

Indeed, the U.S. jobless rate was low at 3.6 percent in June 2022 and was only 0.1 percentage point above the pre-pandemic level of 3.5 percent seen in February 2020. Further, tight labor market conditions are pressuring wage rates up quickly, especially for workers in skilled nursing and assisted living properties.

While good for employees, low jobless rates present challenges to employers who must staff their businesses. Surveys conducted by the NIC among C-suite operators of senior housing and care properties highlight strategies to combat labor shortages and include raising wages, offering flexible work hours, higher pay frequency, improving the work environment and culture, recruitment programs comparable to those used to market to new residents, and collaboration with educational institutions.

Expenses, margins, and returns. Rising wage costs associated with temporary agency workers, overtime hours, and sick leave associated with COVID-19 have combined with dollars expended on personal protective equipment (PPE) and rising insurance costs to put significant pressure on expenses. Rent growth, while rising, has not been sufficiently able to offset expense growth for many operators. As a result, net operating income (NOI) has been hard to achieve for many—but certainly not for all—operators of senior housing properties.

COVID was particularly hard on the senior housing sector. Many investors had reduced their appreciation expectations for senior housing as the impact of the coronavirus weighed heavily on their view of the sector. According to NCREIF Property Index (NPI) investment return data, short-term total returns for senior housing were low at 1.08 percent in the first quarter of 2022 compared with the broader NPI, which saw total returns of 5.33 percent in the first quarter. Appreciation returns for the NPI dwarf those of senior housing, since the NPI was boosted in part by outsized returns in industrial properties (10.96 percent). The senior housing income return in the first quarter was 0.91 percent, its best showing since late 2020. This was stronger than industrial and nearly on par with apartments, and slightly less than the NPI (0.99 percent).

Nevertheless, on a longer-term basis, the 10-year return for senior housing was the strongest of the main property types except for industrial. For this time frame, the income returns for senior housing (5.47 percent) surpassed the NPI (4.83 percent), while the appreciation return (4.49 percent) was slightly less than the NPI (4.61 percent).

Demographics favor senior housing. The demographics supporting senior housing cannot be denied, as the number and share of older adults continue to grow. For example, the number of persons 82 or older—often the age of a resident moving into senior housing—is growing at an accelerating pace. In 2022, there were 10.6 million Americans aged 82 and older; by 2026, this is projected to grow to 12.3 million, and by 2030 to 14.8 million, according to the U.S. Census Bureau. Further, in the not very distant future, the ratio of adult children family caregivers (those aged 45 to 64) who are available to take care of aging parents (those over 80 years of age) will continue to shrink at a precipitous pace from 7:1 in 2015 to 6:1 in 2022 to 5:1 in 2026 to 4:1 in 2031 and to 3:1 in 2044.

With fewer family members and spouses available for care (divorce rates are high for older adults), congregate settings will indeed get a further demand boost. In addition, the increasing segmentation and differentiation of senior housing in serving the vast numbers of seniors in middle-income cohort will add a large demand pool for operators to serve, as will the movement of “younger old” aging adults into the active adult segment. With an industry penetration rate of roughly 11 percent of U.S. households, the penetration rate does not need to increase dramatically for occupancy to rise to pre-pandemic levels.

Looking ahead, there are many reasons to be optimistic about the outlook for senior housing, but the path forward may be a bit bumpy due to the prevailing winds in the broader economy. Inventory will continue to expand, although at a reduced pace in the near term, which should act as a tailwind for occupancy improvement. And, while demand may also be affected by economic headwinds, the value proposition of senior housing—security, socialization, engagement, room and board, care coordination, and lifestyle—remains in place and ultimately should win the day by attracting new residents for senior housing properties. In addition, the movement of many operators to incorporate wellness programs into their offerings has the potential to be a significant competitive advantage as potential residents seek communities that hold promise to improve the quality and length of their lives.

Senior Housing Occupancy Rate Over Halfway Back to Pre-Pandemic Level

The all-occupancy rate for senior housing for the NIC MAP Primary Markets increased to 82.8% in the October 2022 reporting period.

The all-occupancy rate for senior housing for the NIC MAP Primary Markets increased to 82.8% in the October 2022 reporting period, up 0.6 percentage point (pps) from the September 2022 reporting period on three-month rolling basis, according to intra-quarterly NIC MAP® data, released by NIC MAP Vision. From its pandemic record low of 77.9% in June 2021, senior housing all-occupancy increased by 4.9pps and is now more than halfway in the road to recovery, with a gap of 4.4pps from the pre-pandemic March 2020 level of 87.2%.

At 85.0%, the all-occupancy rate for majority independent living (IL) properties for the NIC MAP Primary Markets increased 0.3pps from September 2022 but remained 4.6pps below March 2020 levels. For majority assisted living properties (AL), the all-occupancy rate for the NIC MAP Primary Markets was up 0.7pps to 80.4% from September 2022 but still 4.2pps below March 2020 levels. Occupancy for AL continued to recover relatively fast compared with IL despite the relatively large inventory growth since the onset of the pandemic, but it’s notable that AL also fell further from peak to trough. From its pandemic-related low, all-occupancy for AL increased by 6.3pps, nearly 3pps more than IL (up 3.4pps since March 2021).

The pace of year-over-year inventory growth for both IL and AL continued to be relatively slow compared with pre-pandemic levels. The inventory of majority independent living properties for the NIC MAP Primary Markets increased by 1.1% or 3,887 units from year-earlier levels in the October 2022 reporting period. This was the smallest annual growth since 2015. Assisted living inventory increased by 2.0% over this same period.

All-occupancy rates increased or remained stable in 24 of the 31 Primary Markets for IL in the October 2022 reporting period compared with September 2022. At 93.5%, Boston’s occupancy increased by 0.7pps from September 2022 and ranked the highest among the 31 NIC MAP Primary Markets. Boston recovered the 6.1pps lost during the height of the pandemic and is the third independent living primary market, on average, to return/exceed pre-pandemic March 2020 levels along with San Antonio and Las Vegas. Houston IL occupancy improved by 2pps from September 2022, the largest gain among the 31 NIC MAP Primary Markets, but at 79.1%, it is still ranked at the bottom of the pack. In fact, Houston is the only IL primary market with an average occupancy rate below 80%.

All-occupancy rates rose or remained stable in 30 of the 31 Primary Markets for assisted living in October 2022 compared with September 2022. Tampa had the highest occupancy rate for AL among the 31 Primary Markets at 86.3% (up 0.9pps from October 2022 and is now 0.8pps below March 2020 levels). The Washington, D,C, occupancy rate at 75.2% in October 2022, is up 0.1pps from September 2022. Washington had the lowest occupancy rate for AL among the 31 Primary Markets.

Interestingly, the metropolitan markets at the bottom of the pack in occupancy rankings, e.g., Houston – IL and Washington, DC – AL had a relatively large year-over-year inventory growth compared with markets ranked first among the 31 NIC MAP Primary Markets, e.g., Boston – IL and Tampa – AL. To learn more about the inventory growth from year-earlier levels across these select NIC MAP metropolitan markets, download the NIC Intra-Quarterly Snapshot.
Exhibit-jpg

Keep track of the most timely and comprehensive review of the sector’s market fundamentals and trends. The NIC Intra-Quarterly Snapshot monthly publication, available for complimentary download on our website, continues to provide a powerful and closely watched means to stay ahead of industry trends, even as senior housing markets sustain a fast pace of evolution and adaptation, amidst an apparent recovery. 

The November 2022 Intra-Quarterly Snapshot report will be released on nic.org on Thursday, December 10, 2022, at 5:00pm.

Interested in learning more about NIC MAP Intra-Quarterly data? To learn more about NIC MAP Vision data, schedule a meeting with a product expert today.

261k New Jobs Created in October: Jobless Rate Inched Higher to 3.7%

The U.S. Bureau of Labor Statistics reported nonfarm payrolls rose by 261k in October 2022 and the unemployment rate rose 0.2 percentage point to 3.7%.

The U.S. Bureau of Labor Statistics reported that nonfarm payrolls rose by 261,000 in October 2022 and the unemployment rate rose 0.2 percentage point to 3.7%. The October increase was well below the year-to-date average of 407,000 and below the monthly average of 562,000 seen in 2021. The monthly gain paints an image of a still growing, but slowing, labor market. For perspective, in 2019, job gains averaged 164,000 per month. Revisions added 29,000 positions to total payrolls in the previous two months.

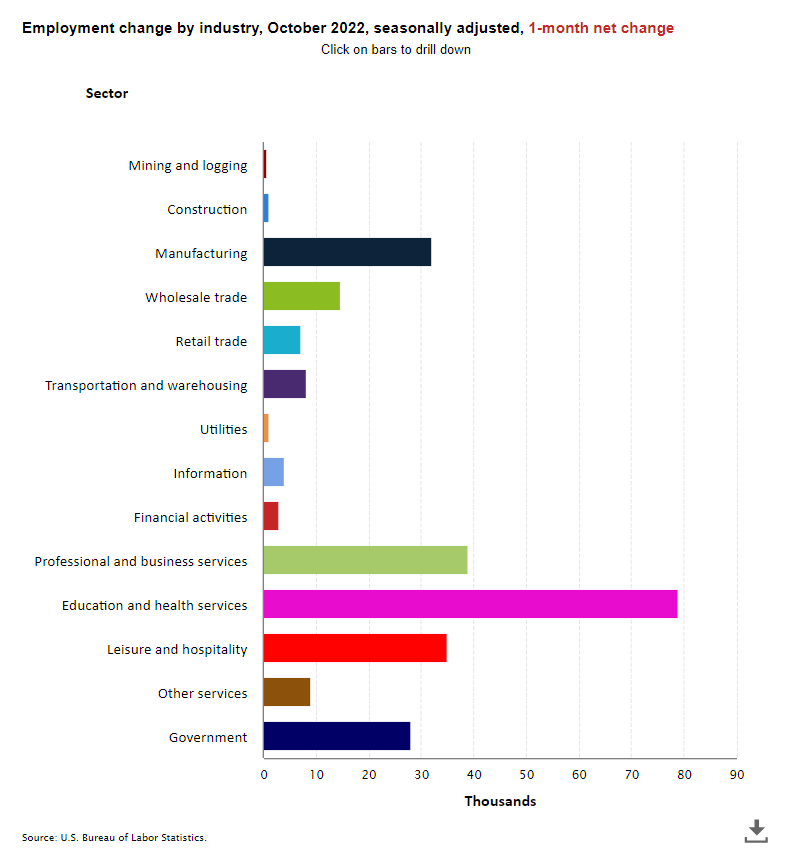
Employment in health care rose by 53,000 in October and has increased by an average of 47,000 per month in 2022 compared with 9,000 in 2021. Employment in nursing care facilities was up by 4,100 jobs from last month and 17,800 jobs from year-earlier levels and stood at 1,367,000 positions.

2022 NIC Notes Blog Employment October Civilian Unemployment Rate Graph

Today’s labor report is not likely to affect the Fed’s view on the economy. It is looking for the job market to slow further and the inflation rate to be tempered before it will adjust its aggressive stance on monetary policy. In his statement on Wednesday, Federal Reserve Chair Jay Powell said “The broader picture is of an overheated labor market where demand substantially exceeds supply …. I don’t see the case for real softening just yet.”

The Federal Reserve raised short-term interest rates for the sixth time this year on Wednesday, November 2nd. This marked the fourth consecutive 0.75 percentage point increase and followed earlier increases in 2022 of lesser amounts. The latest increase pushed the Fed Funds rate to a range of 3.75% to 4.00%, up from 0% at the beginning of the year. The rapid rise in interest rates is the most aggressive pace of monetary policy tightening since the early 1980s and is in response to inflation which remains near a 40-year high by most measures. In its announcement of higher interest rates, Powell said that when the Fed considers future interest rate increases, it “will take into account the cumulative tightening of monetary policy, the lags with which monetary policy affects economic activity and inflation, and economic and financial developments.” This may suggest smaller increases in rates at its final 2022 meeting in December and going into January. But Powell also said that “The (FOMC) Committee anticipates that ongoing increases in the target range will be appropriate in order to attain a stance of monetary policy that is sufficiently restrictive to return inflation to 2 percent over time …. We still have some ways to go and incoming data since our last meeting suggests that the ultimate level of interest rates will be higher than previously expected,” he said.

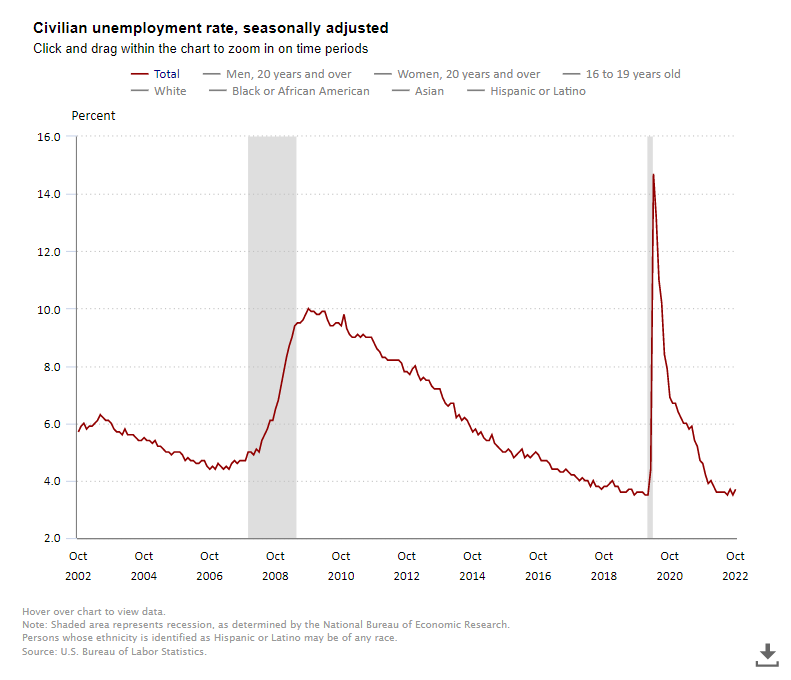
In a separate survey conducted by the BLS, the jobless rate rose 0.2 percentage point to 3.7% in October. In September, the jobless rate had once again fallen to its pre-pandemic level of 3.5% seen in February 2020. Both months’ unemployment rates are well below the 14.7% peak seen in April 2020.

2022 NIC Notes Blog Employment October Employment by Industry Graph

Among the major worker groups, the October unemployment rates were 3.4% for adult women, adult men (3.3%), teenagers (11.0%), Whites (3.2%), Hispanics (4.2%), Blacks (5.9%), and Asians (2.9%).

Average hourly earnings for all employees on private nonfarm payrolls rose by $0.12 in October to $32.58. This was a gain of 4.7% from year-earlier levels, still high, but lower than the gain in September (5.0%) and August (5.2%).

The labor force participation rate slipped back to 62.2% in October from 62.3% in September and 62.4% in August and was below the February 2020 level of 63.4%.

Earlier this week, the BLS released its JOLTS report that showed the number of job openings rose to a seasonally adjusted 10.7 million in September from 10.3 million in August. That was below the peak of 11.9 million in March, but still well above their pre-pandemic level in early 2020 when it averaged 7.0 million. This means that there are roughly 1.9 open positions for every person looking for work in September, up from 1.7 in August. The hirings rate did fall according to the JOLTS survey as did the quits rate, indications that the labor market is slowing a bit.

Skilled Nursing Occupancy Continued Increase in August 2022

NIC MAP Vision released its Skilled Nursing Monthly Report on November 3, 2022, including key monthly data points from January 2012 to August 2022.

“Occupancy has increased throughout 2022, which suggests demand for skilled nursing is growing. However, retaining adequate staff is still challenging and limits the ability to increase patient admissions.”

-Bill Kauffman

NIC MAP Vision released its latest Skilled Nursing Monthly Report on November 3, 2022. The report includes key monthly data points from January 2012 through August 2022.

Here are some key takeaways from the report:

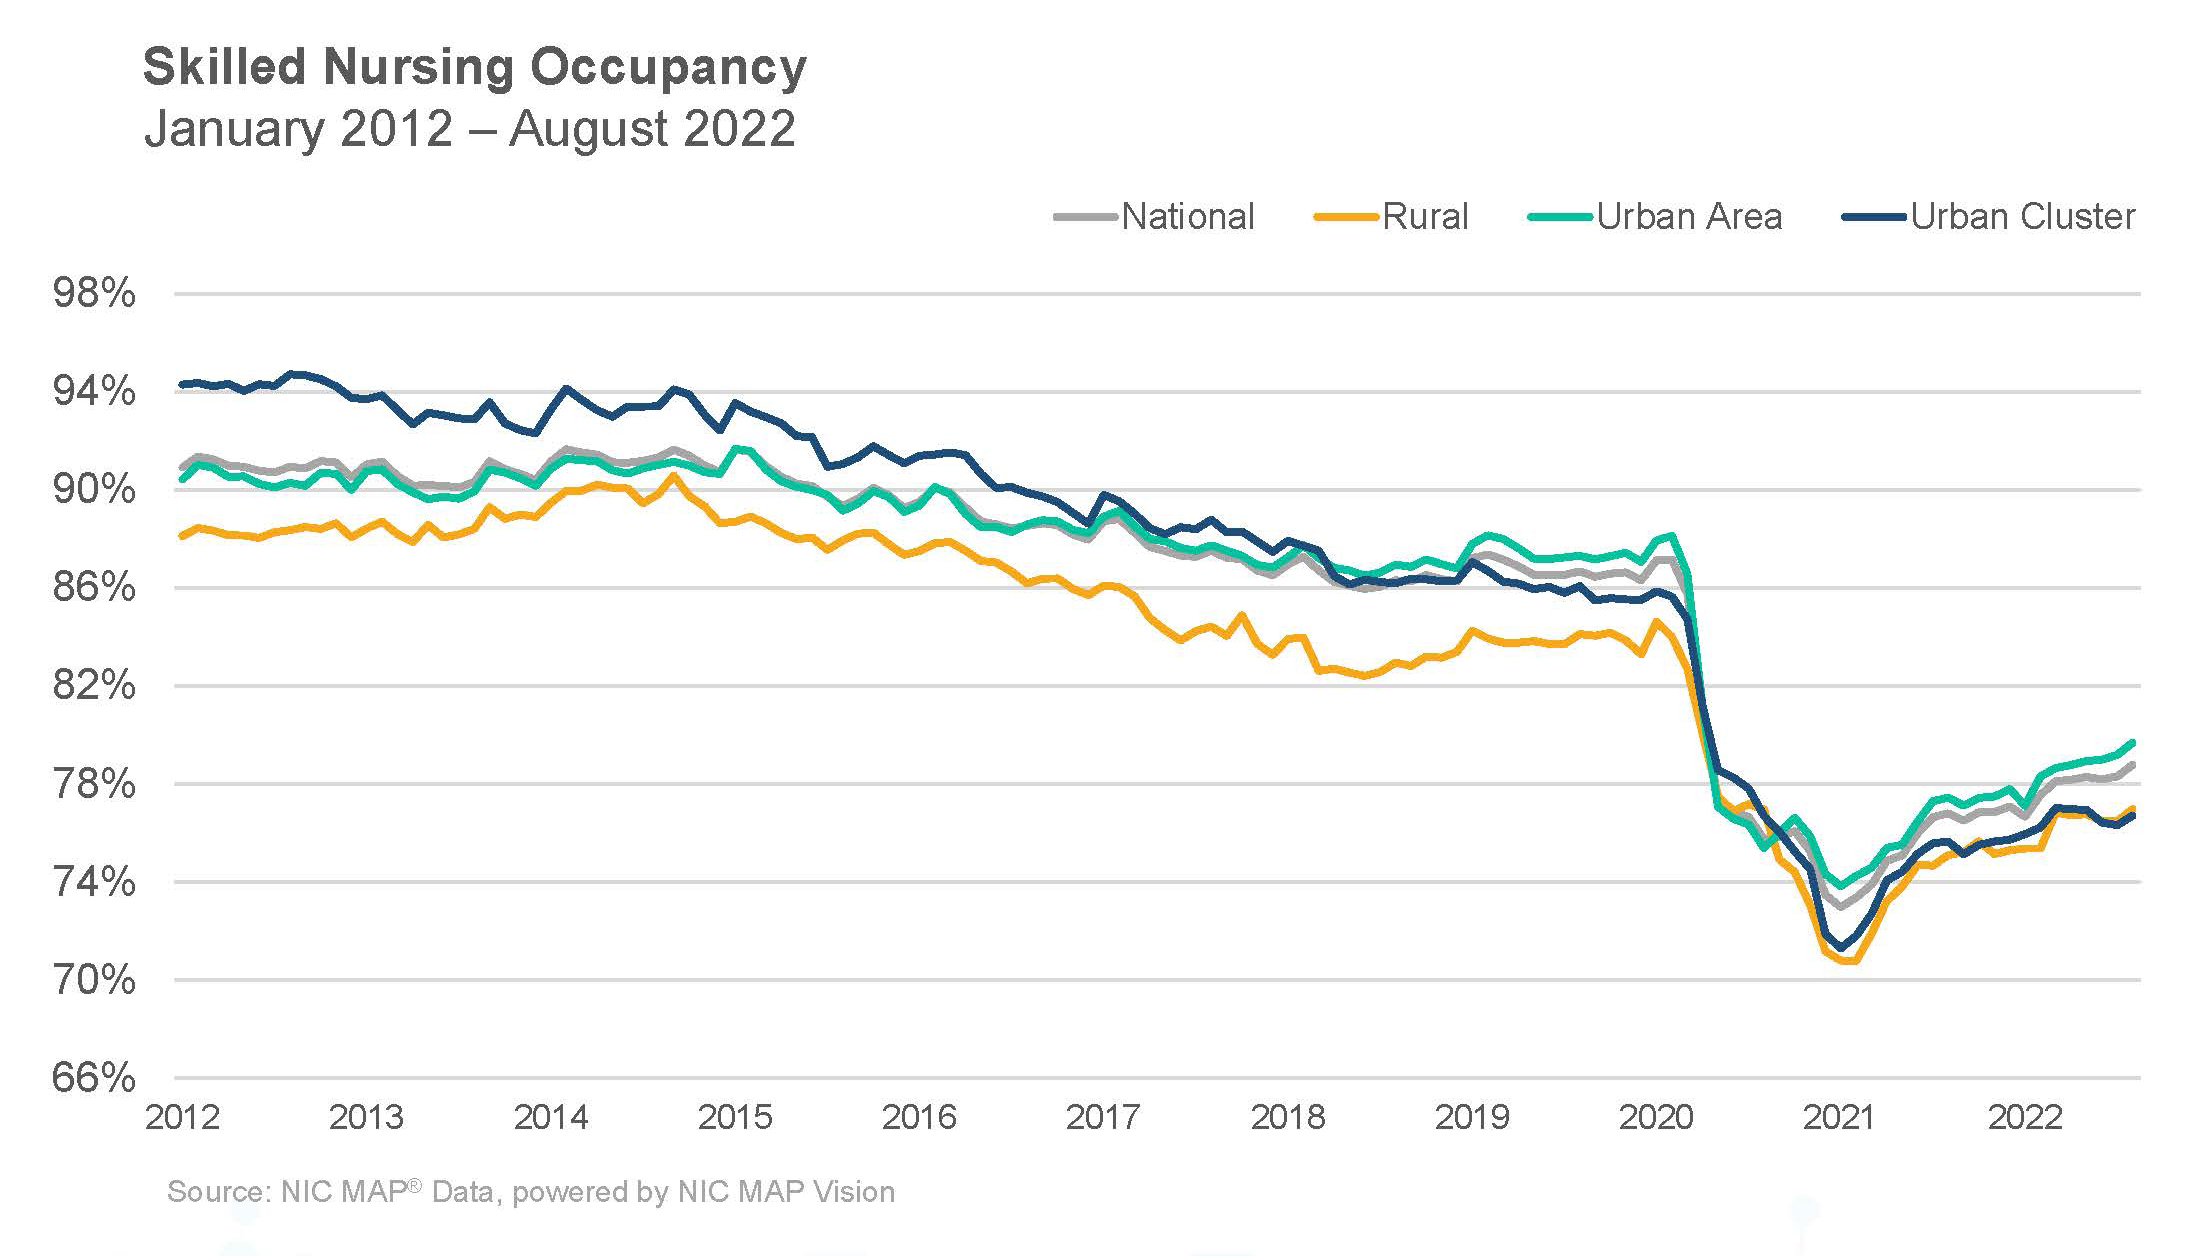
Skilled nursing occupancy continued to increase in August, rising 48 basis points from July to end the month at 78.8%. This is the highest occupancy rate since April 2020. There has been positive occupancy momentum throughout 2022 and it is up 580 basis points since the low point reached in January 2021 (73.0%). However, COVID-19 cases created additional challenges last year (2021), which slowed some of the initial momentum and the staffing crisis in the sector is still a significant burden on skilled nursing operators. Occupancy remains 8.4 percentage points below the pre-pandemic February 2020 level of 87.2%. As staffing, wage growth, and general inflation pressures persist, operations for many operators will be under pressure but the long-term demand for skilled nursing services is expected to grow over time.

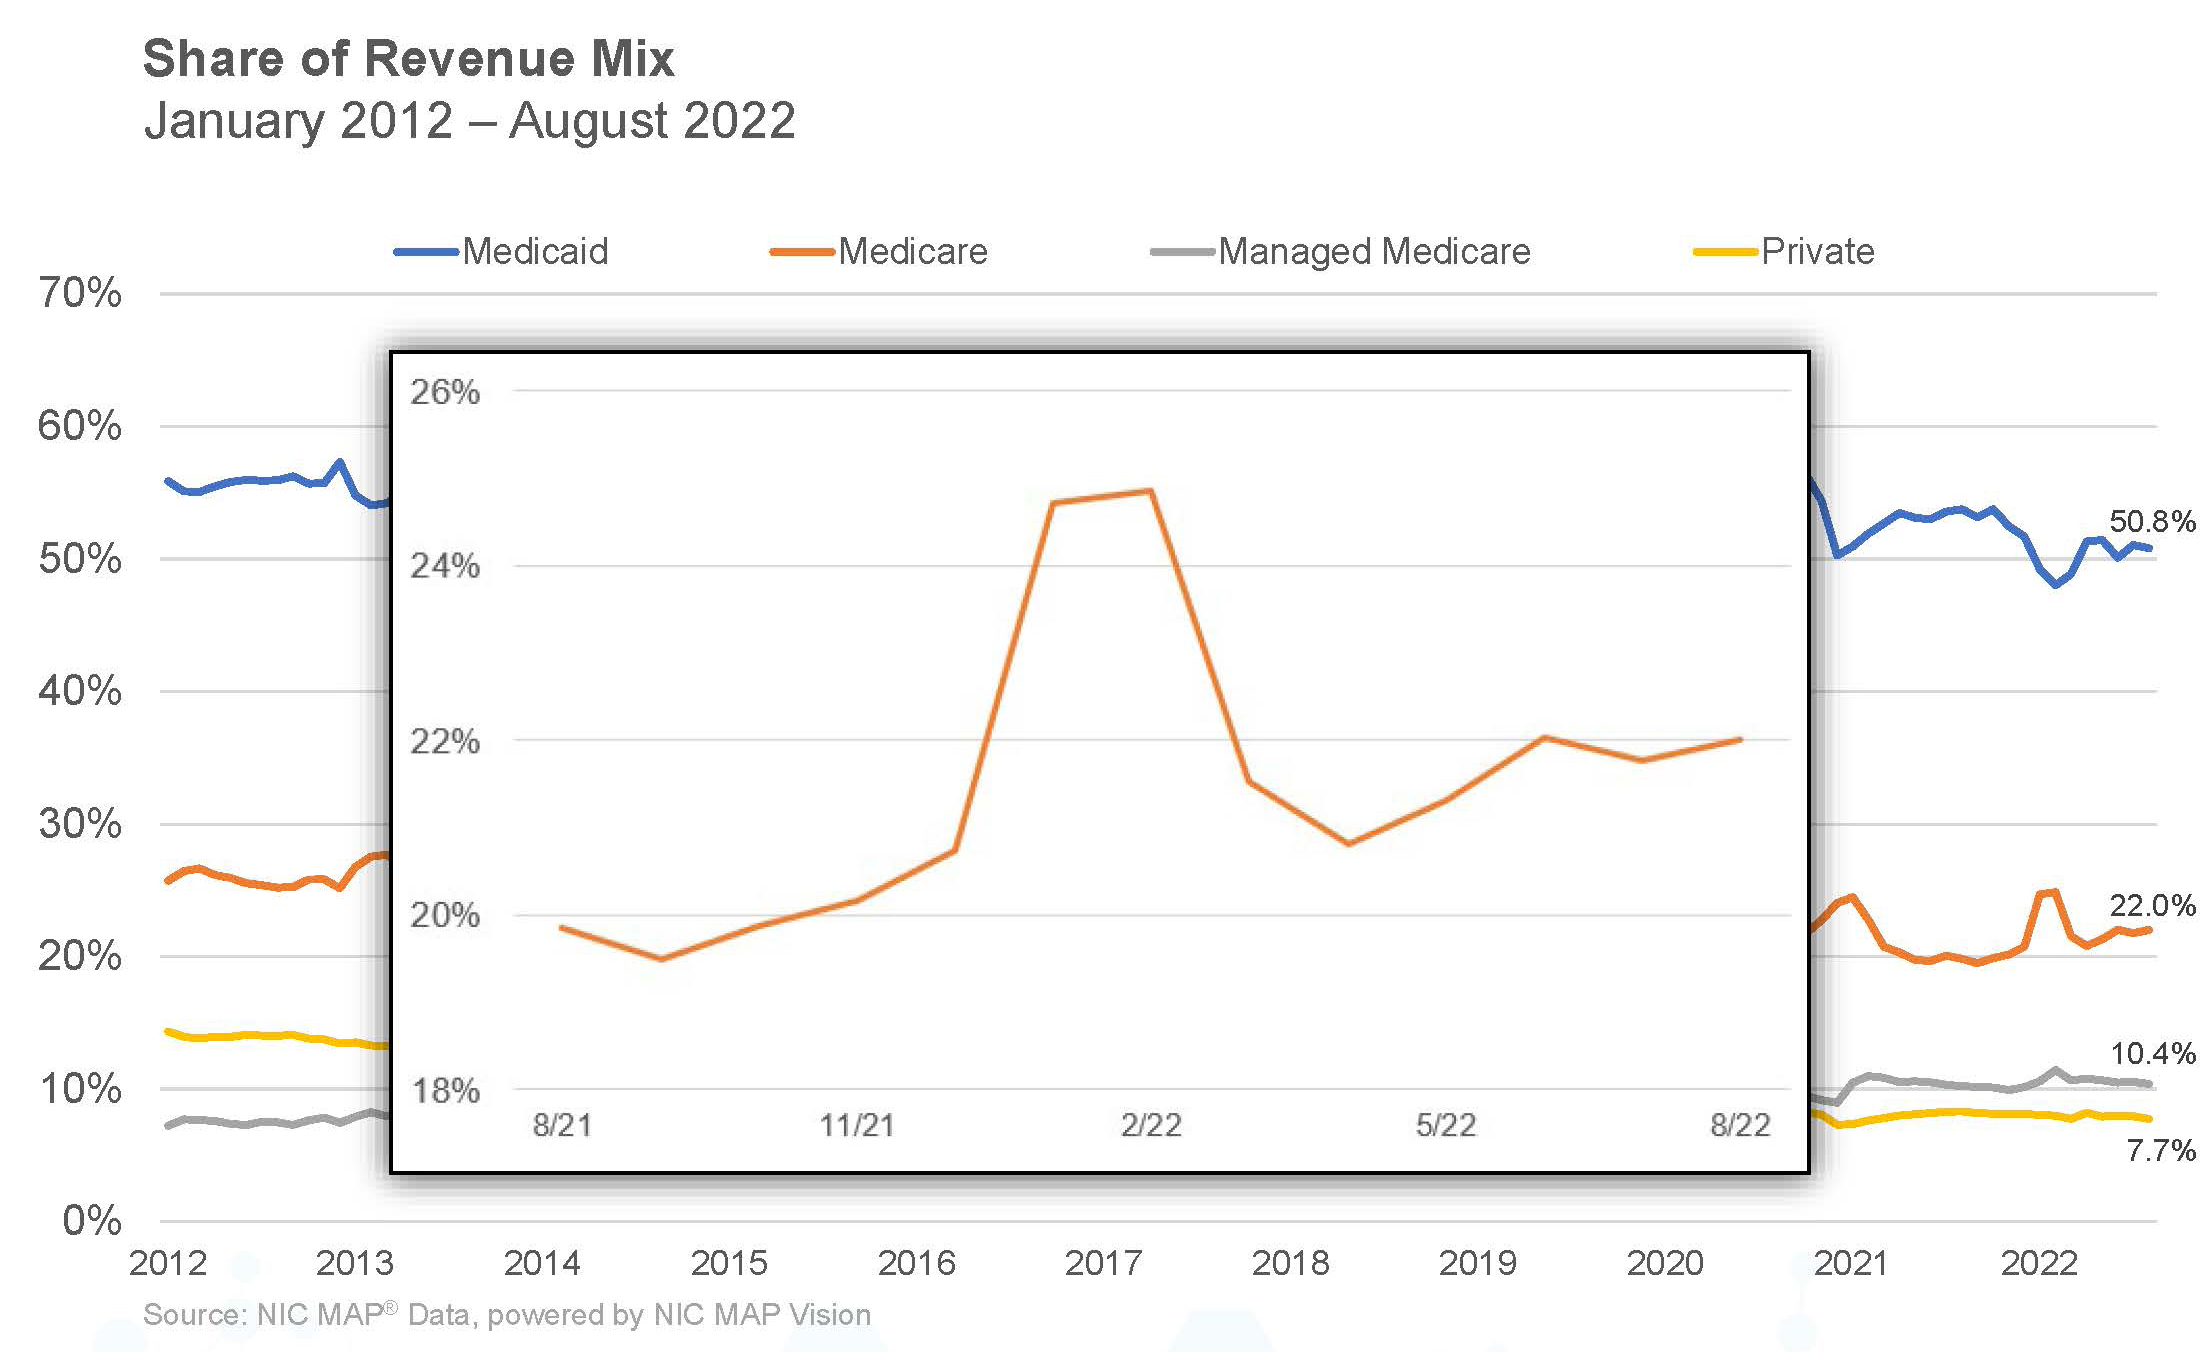
SNF Blog Slides Aug 2022_Final_Page_15While Medicare revenue mix and the revenue per patient day both increased in August, they are down from earlier in the year. In January and February of 2022, increased cases of COVID-19 resulted in additional need for utilizing the 3-Day rule waiver and per day reimbursement for COVD-19 positive patients. Indeed, Medicare revenue mix ended August at 22.0% but is down from its pandemic high of 24.9% set in February 2022. Medicare RPPD is down 2.9% from its pandemic peak of $590 in June 2020. Meanwhile, Managed Medicare revenue mix was down 15 basis points to 10.4% in August. However, this is 229 basis points above the pandemic low of 8.1% set in May 2020.
SNF Blog Slides Aug 2022_Final_Page_13

Managed Medicare revenue per patient day (RPPD) decreased in August and is down 1.2%% from year-earlier levels. Depending on an operator’s business model, the continued decline in managed Medicare revenue per patient day can pose a challenge as the reimbursement differential between Medicare fee-for-service and managed Medicare has increased during the past two years. However, some operators see opportunity to capture patient volume with the growth of managed care. Medicare fee-for-service RPPD ended August 2022 at $573 and managed Medicare ended at $453, representing a $120 differential. In August of 2020, the differential was $105.

After decreasing slightly in the month of July, Medicaid patient day mix increased 23 basis points ending August at 64.9%. However, it has increased 252 basis points from the pandemic low of 62.4% set in February 2022. Meanwhile, Medicaid revenue mix declined 25 basis points from the prior month, ending August at 50.8%. One element of the Medicaid revenue share of a property’s revenue is RPPD and that declined 0.33% from July. However, it up 0.8% since last year in August 2021.

Get more trends from the latest data by downloading the Skilled Nursing Monthly Report. There is no charge for this report.

The report provides aggregate data at the national level from a sampling of skilled nursing operators with multiple properties in the United States. NIC continues to grow its database of participating operators to provide data at localized levels in the future. Operators who are interested in participating can complete a participation form on our website . NIC maintains strict confidentiality of all data it receives.

California’s Middle-Income Population Projections

The analysis revealed several key findings about the potential unmet needs of California’s middle-income seniors.

Building upon the groundbreaking “Forgotten Middle” study and its subsequent update, NORC at the University of Chicago recalibrated a nationally representative forecast of the 2033 middle-market population to produce estimates reflective of future California residents. The analysis revealed several key findings about the potential unmet needs of California’s middle-income seniors, including:

  • The middle-income senior population in California will increase to 1.6 million in 2033 (+60%). Notably, the number of middle-income seniors aged 85 and older in the state is expected to double, from 230,000 to 463,000.

NORC Forgotten Middle CA - Findings_Page_16 V2

While the middle-income senior population is expected to grow substantially in the next decade, only a portion will be able afford the projected cost of private-pay assisted living. With the annual out-of-pocket price point of assisted living and medical care in California at $75,000, even with housing equity, more than half (821,000) of middle-income seniors in California will likely not have the financial resources to afford them. Without housing equity, nearly 90% are projected to struggle with covering the cost of private assisted living over the next decade.

By reducing the potential price point of assisted living, the potential market size expands. If operators can reduce the price point of assisted living by $10,000, an additional 209,000 Californians – an increase of over 25% – would then have the resources available to afford that product.

  • By 2033, 58 percent of California’s middle-income seniors will be unmarried, and 43 percent may not have children living within 10 miles.

NORC Forgotten Middle CA - Findings_Page_13

Having spousal support enables many people to stay in their homes longer and means assets and financial resources remain pooled together. Having children nearby means an increased likelihood of being able to utilize family caregivers. But as people have fewer children – and those children are increasingly less likely to live nearby – this solution becomes harder to make a reality.
These demographic shifts result in fewer available caregivers, which we know as a national ratio falls from seven adult children (aged 45 to 64) to care for one parent over 80 years old to four-to-one in 2030 and three-to-one in 2050.

  • One in five middle-income seniors in California will have cognitive impairments or high needs. A majority will have three or more chronic conditions and mobility limitations.

NORC Forgotten Middle CA - Findings_Page_12

The study also found that most of California’s middle-income seniors are likely to develop multiple chronic conditions and mobility limitations in the next decade, making it challenging for them to live independently.

Additionally, researchers with NORC at the University of Chicago have created illustrative case studies that underscore and help provide examples of the impact these findings have for Californians. View the complete slide deck of findings, including methodology, key findings, case studies, and information on the “near dual” seniors cohort who are close to Medicaid eligibility.