Amidst Increased Digital Leads, Responsive Sales Efforts Drive Move-Ins In Senior Living

After the historical occupancy rebound in 2021, current senior housing sales metrics largely reflect pre-pandemic conditions. But as markets return to normal seasonality patterns, sales and marketing strategies should be adjusted based on data-driven insights and away from pandemic occupancy recovery tactics. 

After the historical occupancy rebound in 2021, current senior housing sales metrics largely reflect pre-pandemic conditions. But as markets return to normal seasonality patterns, sales and marketing strategies should be adjusted based on data-driven insights and away from pandemic occupancy recovery tactics.  

Today, more leads originate from digital sources than ever, making individual attention and personalized nurturing of prospects even more critical. If this is the “new normal,” operators must adjust to managing and engaging growing volumes of inquiries to sustain the occupancy recovery.  

As the pandemic’s significant disruption of the business cycle appears in the rear-view mirror, this article looks back at market conditions leading up to the pandemic compared to present conditions to illustrate the current state of the market and suggest opportunities for operators to boost sales.  

Key takeaways:  

  1. Year-over-year occupancy growth shows signs of a moderate deceleration, suggesting that an adjustment in sales approaches may be appropriate in some situations.  
  2. Sales strategies that rely on “quick wins” may not maximize results.  
  3. Leasing counselors will continue to work with growing volumes of digital leads.   
  4. Personal engagement with prospects is associated with higher conversions.  
  5. Teams must become more resourceful in nurturing prospects from digital sources to increase conversions.

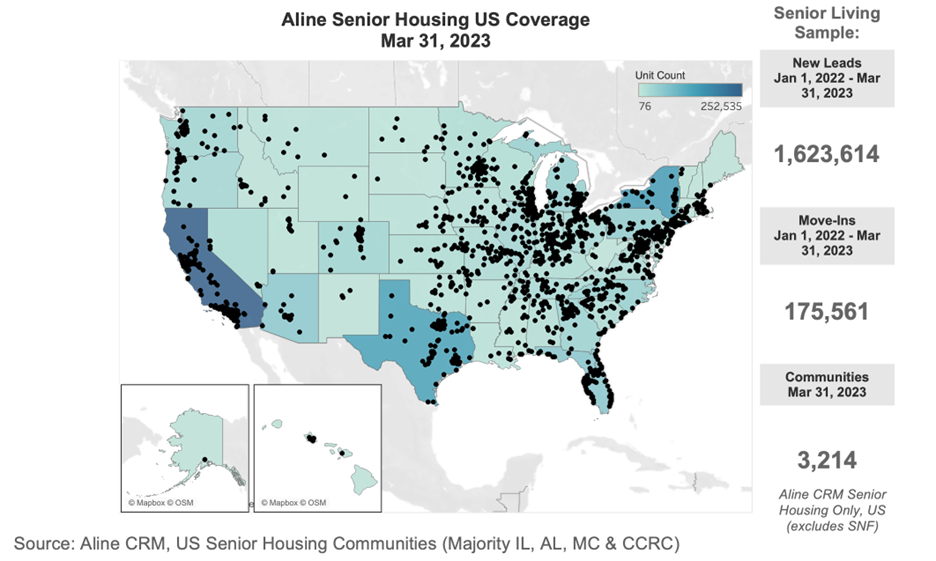
The data used for this analysis include U.S. senior housing data – independent living, assisted living, memory care, and CCRCs (Continuing Care Retirement Communities) – from the Aline Marketing and Sales CRM. This analysis comprises 1,623,614 new leads and 175,561 move-ins.  
Picture1-Aug-07-2023-07-46-58-5835-PM

While still positive, the momentum of senior housing occupancy growth has slowed to some degree since 2022 depending on the property type and geographic location. Some potential reasons for the moderation include downward pressure due to rising rents, increased competition from other senior living options and in-home care, a downturn in housing markets due to interest rate hikes to combat inflation, and deferred capex spending to keep aging properties up to date. Higher acuity options—memory care and assisted living—have experienced the most improvement in occupancy rate growth since emerging from the pandemic.  

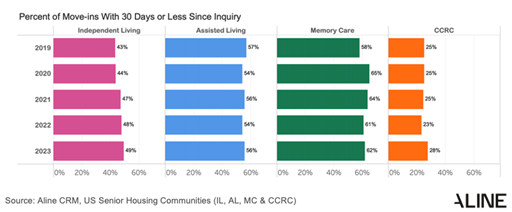
Operators relying on a sales strategy of “quick wins,” with prospects moving in within 30 days of contact, are missing opportunities to increase margins. Contrary to conventional wisdom, the volume of prospects by care level with an “urgent need” to move in (less than 30 days) has changed little since before the pandemic. (It is important to note that “urgent need” does not necessarily equate with prospect acuity.) The percentage of residents that moved in within 30 days of inquiry compared between 2019 and 2023 ranged from 43% to 49% for independent living communities, 57% to 56% for assisted living, 58% to 62% for memory care communities, and from 25% to 28% for CCRCs. Consequently, approximately one-half to just over one-third of independent living, assisted living, or memory care prospects and nearly three-quarters of CCRC leads require more than minimal time and effort from sales teams to exceed baseline expectations.  
Picture2-4


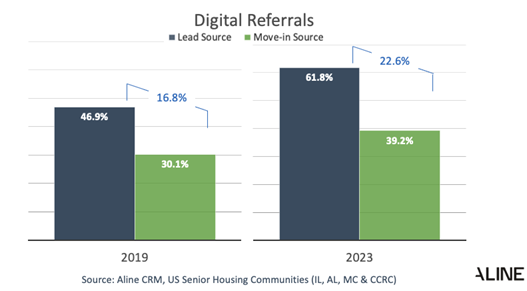
Due to increasing growth in age 75+ households and the growing adoption of digital marketing tools and referral sources to produce inquiries, senior housing lead generation and conversions have increased. Yet conversions have not kept pace to the same degree. In the first quarter of 2023, the average 100-unit building generated 44 leads per month compared to 32 just four years prior—representing an increase of 38%. However, the average 100-unit building generated an average of 4.5 monthly move-ins—a 27% increase since March 2019. On an annual basis, the rate of lead growth in the first quarter of 2023 was 8.6%—an improvement over 2019 (3.0%). Conversely, the annual growth of move-ins in the first quarter of 2023 was 6.3%–notably lower than in 2019 (14.9%).   

Although considerably more leads originate from internet sources than before the pandemic, the increase in conversions from digital marketing, direct website, and paid referral sources has increased but to a lesser degree than the volume of leads produced from these sources. Nearly two-thirds of leads are now generated by digital sources—up from about one-half before the pandemic. However, only about 40% of conversions are derived from these sources (up from 30% before the pandemic).   
Picture3-2


Given the pandemic’s lingering strain on operating budgets and compressed margins, sales and marketing teams are challenged with finding ways to allocate valuable time and resources in the most fruitful ways. According to Aline’s statistical analysis of the productivity of specific sales activities, being responsive instead of reactive and focusing on high-value tasks such as building relationships with prospects results in a higher probability of converting prospects.  

Some typical sales activities are correlated with a higher likelihood of producing move-ins—such as tours, home visits, and planning sessions, while others are less so. Many operators place paramount importance on call-out quotas—but call-outs do not produce move-ins alone! Others bank on time and resource-intensive sales events, but could those efforts be better expended with a personalized plan for the next interaction with a prospect? Activities should be considered based on a prospect’s unique needs and the sales team’s time and resources. Consider professionalizing sales teams and investing in tools that amplify efficiencies and bolster return on investment.  

Demographics will continue to drive inquiries, and more will originate from digital sources. As leasing counselors are challenged to become more resourceful in managing greater volumes of digital leads, high-impact, personalized activities such as voice-to-voice and face-to-face interactions, planning, and creative follow-up are crucial in advancing a prospect. How will sales teams keep up and convert more prospects into sales? Senior housing operators must work smarter, not harder.  


For more information and to schedule a demo, please visit www.alineops.com.   


About Aline 

Aline has the industry’s most extensive and robust set of real-time data for identifying and understanding broad trends in the nation’s senior housing sales and marketing metrics. Providing a senior living operating system created to meet the industry’s most complex challenges – in a single software platform, the company serves sales, operations, and clinical teams in more than 5,700 communities across the senior living, post-acute, and home care sectors. The Aline senior living operating system increases efficiency, delivers performance gains, and connects residents, staff, and family members with industry-leading CRM, marketing automation, financial, reporting and care solutions. 
 

Skilled Nursing Occupancy Continues to Hover Around 81%

NIC MAP Vision released its latest Skilled Nursing Monthly Report on August 3, 2023. The report includes key monthly data points from January 2012 through May 2023.

NIC MAP Vision released its latest Skilled Nursing Monthly Report on August 3, 2023. The report includes key monthly data points from January 2012 through May 2023.   

Here are some key takeaways from the report:

Occupancy

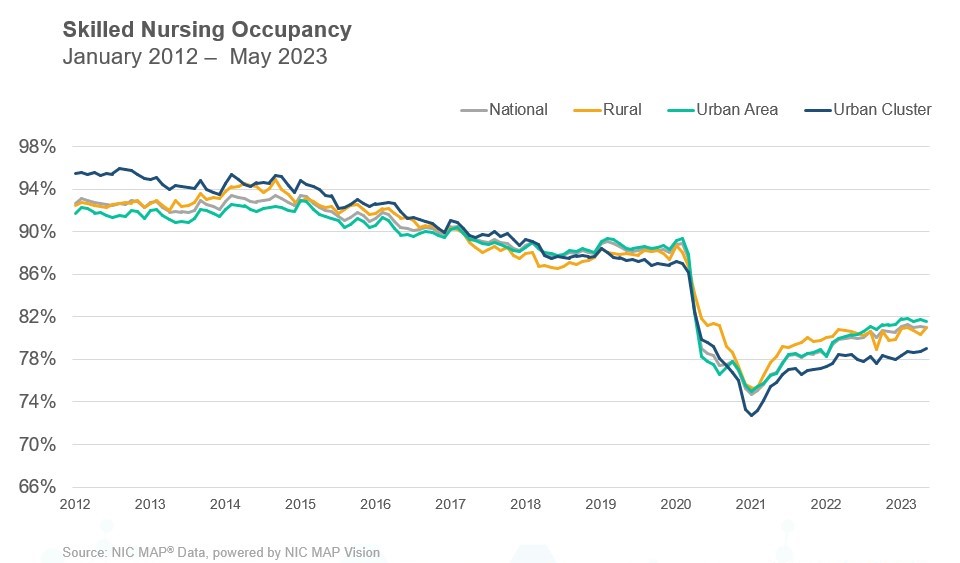
Skilled nursing property occupancy decreased 3 basis points from April to end May at 81.0%. Occupancy is up 97 basis points from one year ago in May 2022 as it continues to recover since the pandemic low of 74.7% set in January 2021. However, occupancy is down 8 basis points from January 2023 as challenges do persist with staffing shortages that continue to create difficulties within skilled nursing properties limiting the ability to admit new residents in some markets. The current occupancy trend over the past year does suggest that demand for skilled nursing properties is recovering. Occupancy remains low compared to February 2020 pre-pandemic levels of 88.9% (7.8 percentage points).

Slide15-2

Managed Care

Managed Medicare revenue mix increased 11 basis points from April to end May at 11.4%. It has declined 111 basis points since its recent high of 12.5% in February 2022, but it is up by 219 basis points from the pandemic low set in May 2020 of 9.2%. Expectations are that it will continue to increase over time with the continued growth of managed Medicare. Meanwhile, Managed Medicare revenue per patient day (RPPD) declined 0.4% ending May at $483 and it is down 0.8% from last year in May 2022.  It has decreased $125 (20.5%) since January 2012 and continues to pressure some operators’ revenue as managed Medicare enrollment grows around the country.  However, some operators see managed Medicare as an opportunity for growth in patient volume.  

Medicaid

Medicaid patient day mix increased 52 basis points to 65.8 % in May. It has increased 268 basis points from the pandemic low of 63.1% set in February 2022. In addition, Medicaid revenue mix increased in February, representing over half of property revenue at 51.1%. It has increased 230 basis points from the pandemic low of 48.8% set in February 2022. Meanwhile, Medicaid revenue per patient day (RPPD) decreased to $269 in May. It increased 3.0% from $261 one year ago in May 2022. 

Medicare

Medicare revenue per patient day (RPPD) increased slightly from April to end May 2023 at $592. It has increased 2.7% since September 2022. Most of this increase in reimbursement is likely a result of the increase in Medicare rates to skilled nursing properties for fiscal year 2023 and potentially higher acuity patients, which also increases RPPD to care for more complex patients. Meanwhile, Medicare revenue mix decreased for the second month in a row. It decreased 98 basis points from April to end May at 20.6%. It is down from one year ago as well, decreasing 34 basis points from May 2022. 


To get more trends from the latest data you can download the Skilled Nursing Monthly Report. There is no charge for this report.

The report provides aggregate data at the national level from a sampling of skilled nursing operators with multiple properties in the United States. NIC continues to grow its database of participating operators to provide data at localized levels in the future. Operators who are interested in participating can complete a participation form on our website. NIC maintains strict confidentiality of all data it receives. 


NIC MAP Vision 2Q23 Key Takeaways: Eighth Consecutive Quarter of Senior Housing Occupancy Gains

NIC MAP Vision clients attended a webinar in mid-July on key senior housing data trends during the second quarter of 2023. Findings were presented by the NIC Analytics research team.

NIC MAP Vision clients, with access to NIC MAP® data, attended a webinar in mid-July on key senior housing data trends during the second quarter of 2023. Findings were presented by the NIC Analytics research team. Key takeaways included the following: 

Takeaway #1: Senior Housing Occupancy Rose 0.6 Percentage Points in 2Q 2023 

  • The occupancy rate for senior housing—where senior housing is defined as the combination of the majority independent living and assisted living property types—rose 0.6 percentage points to 83.7% from the first quarter of 2023 to the second quarter for the 31 NIC MAP Primary Markets. This marked the eighth consecutive quarter of occupancy increases, so we have now seen two years of occupancy gains.
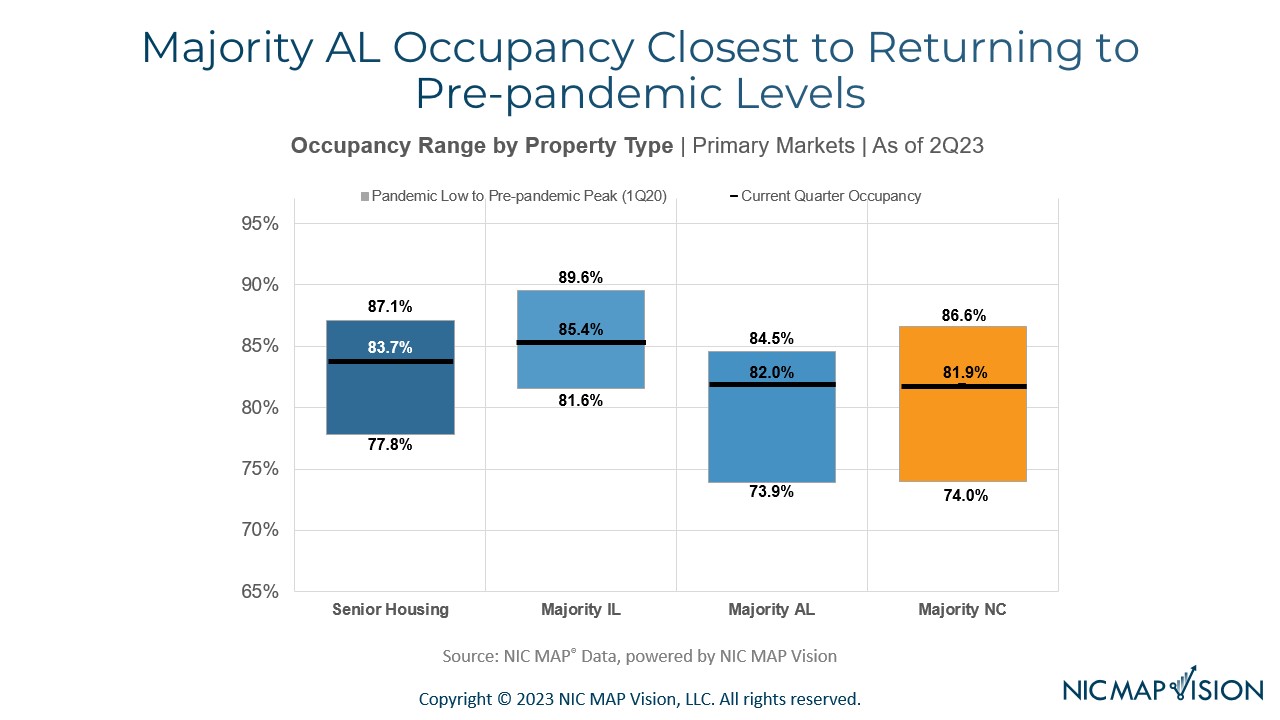
  • At 83.7%, occupancy was 5.9 percentage points above its pandemic-related low of 77.8% recorded in the second quarter of 2021 and was 3.4 percentage points below its pre-pandemic level of 87.1% of the first quarter of 2020.
  • Demand as measured by the change in occupied inventory or net absorption totaled nearly 5,100 units in the Primary Markets. Demand has been positive over the past nine quarters, which has helped occupancy to improve.

Takeaway #2: Majority Assisted Living Occupancy Closest to Returning to Pre-Pandemic Levels 

  • The chart below shows the pace of recovery to date for each property type and the gap remaining to reach pre-pandemic 1Q 2020 occupancy levels.
  • Assisted living has recovered roughly three-fourths of its occupancy losses, while nursing care has recovered nearly two-thirds of its occupancy losses, and each had a second quarter occupancy rate of approximately 82%.
  • Independent living has recovered only half of its occupancy losses, but its current occupancy rate is still highest among these segments.

Slide1-Jul-31-2023-02-55-00-7883-PM


Takeaway #3: 2Q23 Inventory Growth Lowest in the Time Series

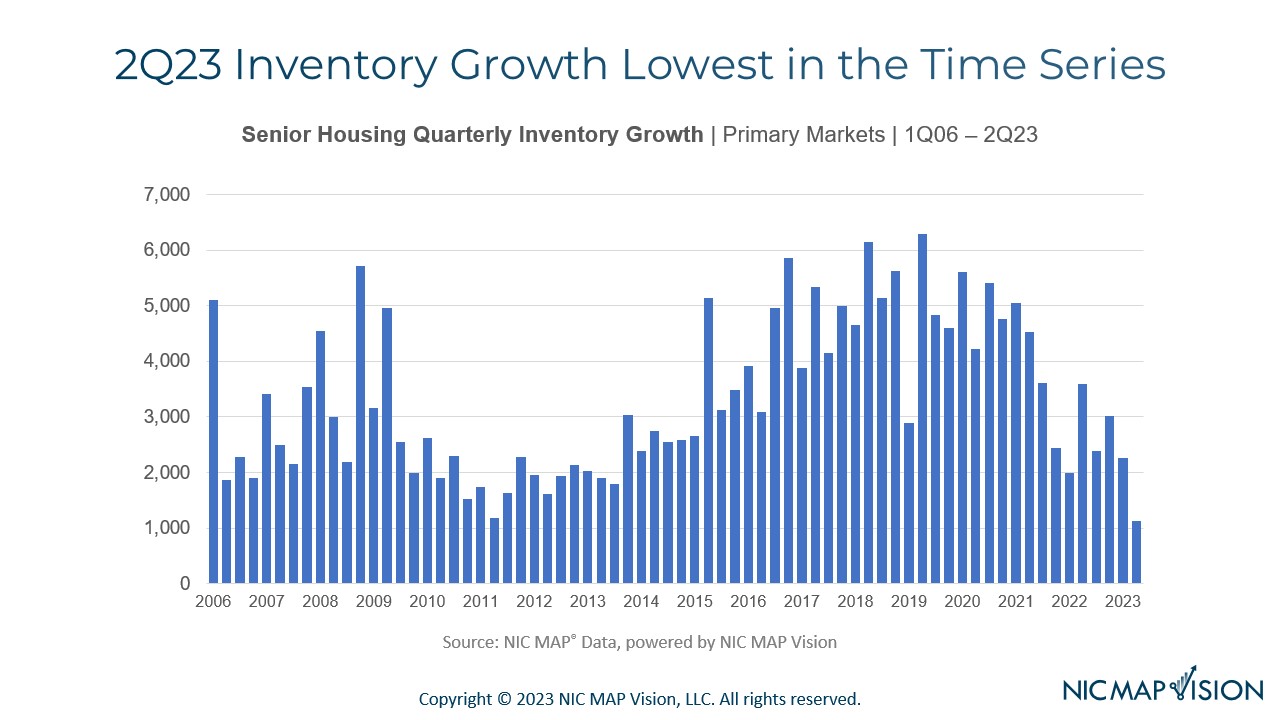
  • Inventory growth continued to be relatively slow, increasing by roughly 1,100 units in the second quarter, which was the lowest level observed since the beginning of the time series in 2006.
  • As you can see in the chart below, inventory growth has generally trended down from its high point of nearly 6,300 units in mid-2019. 

Slide2-Jul-31-2023-02-55-00-8284-PM


Takeaway #4: Units Under Construction Least Since 2015 

  • The number of senior housing units under construction in the 31 NIC MAP Primary Markets also continued to decline and stood at 34,401 units in the second quarter of 2023, which was its lowest level since 2015.
  • Since 2011, the number of units under construction for assisted living has exceeded the number for independent living. In recent quarters, however, the gap between the two property types has narrowed with Majority Assisted Living comprising 52% of units under construction in the second quarter of 2023 and Majority Independent Living comprising 48%, so each made up roughly half of construction. In comparison, Majority Assisted Living comprised more than 70% of units under construction in 2013, which was its peak share.
  • For assisted living, there were a bit under 18,000 units under construction. As a share of existing inventory, this totaled 5.2% which was well below its peak of 10.2% in 2017.  
  • For independent living, there were 16,500 units under construction in the second quarter, equal to 4.6% of existing inventory and down from its peak of 6.5% in 1Q 2020. 
  • Overall, while construction has slowed sharply from its peak levels, there is still construction underway. Furthermore, much of it is concentrated within several individual metro markets. 

Interested in learning more?

The data featured in this article derives from NIC’s analysis of NIC MAP Vision’s Senior Housing Market Fundamentals Data Release. NIC MAP Vision clients with access to NIC MAP data also receive an exclusive invitation to a market fundamentals webinar led by NIC’s Research team where they review each quarter’s trends in context with historical data and current events. To get a better idea of what’s covered, watch an abridged version of the webinar. To learn more about NIC MAP data, powered by NIC MAP Vision, and accessing the data featured in this article, schedule a meeting with a product expert today.

Joe Jedlowski of Distinctive Living Strives for Thoughtful Development Amid a Challenging Senior Housing Landscape

You could say Joe Jedlowski’s career as a successful senior housing developer and operator began when he was a 15-year-old working in a skilled nursing facility.

Joe Jedlowski

You could say Joe Jedlowski’s (image left) career as a successful senior housing developer and operator really began when he was a 15-year-old working in the kitchen of a skilled nursing facility. Raised by his paternal grandmother in New Jersey, he grew up watching her work at senior housing properties and eventually followed in her footsteps trying his hand at various industry positions. 

Jedlowski was a CNA and administrator at a skilled facility, and later head of operations for one of the largest senior housing providers. Fourteen years ago, he joined as the President of Milestone Retirement Communities, which began with six small properties primarily in the Pacific Northwest and ultimately transformed into a 100-asset powerhouse operating in 22 states.  

His wide-ranging, hands-on experience has helped Jedlowski bring balance to the organizations he founded two-and-a-half years ago, Distinctive Living and Distinctive Living Development. “Because I have been in these roles before, I know where to push, and can recognize where to pull back,” he says. “I don’t have unrealistic expectations, but I also don’t accept status quo.”    

“I don’t have unrealistic expectations, but I also don’t accept status quo.” 

Since its inception, Distinctive has been in growth mode. In addition to the 27 assets currently under ownership, 21 more properties are under development. Most of the company’s portfolio is along the Eastern seaboard, from Florida up to Connecticut. The team is also in the process of acquiring operations of 13 other properties. 

Having grown up in tandem with the evolving industry, Jedlowski has gained invaluable insights about the business. More importantly, he developed a passion for the work, and dedication to fellow employees and the residents they serve.  

I sat down with Joe to discuss what gives Distinctive an edge, how he approaches growth amid such an uncertain market, and how past experiences inform his work in the senior care space today. 

Zuccari: What’s driving Distinctive Living in today’s tumultuous development environment? 

Jedlowski: We are in growth mode, but from my perspective, it has to be very thoughtful, structured, and well-informed. We’re also very focused on our own book of business and growing internally. At a high level, we’re opportunistic. It has to be the right deal with the right metrics and the right rents.  

There’s no denying that the industry is going through a hard time right now. And I think it’s going to get harder over the next six months. But now that the Feds have hinted at stabilizing rates, I feel like we’ll have some pressure relieved in Q1 going into Q2 next year.  

“We are in growth mode, but from my perspective, it has to be very thoughtful, structured, and well-informed.”

Zuccari: Due to these tough times, many companies are holding off on development. How do you balance your growth ambitions with the current state of the market? 

Jedlowski: Our approach is based on a few factors that have worked well for us in the past. 

The first is site selection. We spend time looking at sites mostly in mid-to-high barrier to entry markets. Secondly, we do significant market intelligence on these locations to determine how we can maximize our revenue structure. Throughout the process, we’re asking pointed questions: What’s the right amenity space for these assets? What’s the right cost expense load? 

From a development standpoint, we kill around 95 to 98 percent of all of the deals we look at because they’re either too expensive, not enough demand, or we can’t get a good rate. If the market and the demand are good, we then proceed to our capital partners and begin the equity raise into the projects.  

We’re fortunate to have solid equity partners who have deep pockets, but also don’t have senior housing investor fatigue. Many of them are newer to the space and like the market demographics they see—future demand, absorption, and lack of supply.  

Our investor base and team as a whole feel very strongly that, since there has been limited development in the past four years because of COVID, when our projects come out in the next 24 to 36 months, there’s going to be significantly less new supply.  

Occupancy continues to climb in all of the U.S. primary market areas, which has made us more willing to take on extra cost burden as we look to the future. Ultimately, we feel like right now is the time to put the pedal to the metal because of future demand projections and lack of supply to meet them.  

“Ultimately, we feel like right now is the time to put the pedal to the metal because of future demand projections and lack of supply to meet them.”   

Zuccari: Is there a ceiling to your growth ambitions? 

Jedlowski: This is a question I’ve been asked a lot. For me, if all Distinctive could do well is what we’re doing today, then I would be content. We certainly want to grow, but whatever project we take on, whether it’s development or operations, we want to be able to adequately live up to the expectations of our capital and also meet the expectations of the employees and residents that we serve.  

The bottom line is if we can’t do it well then we’re not going to do it. If we have confidence we can do it, we’re going to go in and hit it head on.   

Zuccari: How are you innovating in the senior care development vertical? 

Jedlowski: The first part of the development phase is looking at a piece of dirt and determining what you can build on it. Distinctive strategically partners with an architectural firm based in D.C. Part of their company is located in Vietnam, which gives us a competitive advantage and saves us a lot of money. We can have a project brought to us by noon today, and by tomorrow, have a very rough concept plan of what this project will look like. We’re able to present site details including how many stories and units to build, if there are setbacks on the land, and how the property will fit spatially on the land—all while staying compliant with city requirements.  

These site plans can often take up to two weeks, so speeding up the architectural programming phase of the design and development has given us an invaluable edge over other developers in the space. 

Zuccari: Is there anything else that sets you apart from traditional senior care development companies? 

Jedlowski: We have a fully vertical platform. Distinctive has an interest in a general contracting company, which allows us to control construction costs. It also gives us insight into what’s going on behind the curtain as it relates to supply and labor costs. Additionally, we’re able to put up completion guarantees.  

Our operating and development platform really work in unison. We can holistically look at a project and decide if we can push rates, or figure out how to value engineer an asset. I think that whole complement of our interdisciplinary team members is critical to our success.  

“I think that whole complement of our interdisciplinary team members is critical to our success.”

Zuccari: When you’re considering taking over an asset, what’s the first thing you do? 

Jedlowski: Our first point of business is pulling market demographics and data. Sometimes we’ll get a call from owners saying they’re unhappy with their management. When we go and look at the market and realize that it’s not the operator that’s the problem. Oftentimes, we come to the conclusion that we likely won’t be able to do any better than the company currently in place.  

The second part, and probably the most important, is team evaluations. Like any business, employees dictate the success of a building. If the team isn’t strong, we’ll go and put the right team in place.  

Lastly, we drop in all of Distinctive’s signature programs: memory care, Distinctive dining, and others. The combination of those elements—good team, good market, good programs—typically yields us good results.   

” The combination of those elements—good team, good market, good programs—typically yields us good results.”   

Zuccari: How has your past experience informed how you do business today? 

Jedlowski: In this business, we tend to prioritize the residents above all else. For me, my partners, and our organization, we lean very much into our employees because we believe that will trickle down to the residents.  

I remember one boss, a director of nursing at a facility, who treated me like absolute trash. I often think about how that made me feel and remind my senior leadership—you get from our team members what you put in.   

That’s a huge part of our company culture. The folks who probably work the most, make the least, and have the greatest obligations at home, are the people foundational to our business. Regardless of all the bells and whistles and the snazzy names we put on programs, taking care of people is the core of what we do. 

“The folks who probably work the most, make the least, and have the greatest obligations at home, are the people foundational to our business.”

___

New Metric: Absorption-to-Inventory-Growth Ratio for Senior Housing Reached New High in 2Q 2023

According to 2nd quarter 2023 NIC MAP® data, senior housing demand, as measured by the change in occupied units, continued to outpace new supply.

Strong Demand Has Provided a Stable Foundation for Senior Housing Occupancy Recovery. 

According to second quarter 2023 NIC MAP® data, released by NIC MAP Vision, senior housing demand, as measured by the change in occupied units, continued to outpace new supply, marking its ninth consecutive quarter of growth with a net
absorption gain for the NIC MAP Primary Markets of 5,092 units or 0.9% from the prior quarter and 25,803 units or 4.6% from year-earlier levels. Senior housing occupied stock is now 2.6% or 15,026 units above the pre-pandemic 1Q 2020 level. 
 

The strong demand for senior housing has been a significant driving force behind its ongoing occupancy recovery. With the population of older adults on the rise, there is a growing need for quality senior housing options. This consistent and growing demand has provided a stable foundation for many senior housing properties, helping to mitigate the impact on operators of economic fluctuations, rising expenses, and challenging capital market conditions. 

Limited Construction Activity and Moderate Inventory Growth Have Assisted the Senior Housing Occupancy Recovery.  

The continued recovery of senior housing occupancy has also been positively influenced by the moderate inventory growth that has resulted from fewer construction starts. In the second quarter of 2023, the inventory of senior housing properties in the NIC MAP Primary Markets increased by just 0.2% or 1,128 units from the prior quarter and 1.3% or 8,797 units from year-earlier levels. These were the smallest inventory increases in the last decade. Additionally, within the NIC MAP Primary Markets, construction starts continued to be limited compared with pre-pandemic levels. Notably, over the four-quarter period ending in the second quarter of 2023, senior housing starts totaled 11,673 units, marking a level not seen since 2012 and representing less than half of the starts reported during the four quarters of 2019. 

A New Metric to Depict Strong Demand and Moderate New Supply: The Absorption-to-Inventory-Growth (AIG) Ratio. 

To add perspective on demand and supply changes, NIC Analytics has created a new concept to consider. This measure offers a nuanced perspective on the balance between demand and supply. Called the absorption-to-inventory-growth ratio, this metric is calculated by dividing the number of newly occupied units within a given time period by the number of new units added to the market inventory during the same period. The ratio serves as an indicator of how effectively the market absorbs the newly supplied units. A higher positive ratio suggests stronger demand relative to the inventory growth, indicating a healthier balanced market, a lower positive ratio may indicate slower absorption of new units, potentially signaling an oversupplied market or weaker demand. Conversely, a negative ratio may indicate negative demand.  

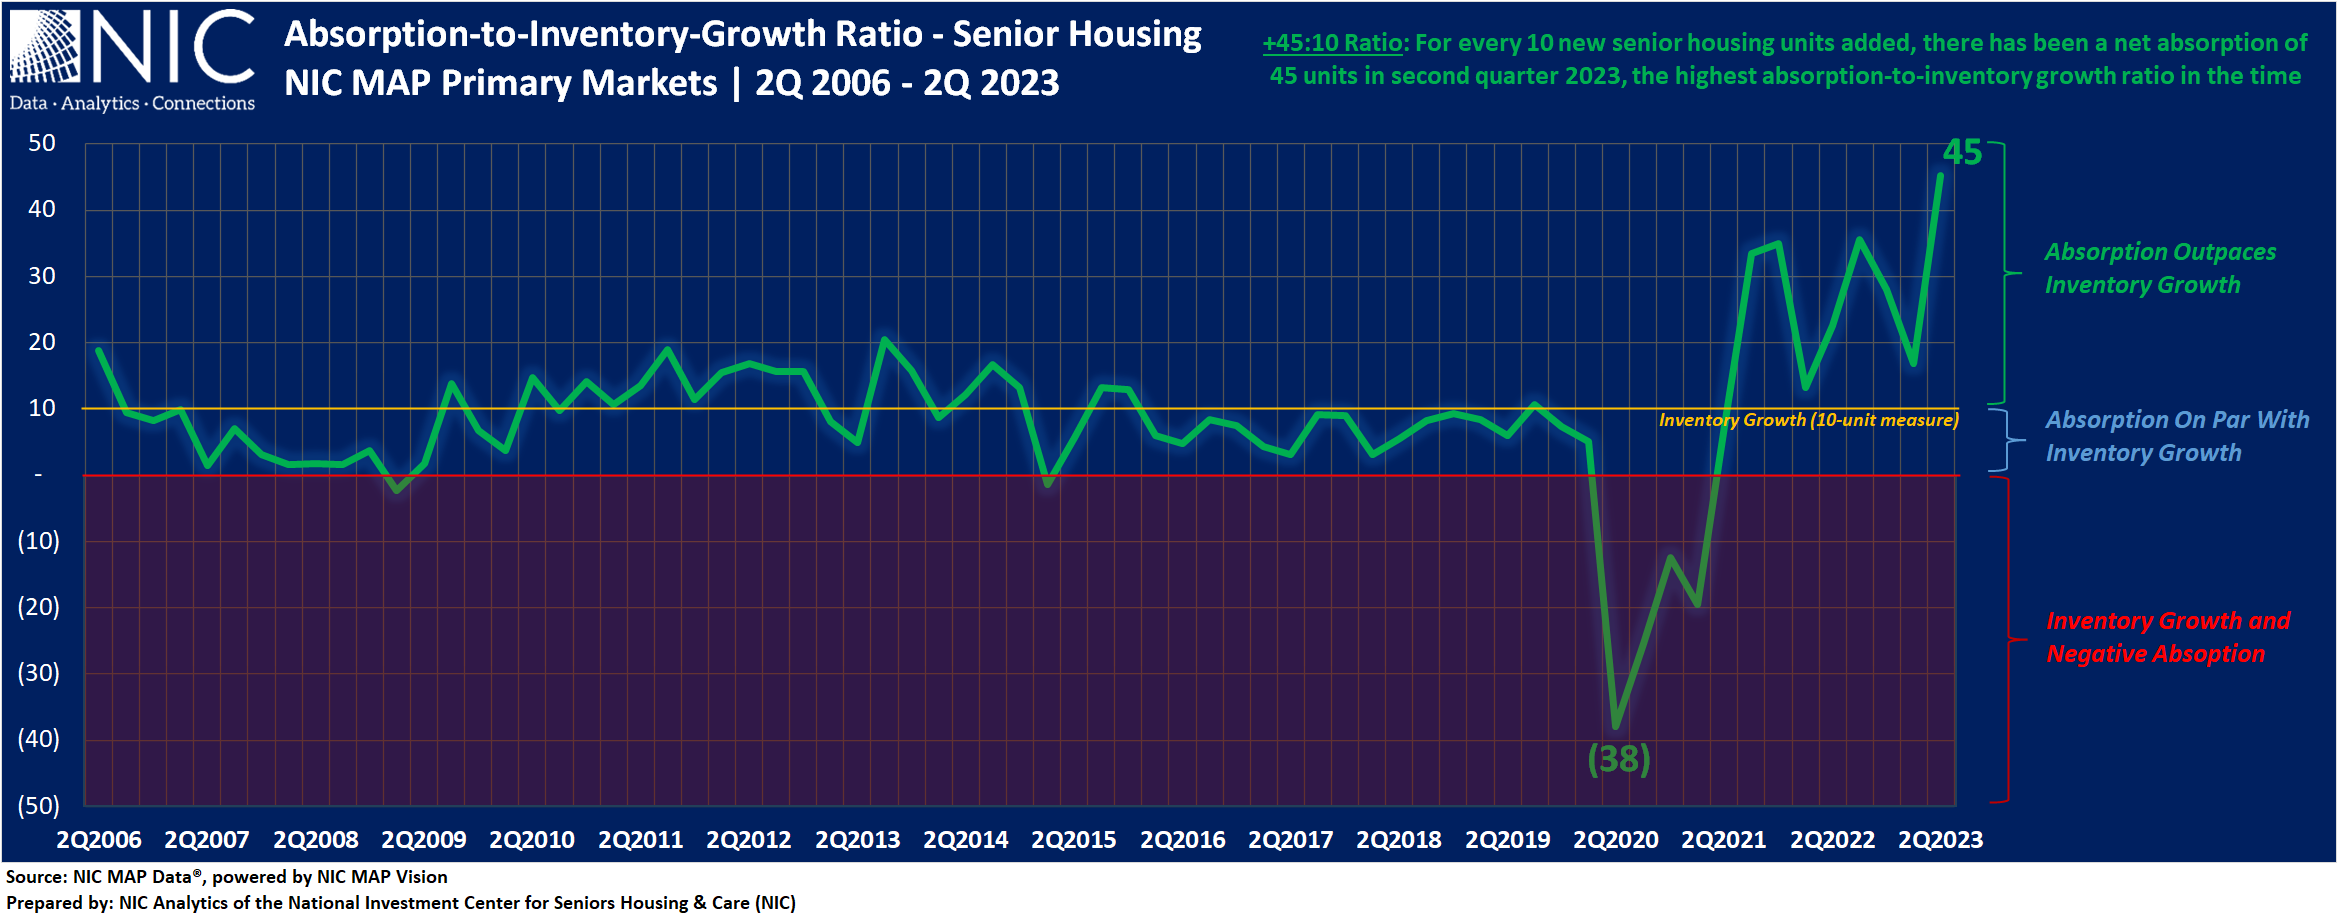
The exhibit below depicts the senior housing absorption-to-inventory growth ratio for the NIC MAP Primary Markets since 2006. In the second quarter of 2023, for every 10 new senior housing units added, there has been a net absorption of 45 units, the highest absorption-to-inventory-growth ratio (+45:10) since NIC MAP Vision began reporting the data in 2005. This indicates a strong demand for senior housing, as the market has been able to absorb a significantly higher number of units than were added during the second quarter of 2023.  

The exhibit depicts the senior housing absorption-to-inventory growth ratio for the NIC MAP Primary Markets since 2006. In the second quarter of 2023, for every 10 new senior housing units added, there has been a net absorption of 45 units, the highest absorption-to-inventory-growth ratio since NIC MAP Vision began reporting.  Chart also depicts  2Q of 2020, having ratio of -38:10. 

In the second quarter of 2020, the height of the pandemic, this ratio was -38:10; in other words, for every 10 new senior housing units added, 38 units had been placed back in the market. 

From the second quarter of 2006 to the second quarter of 2023, the senior housing market experienced negative absorption in just six quarters. These quarters include the first quarter of 2009, the first quarter of 2015, and four consecutive quarters during the pandemic from the second quarter of 2020 to the first quarter of 2021. 

Occupancy has Increased for Two Years Straight, but Still has Room Before Reaching Pre-Pandemic Levels. 

As a result of this trend of positive demand coupled with a moderate pace of new supply and reflected in the recently strong absorption-to-inventory-growth ratios, the senior housing all-occupancy rate for the NIC MAP Primary Markets increased for the eighth consecutive quarter to 83.7% in the second quarter 2023, up 0.6 percentage points (pps) from the prior quarter. From its time series low of 77.8% in second quarter 2021, occupancy increased by 5.9pps but remained 3.4pps below pre-pandemic first quarter 2020 levels of 87.1%.  

By majority property type. At 85.4%, the all-occupancy rate for majority independent living (IL) properties for the NIC MAP Primary Markets increased by 0.3pps from the first quarter 2023. For majority assisted living properties (AL), the all-occupancy rate for the NIC MAP Primary Markets was up 0.8pps to 82.0% in the second quarter 2023. 

The senior housing market continues to experience a trend of higher acuity. Occupancy for assisted living continued to recover relatively faster than independent living. From its pandemic-related low, occupancy for assisted living increased by 8.1pps, more than twice the increase for independent living (up 3.8pps since second quarter 2021). However, occupancy for both independent living properties and assisted living properties remained 4.2pps and 2.5pps below their respective first quarter 2020 levels. 

As background, assisted living occupancy for the NIC MAP Secondary Markets, currently at 83.6%, is only 0.6pps to fully recover and return to first quarter 2020 levels (84.2%).  

Occupancy Recovery Across the 31 NIC MAP Primary Markets.  

In 14 of the 31 NIC MAP Primary Markets, assisted living occupancy rates have either returned to pre-pandemic first quarter 2020 levels or exceeded them, with some markets being within less than 1pps from returning to their first quarter 2020 levels. Notable examples include Phoenix, where occupancy stands at 82.1%, surpassing the first quarter 2020 level by 1.6pps, and Kansas City, with occupancy at 85.9%, exceeding the first quarter 2020 level by 2.4pps. Other markets such as Orlando, Denver, Detroit, Tampa, Cleveland, Cincinnati, Dallas, Miami, Atlanta, San Antonio, and Portland have also demonstrated notable recovery in assisted living occupancy rates.  

For independent living, out of the 31 NIC MAP Primary Markets, only five have returned/exceeded first quarter 2020 occupancy levels or are within less than 1pps of reaching that benchmark. Some of these markets include Riverside (85.3%, 1.7pps above first quarter 2020 level), and San Antonio (86.5%, 1.3pps above first quarter 2020 level).  

In conclusion, the recovery of senior housing occupancy can be attributed to a combination of factors, including demand-side and supply-side measures as well as the combination of both measures as reflected in the absorption-to-inventory-growth ratio. The consistent and growing demand, coupled with moderate levels of new supply, has played a role in this recovery. However, it is important to acknowledge that occupancy rates for senior housing across different markets and properties still have room for further improvement before reaching recovery to pre-pandemic levels. 

In future blogs, NIC Analytics will conduct an in-depth exploration of the absorption-to-inventory-growth (AIG) ratio to uncover insights into the dynamics of various markets, understand the efficiency of new unit absorption, and how supply and demand factors interact in shaping market conditions. 

Keep track of the timely review of the sector’s market fundamentals and trends. The NIC Intra-Quarterly Snapshot monthly publication, available for complimentary download on our website, continues to provide a powerful and closely watched means to stay ahead of industry trends. 

The July 2023 Intra-Quarterly Snapshot report will be released on our website on Thursday, August 10, 2023, at 4:30 p.m.   

Interested in learning more about NIC MAP Intra-Quarterly data? To learn more about NIC MAP Vision data, schedule a meeting with a product expert today.