A Closer Look at Freestanding Nursing Care Communities
This analysis examines the supply-demand dynamics, regional occupancy patterns, and rate growth trends among 5,461 freestanding nursing care communities across the 99 NIC MAP Primary and Secondary Markets as of the first quarter of 2026.
Fundamentals of Freestanding Nursing Care Communities
Occupancy Continues to Rise
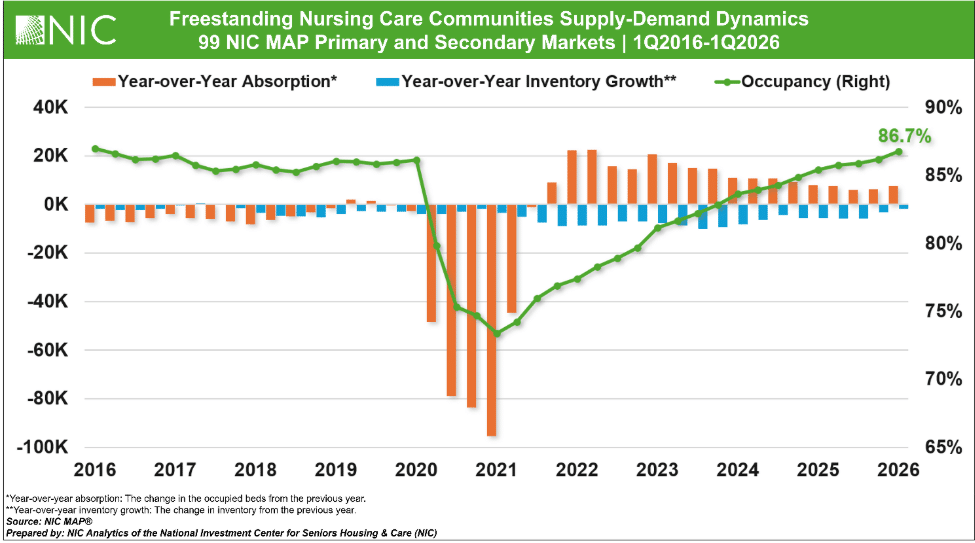
The occupancy rate for freestanding nursing care communities reached 86.7% in the first quarter of 2026 across the 99 Primary and Secondary Markets. After reaching a series low of 73.4% in the first quarter of 2021, occupancy increased for 20 consecutive quarters, gaining a cumulative 13.3 percentage points through the first quarter of 2026. This sustained improvement reflects strengthening demand fundamentals, supported by positive absorption and continued inventory contraction. At 86.7%, freestanding nursing care occupancy is now at its highest level since 2016.
Demand Remains Resilient After moderating from the elevated levels recorded in 2022 and 2023, often attributed to the post-pandemic recovery, year-over-year absorption for freestanding nursing care communities across the 99 Primary and Secondary Markets stood at 1.3% (7,738 newly occupied beds) in the first quarter of 2026, compared to 3.7% (20,692 newly occupied beds) in the first quarter of 2023. Despite the moderating demand, the continued positive absorption pattern for 18 consecutive quarters through early 2026 suggests that demand remains resilient across the nursing care sector. This is a marked difference in the demand levels seen in the quarters leading up to the pandemic.
Supply Contraction Slows Across the 99 Primary and Secondary Markets, year-over-year inventory growth for freestanding nursing care communities has remained negative, reflecting a prolonged period of supply reduction. The contraction was especially significant from 2021 through 2024, when year-over-year inventory declines often ranged from approximately 6,000 to 10,000 beds. More recently, however, the pace of decline has slowed, with year-over-year inventory declines narrowing from negative 0.8% (-5,512 beds) in the first quarter of 2025 to negative 0.2% (-1,704 beds) in early 2026.
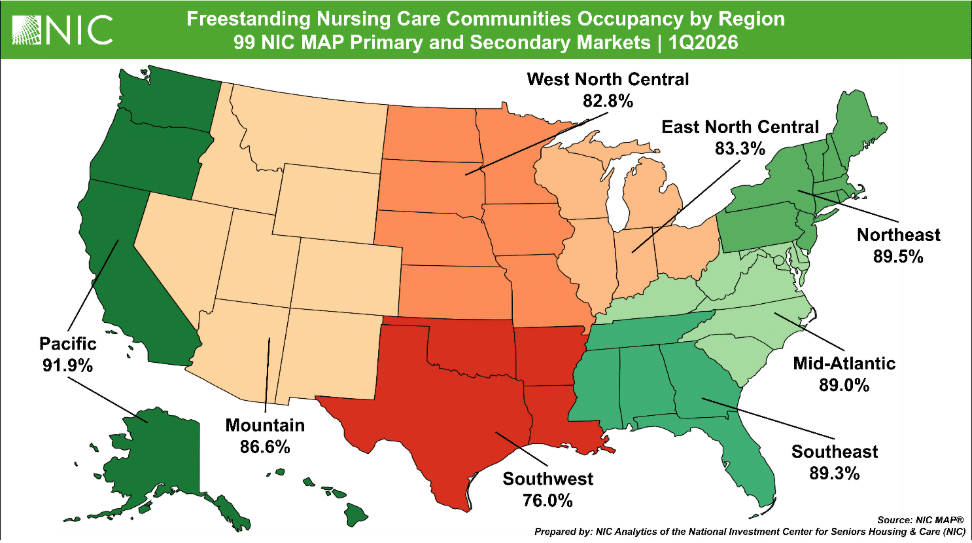
Regional Occupancy Patterns The following map shows regional occupancy rates for freestanding nursing care communities across the 99 Primary and Secondary Markets in the first quarter of 2026.
The Pacific region recorded the highest occupancy at 91.9%, supported by strong performance across several California markets. The Northeast, Southeast, and Mid-Atlantic regions also posted relatively strong occupancy, each reaching approximately 89% or higher.
By contrast, the Southwest region had the lowest occupancy at 76.0%, well below all other regions, with several Texas and Oklahoma markets reporting relatively lower occupancy. The East North Central and West North Central regions also reported below-average occupancy among the 99 Primary and Secondary Markets, at 83.3% and 82.8%, respectively, while the Mountain region was closer to the national average (86.7%) with 86.6% of beds occupied in the first quarter.
Overall, the regional pattern suggests that freestanding nursing care occupancy is strongest in several coastal regions, while parts of the Southwest continue to lag.
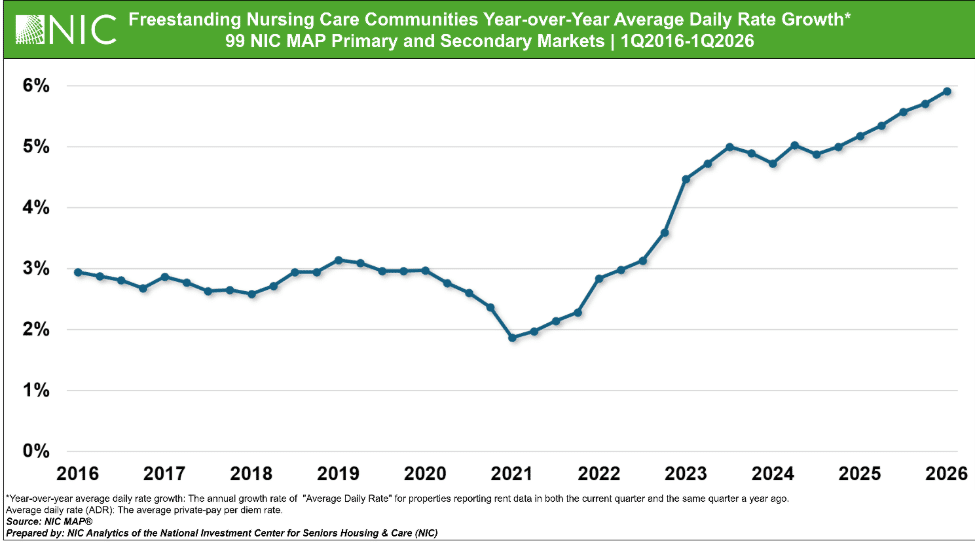
Year-over-Year Rate Growth Surpassed 5% The exhibit below shows the year-over-year average private-pay daily rate growth for freestanding nursing care communities across the 99 Primary and Secondary Markets.
In the first quarter of 2026, year-over-year rate growth for freestanding nursing care communities remained elevated at 5.9%, the highest level recorded between 2016 and 2026. After remaining relatively modest from 2016 through 2021, year-over-year rate growth began to strengthen in 2022 and has stayed elevated since 2023. More recently, the pace of growth continued to increase, rising from 4.7% in the first quarter of 2024 to 5.2% in the first quarter of 2025 and 5.9% in the first quarter of 2026, indicating sustained pricing momentum across the nursing care sector. As a result, the average daily rate reached $420 in the first quarter of 2026, representing a 27.5% increase from the first quarter of 2019.
Look for future articles from NIC to learn more about the nursing care sector.
Senior Housing Occupancy Climbs in Second Quarter 2026
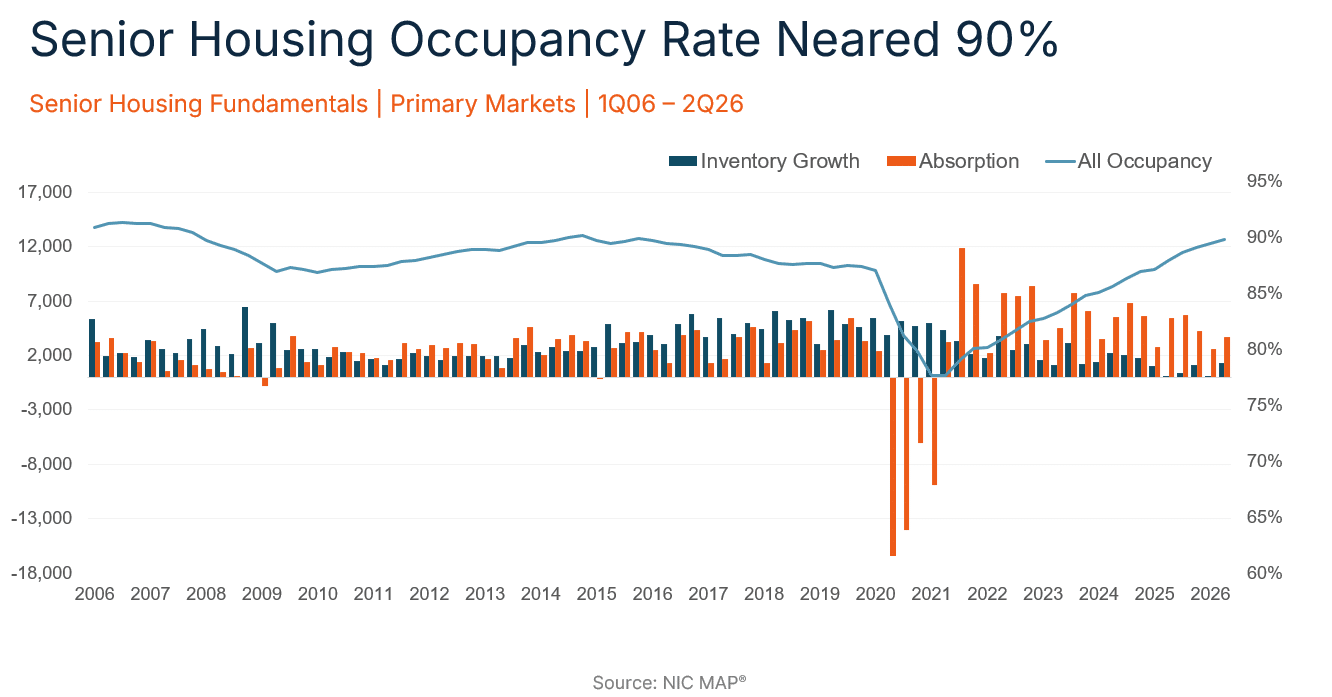
Senior housing occupancy reached 89.9% in the second quarter of 2026, up 0.4 percentage points, with the number of occupied senior housing units increasing to a new record level. Year-over-year inventory growth remained near record lows. Average annual asking rent growth remained above historical averages and rolling four-quarter pricing per unit for senior housing and nursing transactions were near or at historic highs.
These and other findings on quarterly senior housing data trends were presented by NIC’s Research & Analytics team during a recent webinar with NIC MAP clients. Additionally, Ben Firestone, CEO & Co-Founder of Blueprint, joined Lisa McCracken, Head of Research & Analytics at NIC, on the webinar to discuss transaction activity and marketplace trends. Key takeaways included the following.
The occupancy rate for senior housing rose 0.4 percentage points in the second quarter for the 31 NIC MAP Primary Markets to reach 89.9%, driven by positive net absorption outpacing the number of new units arriving online.
The occupancy rate is only 10 basis points from crossing the 90% threshold for the 31 Primary Markets.
The current level of 89.9% was last reached at the end of 2015, more than ten years ago.
Takeaway #2: Gap Between Independent Living and Assisted Living Narrowed
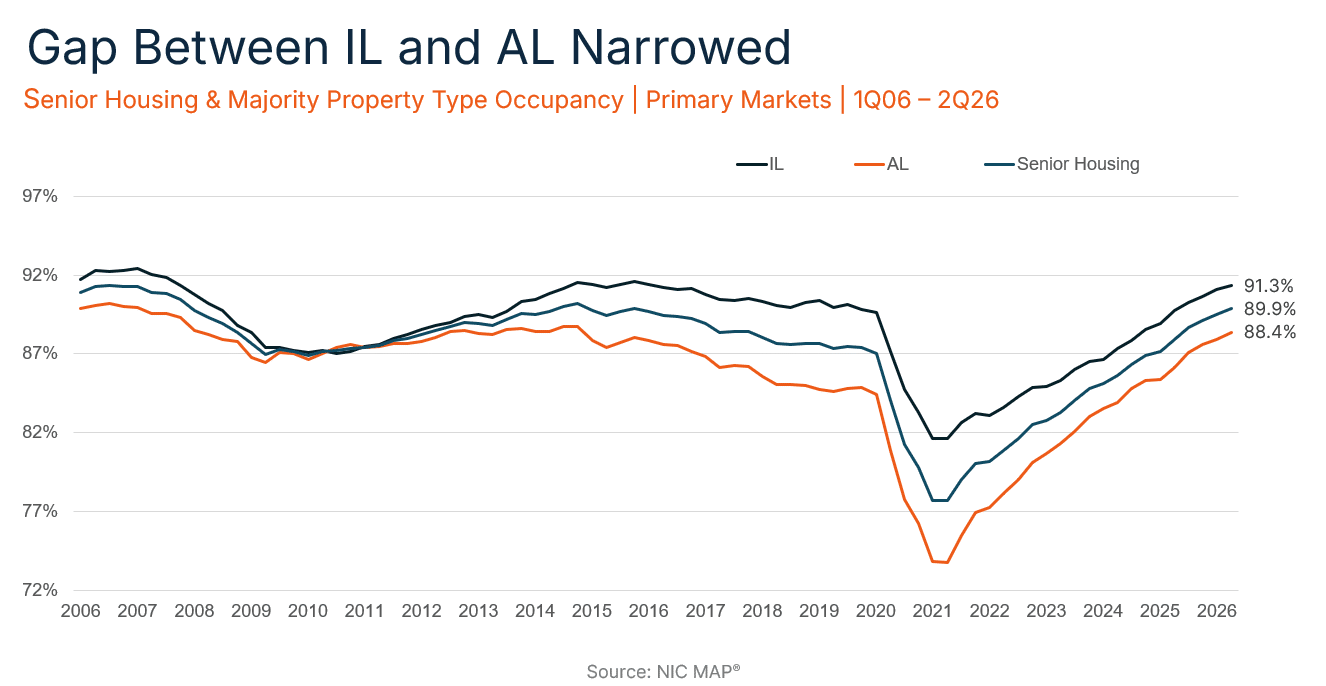
Breaking out occupancies by property type, the occupancy rate for independent living (IL) communities rose 0.3 percentage points in the second quarter to 91.3%, while the occupancy rate for assisted living (AL) communities rose 0.4 percentage points to 88.4%.
The gap between AL and IL occupancy rates narrowed to only 2.9 percentage points in the second quarter, which was the smallest spread between the two rates since 2014.
Takeaway #3: Half of Primary Markets Above 90% Occupied
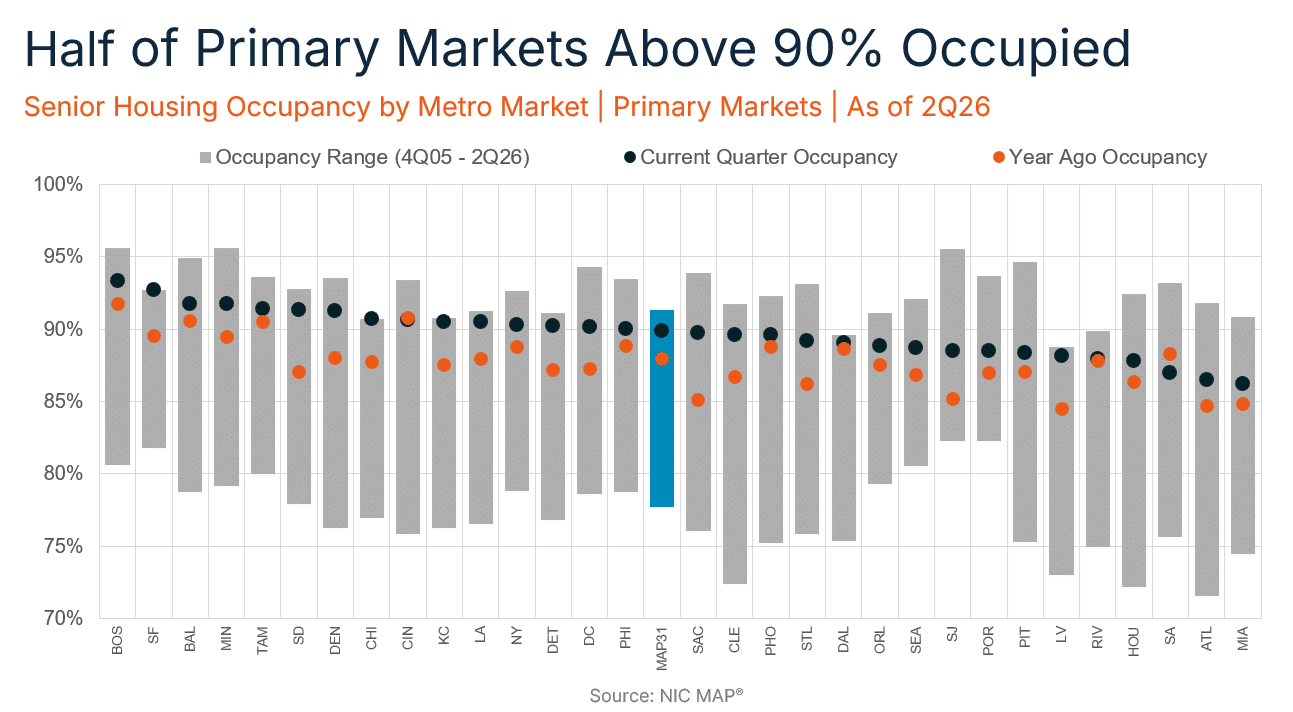
Fifteen of the 31 Primary Markets had occupancy rates at or above 90% in the second quarter, which was three times the number of markets above 90% only three quarters earlier.
There were a few notable markets where occupancy rates in the second quarter were slightly above their all-time highs, such as San Francisco (92.7%), Chicago (90.7%), and Kansas City (90.5%).
Takeaway #4: Inventory Growth Remained Near Record Lows
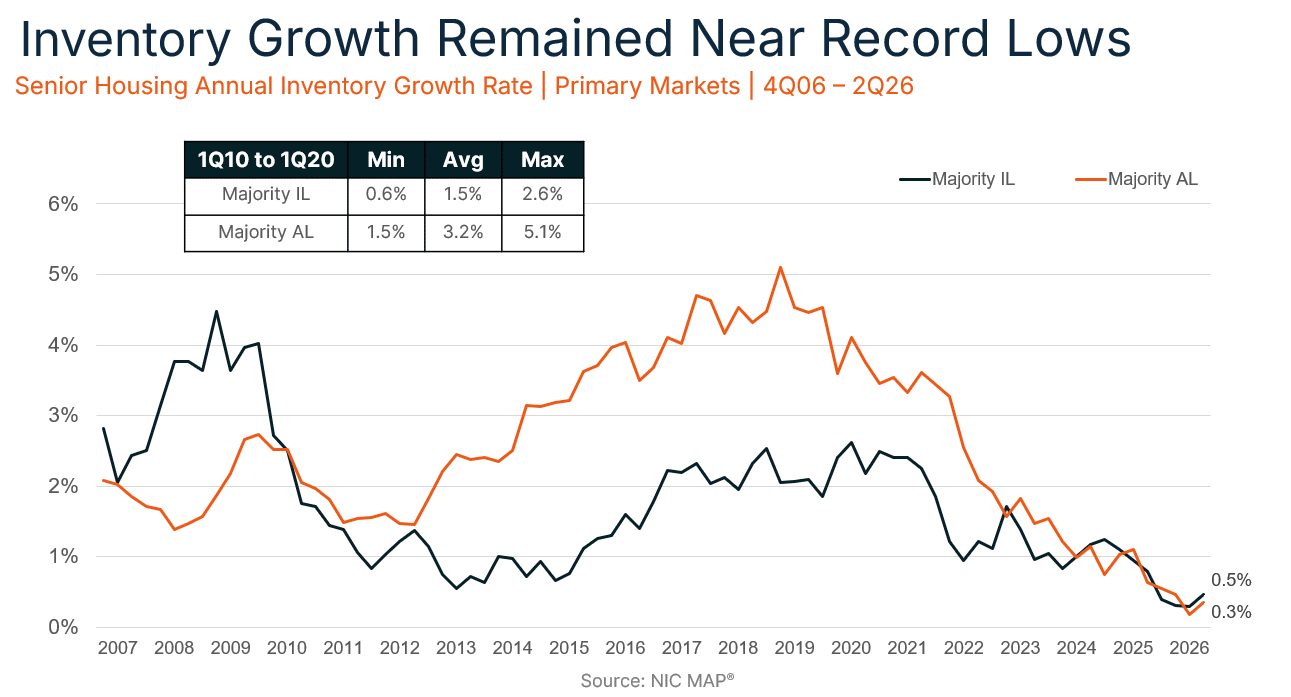
Turning to new supply, year-over-year inventory growth remained below 1.0% for the fifth consecutive quarter and near the time series low.
Breaking out new supply by property type, independent living inventory increased 0.5% from a year earlier, well below its historical average growth of 1.5% annually.
Assisted living inventory increased only 0.3% from a year earlier, well below its historical average growth of more than 3% annually.
Memory Care – An Analysis of the Sector’s Standing and Dynamics
In this article, we focus on the memory care sector, a senior housing segment designed for residents with Alzheimer’s or other forms of dementia, within the combined 99 NIC MAP Primary and Secondary Markets, analyzing occupancy rates as well as supply and demand dynamics across property and campus types. Note that memory care uses the NIC MAP segment-type designation, meaning the data reflect memory care units located at any type of property.
According to the Alzheimer’s Association’s 2026 Facts and Figures report, an estimated 7.4 million Americans aged 65 and older are now living with Alzheimer’s – up from the 6.5 million estimate only three years ago, and a figure that crosses 7 million for the first time. About one in ten people aged 65 and older (11%) are affected, and roughly 74% of those living with the disease are age 75 or older. By 2030, that population is projected to rise to nearly 8.5 million. Notably, the first of the Baby Boomers turn 80 in 2026, the age cohort most directly associated with entry into memory care, and marking a demographic inflection point that the sector has anticipated for years.
Fundamentals of the Memory Care Segment
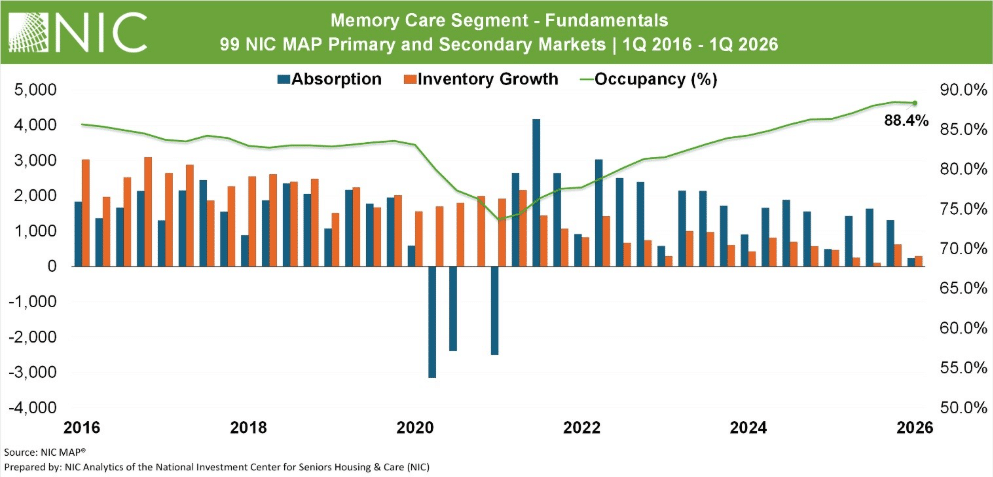
Occupancy. Memory care occupancy in the 99 Primary and Secondary Markets stood at 88.4% in the first quarter of 2026, up 2.1 percentage points from year-earlier levels and about 6.0 percentage points from early 2019. As background, independent living segment occupancy moved above 91% and assisted living reached about 88.6%.
Supply Dynamics. Memory care inventory in the 99 Primary and Secondary Markets grew by 908 units, up 0.5% year-over-year in the first quarter of 2026. Since early 2019, inventory has increased by roughly 22.0%, or about 29,950 additional units, reflecting a more measured pace of new supply growth in recent years.
Demand Dynamics. Demand has continued to outrun new supply across senior housing in general. Within memory care specifically, occupied units in the 99 Primary and Secondary Markets increased by 2.9%, 4209 units, year-over-year and by 30.1% since early 2019, equivalent to roughly 34,000additional occupied units in that period. Notably, occupied units have grown faster than inventory over that span (30.1% vs. 22.0%).
Memory Care Segment – Occupancy by Campus Type
As of the first quarter of 2026, there were approximately 5,750 properties offering memory care services within the 99 Primary and Secondary Markets. Among them, 76% were combined properties offering at least two service types, roughly 13% were freestanding (offering memory care as the sole level of care), and 11% were continuing care retirement communities (CCRCs).
Memory care remains most frequently offered within combined properties, typically anchored by assisted living with a dedicated secured wing or floor. As of the first quarter of 2026, memory care segments within CCRCs continued to report the highest occupancy at 91.2%, followed by combined (88.2%) and freestanding properties (87.9%).
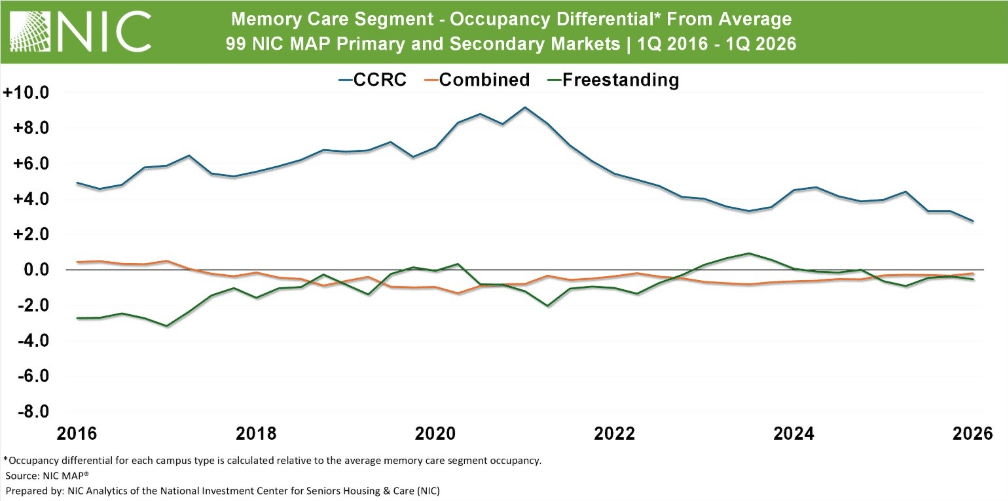
The exhibit below shows each campus type’s occupancy differential in percentage points relative to the memory care segment’s overall average occupancy since 2016.
Memory care occupancy in the CCRC campus type remains above the segment benchmark throughout, with the lead widening during periods of stress. It peaked at about 9.2 points above the segment average occupancy in the first quarter of 2021, while freestanding and combined campus types trailed by 1.2 and 0.8 points.
As of the first quarter of 2026, CCRCs led by about 2.8 points, with combined and freestanding slightly below the segment average occupancy at 0.2 and 0.5 points.
With Alzheimer’s cases projected to approach 8.5 million by 2030, the sector’s ability to meet rising demand through new development will be a key theme in the years ahead.
NIC produced a prior research piece on the Memory Care Segment in 2023. For those interested in a deeper dive into historical figures, that analysis can be accessed here.
Active Adult Occupancy Climbs to 92.6% While Supply Growth Stalls
NIC MAP in July released second quarter data for the 880 active adult rental communities they track across the U.S. Active adult communities are age-restricted, multi-family rental properties that focus on meeting lifestyle preferences, often offering amenities that emphasize wellness and community.
Key takeaways included the following:
Takeaway #1: Active Adult Occupancy Rate Increased in Second Quarter 2026
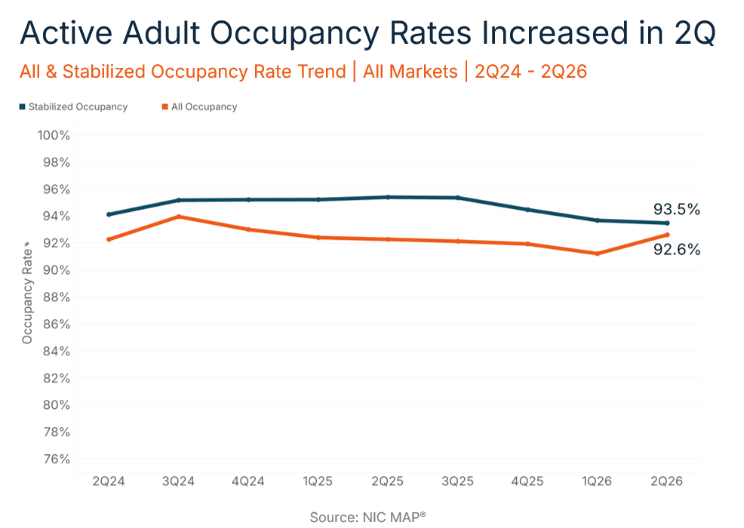
The average active adult occupancy rate climbed 1.4 percentage points in 2Q to 92.6%, 0.3 percentage points higher than a year earlier.
For stabilized properties open at least two years, occupancy rates edged down 20 basis points to 93.5%.
The higher gain in the All Occupancy rate compared to the Stabilized Occupancy rate, as shown below, may reflect an improvement in markets where there was a significant increase in new supply in recent years.
Takeaway #2: Pace of Active Adult Development Has Slowed
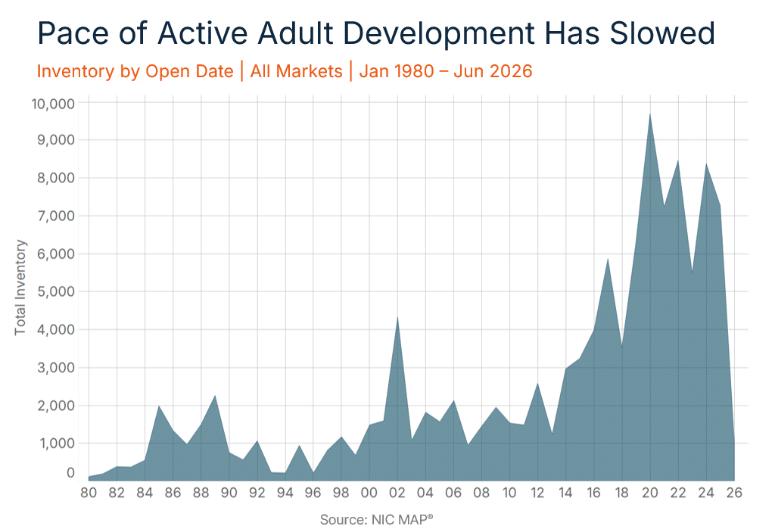
The chart below illustrates active adult rental inventory by the year these properties opened.
Active adult is still a relatively new product type, with roughly half of inventory opened in the past 10 years.
In the first half of 2026, however, NIC MAP tracked only 1,000 new units opening across 880 active adult rental communities comprised of nearly 130,000 units.
This pace is well below recent years in which openings averaged 7,000 new units per year over the 2023 through 2025 period.
Takeaway #3: Active Adult Sunbelt Markets Improved
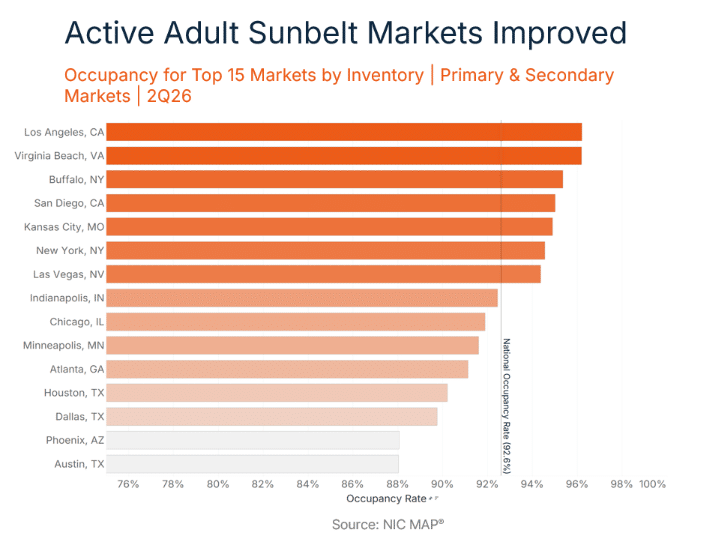
For the 15 largest active adult rental markets, the bar chart below shows All Occupancy rates, with the U.S. average of 92.6% shown in the dotted line.
The highest active adult occupancy rates in the second quarter were in Los Angeles (96.2%), Virginia Beach (96.2%), and Buffalo (95.4%).
Austin (88.0%) and Phoenix (88.1%) still had the lowest occupancy rates but increased 1.1 and 3.0 percentage points from the prior quarter, respectively.
Is a Senior Housing Professional Certification Worth the Investment?
Senior housing has become one of the fastest-growing sectors in commercial real estate. Demand is accelerating, occupancy is climbing, construction remains constrained, and capital is flowing into the sector.
That growth is creating opportunity—but it has also exposed a skills gap. Senior housing isn’t simply another real estate asset class. Success requires understanding the intersection of real estate, healthcare, operations, finance, and demographics, knowledge that most professionals were never formally taught.
Whether you’re expanding into senior housing from commercial real estate, healthcare, lending, or investment management or just want to improve your skills and credibility for your company and your career growth, the question isn’t just whether the market is attractive. It’s whether you can quickly build the expertise needed to participate confidently.
So how do you actually build the expertise to work in this space?
For many, the answer is structured education. While market data, conferences, and industry publications provide valuable insights, they rarely offer the structured, comprehensive understanding needed to evaluate opportunities and make informed decisions across the sector.
That’s where professional certification can help. Whether a senior housing certification is worth the time and investment depends on your goals—and on whether the program teaches the specialized knowledge your role requires. NIC Academy’s Certified Senior Housing Investment Professional (CSHIP) certificate program is the only industry certification designed specifically to build expertise across the senior housing and care sector. The sections below explain what the program covers, who benefits most, and how to determine whether it’s the right investment for your career.
Why Senior Housing Is Harder to Underwrite Than It Looks
Senior housing combines two businesses that most investors learn separately: real estate and operations. The real estate side follows familiar patterns of rent, occupancy, and cap rates. But the operating business underneath determines whether those patterns hold.
Occupancy does not behave like apartment occupancy. Absorption runs slower and is shaped by care needs, not just price.
Pricing depends on care level, payer mix, and local competition, not just square footage and amenities.
NOI margins move with labor costs and regulatory changes as much as with rent growth.
The current market shows how much this matters. According to the National Investment Center for Seniors Housing & Care (NIC), the parent company of NIC Academy and the most trusted resource of objective and timely industry insights and convener of leading decision-makers, senior housing occupancy reached 89.5% in the first quarter of 2026, the 19th straight quarter of growth. At the same time, new construction starts fell to their lowest level since 2012, and year-over-year inventory growth slowed to just 0.4%.
That combination, rising demand against almost no new supply, is precisely the kind of dynamic a general CRE background does not prepare someone to read. It takes sector-specific training to know what these numbers mean for underwriting and where the next opportunity is likely to show up.
Why Can’t I Just Learn This on My Own?
Information about senior housing is not hard to find. NIC publishes data every quarter. Conferences cover underwriting and operations. Trade press tracks deals in real time. The real challenge is not access. It is the organization and trusted real-world lessons from seasoned industry experts.
Self-directed learning tends to deepen knowledge only where a professional already has exposure. That leaves gaps exactly where someone has not yet been tested.
An investor who has closed a few deals may understand acquisition mechanics but miss operational risk.
A lender who has financed senior housing may understand credit structure but not why occupancy varies between similar assets in the same market.
An operator may understand resident care but not how a deal gets underwritten or financed.
There is also simply more to track than there used to be. Knowing what data exists is one skill. Knowing how to use it while underwriting a live deal is another. That second skill is what a structured program is built to teach.
Who is CSHIP Built For?
CSHIP is not an introductory overview of the industry. It is a professional credential for people working in capital markets, investment, operations, or advisory roles who need real depth in a sector where they may not have formal training.
CRE investors, brokers, and lenders expanding into senior housing
Capital markets professionals evaluating allocation decisions
Care executives and operators who want a stronger grasp of the investment side
Consultants and advisors who need a shared framework with their capital and operating partners
Professionals early in their careers who want a credential that signals real sector commitment
The program is built for working professionals. Coursework is designed to fit around existing schedules rather than compete with them.
See what’s actually in the curriculum
CSHIP Level I and Level II break down exactly what’s covered, who each level is built for, and how the coursework maps to real underwriting and deal work.
CSHIP was built by NIC Academy for professionals who need a complete view of the sector, not just one piece of it. The curriculum includes:
Senior housing market fundamentals and demographic demand drivers
Investment analysis and underwriting frameworks
Capital structures and debt financing
Operations and NOI dynamics
NIC MAP data interpretation
NIC’s affiliation with NIC MAP, the primary source of senior housing performance data runs through the whole program. Participants are not reading secondhand summaries of NIC MAP data. They are learning to work directly with the same data that the institutions deploying capital in this sector already rely on.
What Is the Actual Return on Certification?
The value is not mainly the credential line on a resume, though that helps. The bigger return is faster, better-informed decision-making once you have a complete framework for the sector, rather than a patchwork of knowledge.
Senior housing has become a real institutional asset class, and the performance backs that up. According to NIC’s reported market data, senior housing posted a 3.9% total return in the first quarter of 2026, its strongest quarterly performance since late 2017, and outperformed the broader NCREIF Property Index’s 1.2% return over the same period.
As more capital moves toward an outperforming asset class, the operators, lenders, brokers, and advisors working in it need to match that level of sophistication. Professionals who complete CSHIP typically report three concrete gains:
More confidence in holding sector-specific conversations with capital partners
A sharper eye for gaps in deal logic or underwriting assumptions
A wider professional network built on a shared analytical framework
That last point matters more than it sounds. When a lender and an operator speak the same analytical language, deals move faster and with fewer surprises.
Is Certification the Right Move for You Right Now?
The strongest candidates are professionals already working near senior housing who want to formalize their expertise, people transitioning from another CRE sector or healthcare, and anyone who has already identified a specific gap in their knowledge. A few honest questions help clarify these issues:
What decisions do I make regularly that would benefit from stronger sector knowledge?
Which parts of senior housing do I currently rely on someone else to explain to me?
Would a structured program get me there faster than continuing to learn on the job?
If you can answer those with specifics, certification will likely pay off faster than continuing to piece things together informally.
Why the Timing Matters Right Now
The oldest Baby Boomers turn 80 in 2026. According to PwC and the Urban Land Institute, the population age 75 and older is expected to grow by more than 4 million by 2030, and the number of adults 75 and older living alone is projected to more than double by 2040. That kind of demand will need capital, operators, and advisors who understand the sector with real precision.
NIC research indicates senior housing occupancy is on track to surpass 90% before the end of 2026, which would mark the highest level recorded since NIC MAP began tracking the data. Construction starts remain at some of their lowest levels in over a decade. Capital is entering the sector at a moment when fundamentals are strong, and supply is unlikely to catch up soon. Professionals who build real expertise now are entering at the right point in the cycle.
CSHIP gives professionals a direct path to that expertise. The frameworks taught in the program are not borrowed from another asset class. They are the ones the industry itself uses.
Ready to take the next step?
If the case for structured expertise in this article matches how you’re already thinking about your role in senior housing, the next step is simple: look at the program details and enroll when you’re ready.
We use cookies on our website to give you the most relevant experience by remembering your preferences and repeat visits. NIC's privacy policy can be viewed here. By clicking “Accept”, you consent to the use of ALL the cookies.
This website uses cookies to improve your experience while you navigate through the website. Out of these cookies, the cookies that are categorized as necessary are stored on your browser as they are essential for the working of basic functionalities of the website. We also use third-party cookies that help us analyze and understand how you use this website. These cookies will be stored in your browser only with your consent. You also have the option to opt-out of these cookies. But opting out of some of these cookies may have an effect on your browsing experience.
Necessary cookies are absolutely essential for the website to function properly. This category only includes cookies that ensures basic functionalities and security features of the website. These cookies do not store any personal information.
Functional cookies help to perform certain functionalities like sharing the content of the website on social media platforms, collect feedbacks, and other third-party features.
Performance cookies are used to understand and analyze the key performance indexes of the website which helps in delivering a better user experience for the visitors.
Analytical cookies are used to understand how visitors interact with the website. These cookies help provide information on metrics the number of visitors, bounce rate, traffic source, etc.
Advertisement cookies are used to provide visitors with relevant ads and marketing campaigns. These cookies track visitors across websites and collect information to provide customized ads.