NIC MAP® Data Service clients attended a webinar in mid-April on the key seniors housing data trends during the first quarter of 2019. Key takeaways included the following:
Takeaway #1: Seniors Housing Occupancy Was Largely Unchanged, but Remained Soft in Q1 2019
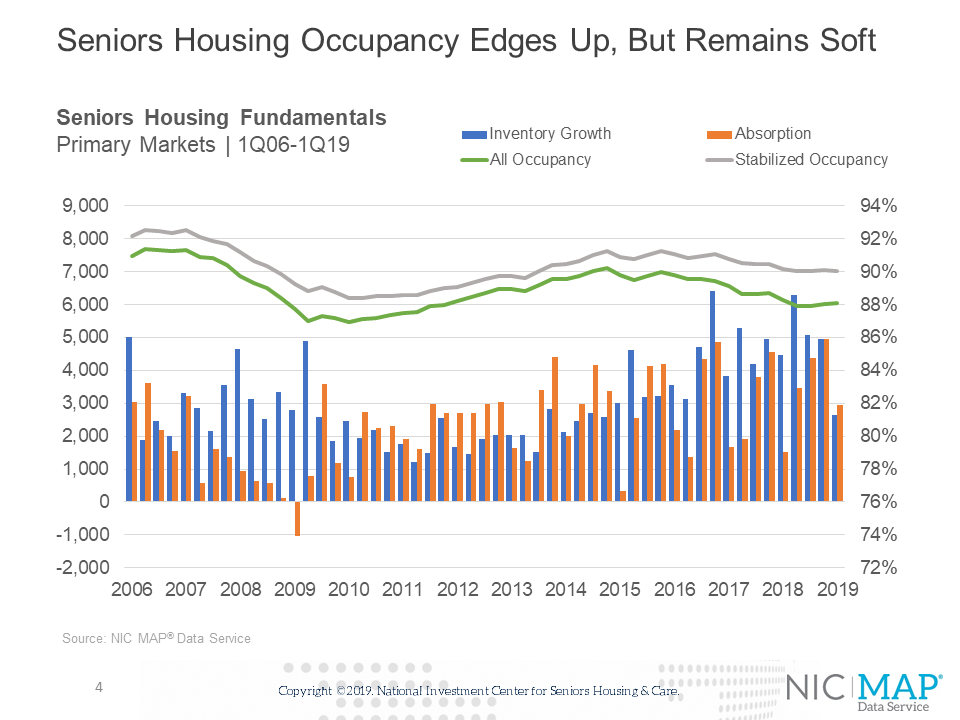
- Based on the quarterly patterns of inventory and absorption, the all occupancy rate for seniors housing, which includes properties still in lease up, inched up to 88.1% in the first quarter, up 20 basis points from the seven-year low of 87.9% in the second and third quarters of last year and up 10 basis points from the fourth quarter. It remained below year-earlier levels by 20 basis points, however.
- This placed occupancy 1.2 percentage points above its cyclical low of 86.9% reached during the first quarter of 2010 and 2.1 percentage point below its most recent high of 90.2% in the fourth quarter of 2014.
- It is notable that this was the second consecutive quarter where net absorption exceeded inventory growth (albeit by a small amount in the fourth quarter). This has not happened since late 2015. Keep in mind that some of this is a timing issue, since new inventory is not instantly taken up and the leasing process is not instantaneous.
Takeaway #2: Memory Care Occupancy Up from Record Low
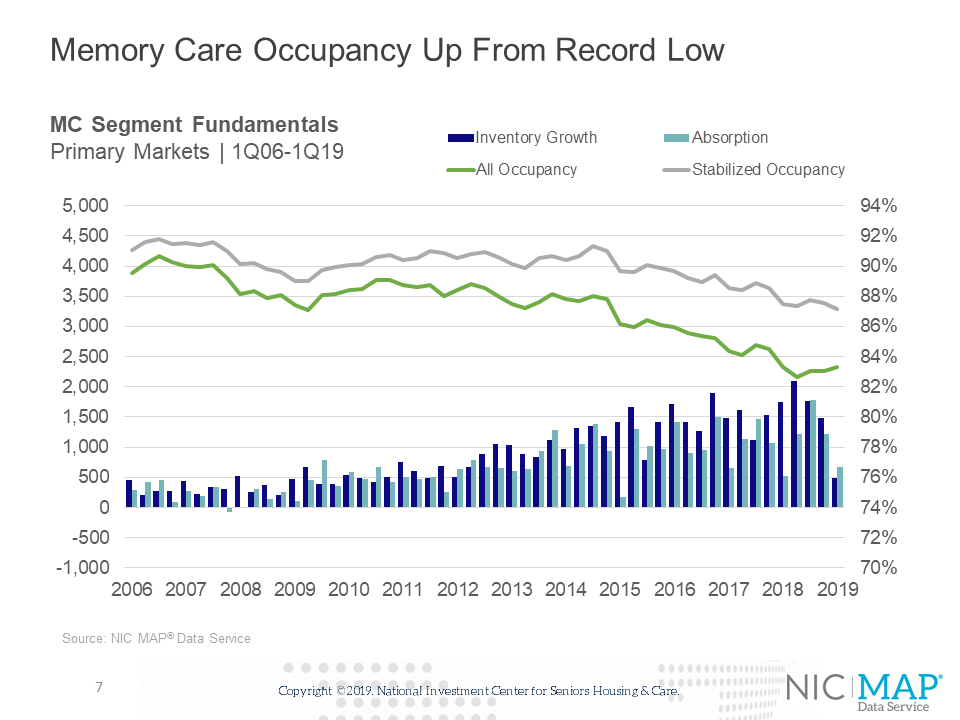
- The slide below shows the supply and demand fundamentals for the memory care segment. This is a different categorization than the prior slide which showed majority property type. Segment includes all memory care units that NIC tracks regardless of the property type in which they are situated. For the 31 NIC MAP Primary Markets, there are a total of 87,035 units of memory care located in free-standing, stand-alone campuses or as part of a continuum of care in an assisted living, independent living or CCRC property. Roughly one third of all memory care units are in free-standing properties.
- The occupancy rate was 83.3% in the first quarter, up from an all-time low of 82.7% in the second quarter, but still low. Since its most recent peak occupancy rate of 88.1% in late 2013, there have been nearly 30,000 memory care units added, 35% more than the market has been able to absorb on a net basis. Note the gap between stabilized and total occupancy is 380 basis points highlighting the large number of units that have been added to inventory, but not yet leased.
Takeaway #3 Assisted Living Construction Starts Trending Lower
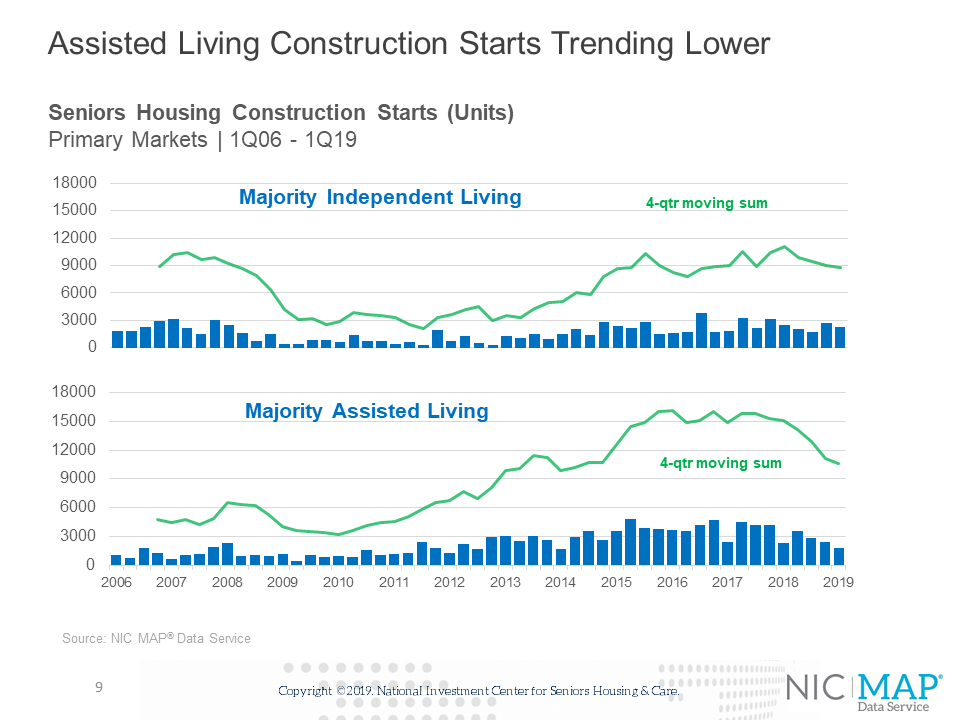
- Another key takeaway is the slowdown in the four-quarter moving sum of starts for majority assisted living. Indeed, in the first quarter, assisted living starts totaled 1,767 units, the fewest starts since the first quarter of 2014. On a four-quarter aggregate basis, starts totaled 10,603 units, the fewest since 2014. As a share of inventory, this amounted to 3.7%, marking the second consecutive quarter that it was below 4%. Other than last quarter, the last time it was below 4% was 2012.
- While this may look encouraging to those concerned about the construction cycle we are currently in, it is important to note that due to the nature of this data, it is often revised either up or down.
- For independent living, the pattern is not as clear. Starts on a rolling four-quarter basis, totaled 8,764 units in the first quarter. As a share of inventory, this equaled 2.6%.
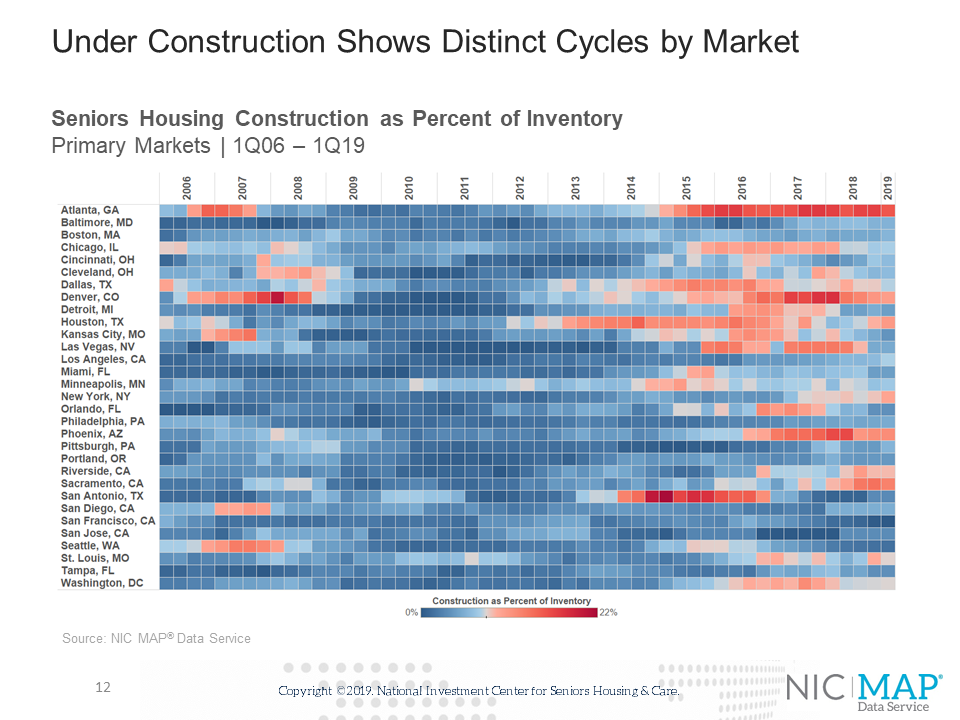
Key Takeaway #4: Under Construction Shows Distinct Cycles By Market
- This chart shows a heat map of seniors housing construction as a share of inventory for each of the 31 Primary markets. The scale ranges from 0% — the darkest blue shades—to 22%–the deepest reds. The chart shows distinct development cycles among the Primary markets.
- In looking at the far right of the slide for the Q1 2019 period, the five markets with the highest shares of inventory under construction are: Atlanta, Sacramento, Houston, Denver and Phoenix while San Francisco and Seattle are the least active as identified by the darker blue shades.
- For a deeper dive into one market, Atlanta had 15.1% of its stock under construction as of the first quarter of 2019, the most of any one of the 31 Primary markets, but down from a peak of 17.3% in the third quarter of 2017. This equated to 3,125 units, also the most of any market apart from Chicago (3,139) and NY (3,937), two markets with twice the size of inventory, however. As an aside, with 3,937 units, NY’s construction vs. inventory ratio is 9.7%, the highest ever.
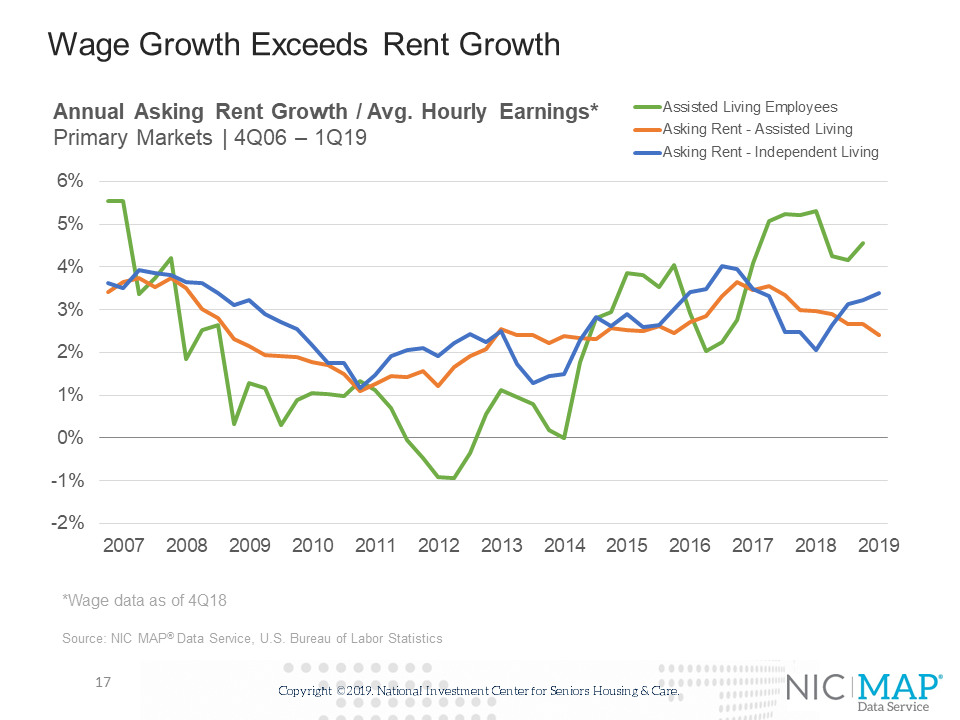
Takeaway #5: Wage Growth Exceeds Rent Growth
- Same-store asking rent growth for seniors housing was unchanged in the first quarter, with year-over-year growth of 3.0%. Asking rent growth for assisted living (orange line) was 2.4% for the first quarter, the lowest rate growth since late 2015. For independent living (blue line), rent growth accelerated back to 3.4% from 3.2% in the fourth quarter.
- This quarter, we’ve compared asking rent growth to the changes in average hourly earnings for assisted living workers, figures that are tracked and monitored by the U.S. Bureau of Labor Statistics. Average hourly earnings were up 4.6% for assisted living employees as of Q4 2018 (most recent data available), almost twice that of asking rent growth. Together, these lines show the pressure operators may be having as expense growth has been pressured higher, while rent growth has been easing. For many operators, labor expenses amount to 60% of their expenses.
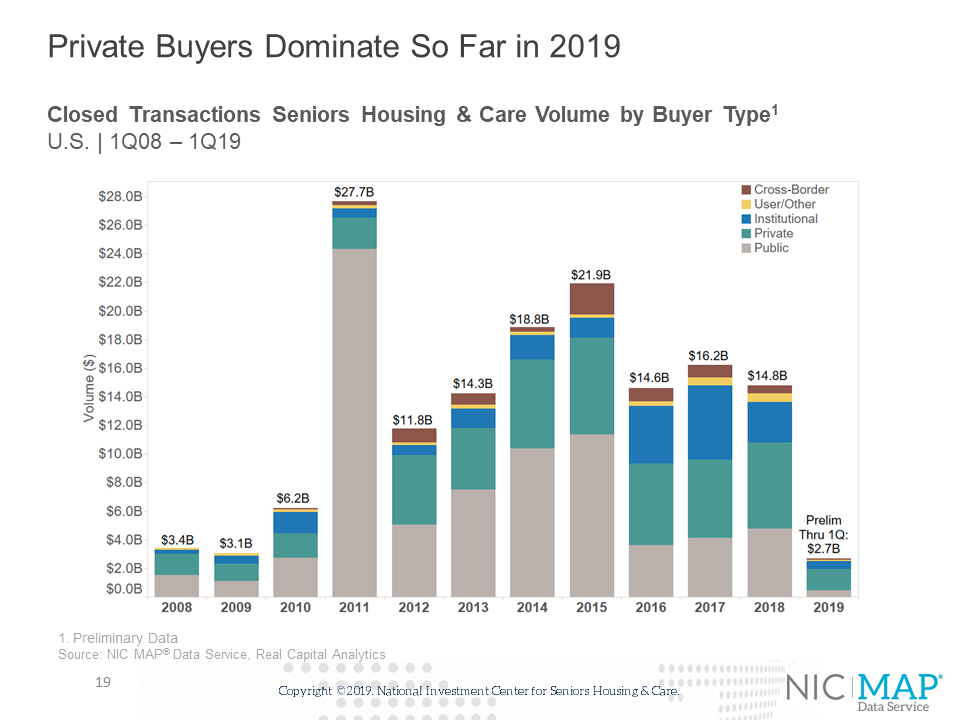
Key Takeaway #6: Seniors Housing and Nursing Care Transaction Dollar Volume Down in 1Q 2019
- Preliminary data shows that seniors housing and care transactions volume registered $2.7 billion in the first quarter of 2019. This includes $1.4 billion in seniors housing and $1.3 billion in nursing care transactions. The total volume was down 26.5% from the previous quarter’s $3.6 billion and down 27% from the 1st quarter of 2018 when volume came in at $3.7 billion
- The rolling four-quarter total seniors housing and care volume was down close to 7% from the prior quarter to $13.8 billion.
- The first quarter of 2019 marks the 22nd consecutive quarter of 100 or more deals closing.
- Smaller deals of $50 million or less dominated the quarter as they represented 91% of the total.
- Private buyers made up the majority of dollar volume. Over the past 23 quarters, the private buyer has closed on over $1.0 billion in transactions in every quarter except one which was in the second quarter of 2018. The private buyer represented 55% of all the $2.7 billion in volume closed in the first quarter. However, its volume was down 24% from the fourth quarter of 2018 and down 7% from a year ago in the first quarter of 2018 when volume registered $1.6 billion.