The following analysis examines occupancy and year-over-year changes in inventory, and same-store asking rent growth—by care segment—within entrance fee CCRCs and rental CCRCs in the 99 combined NIC MAP Primary and Secondary Markets. The analysis also explores the recovery of regional occupancy rates by majority contract type (entrance fee CCRCs vs. rental CCRCs) and compares the distribution of occupancy among different community types and by contract type during the fourth quarter of 2023.
Key takeaways
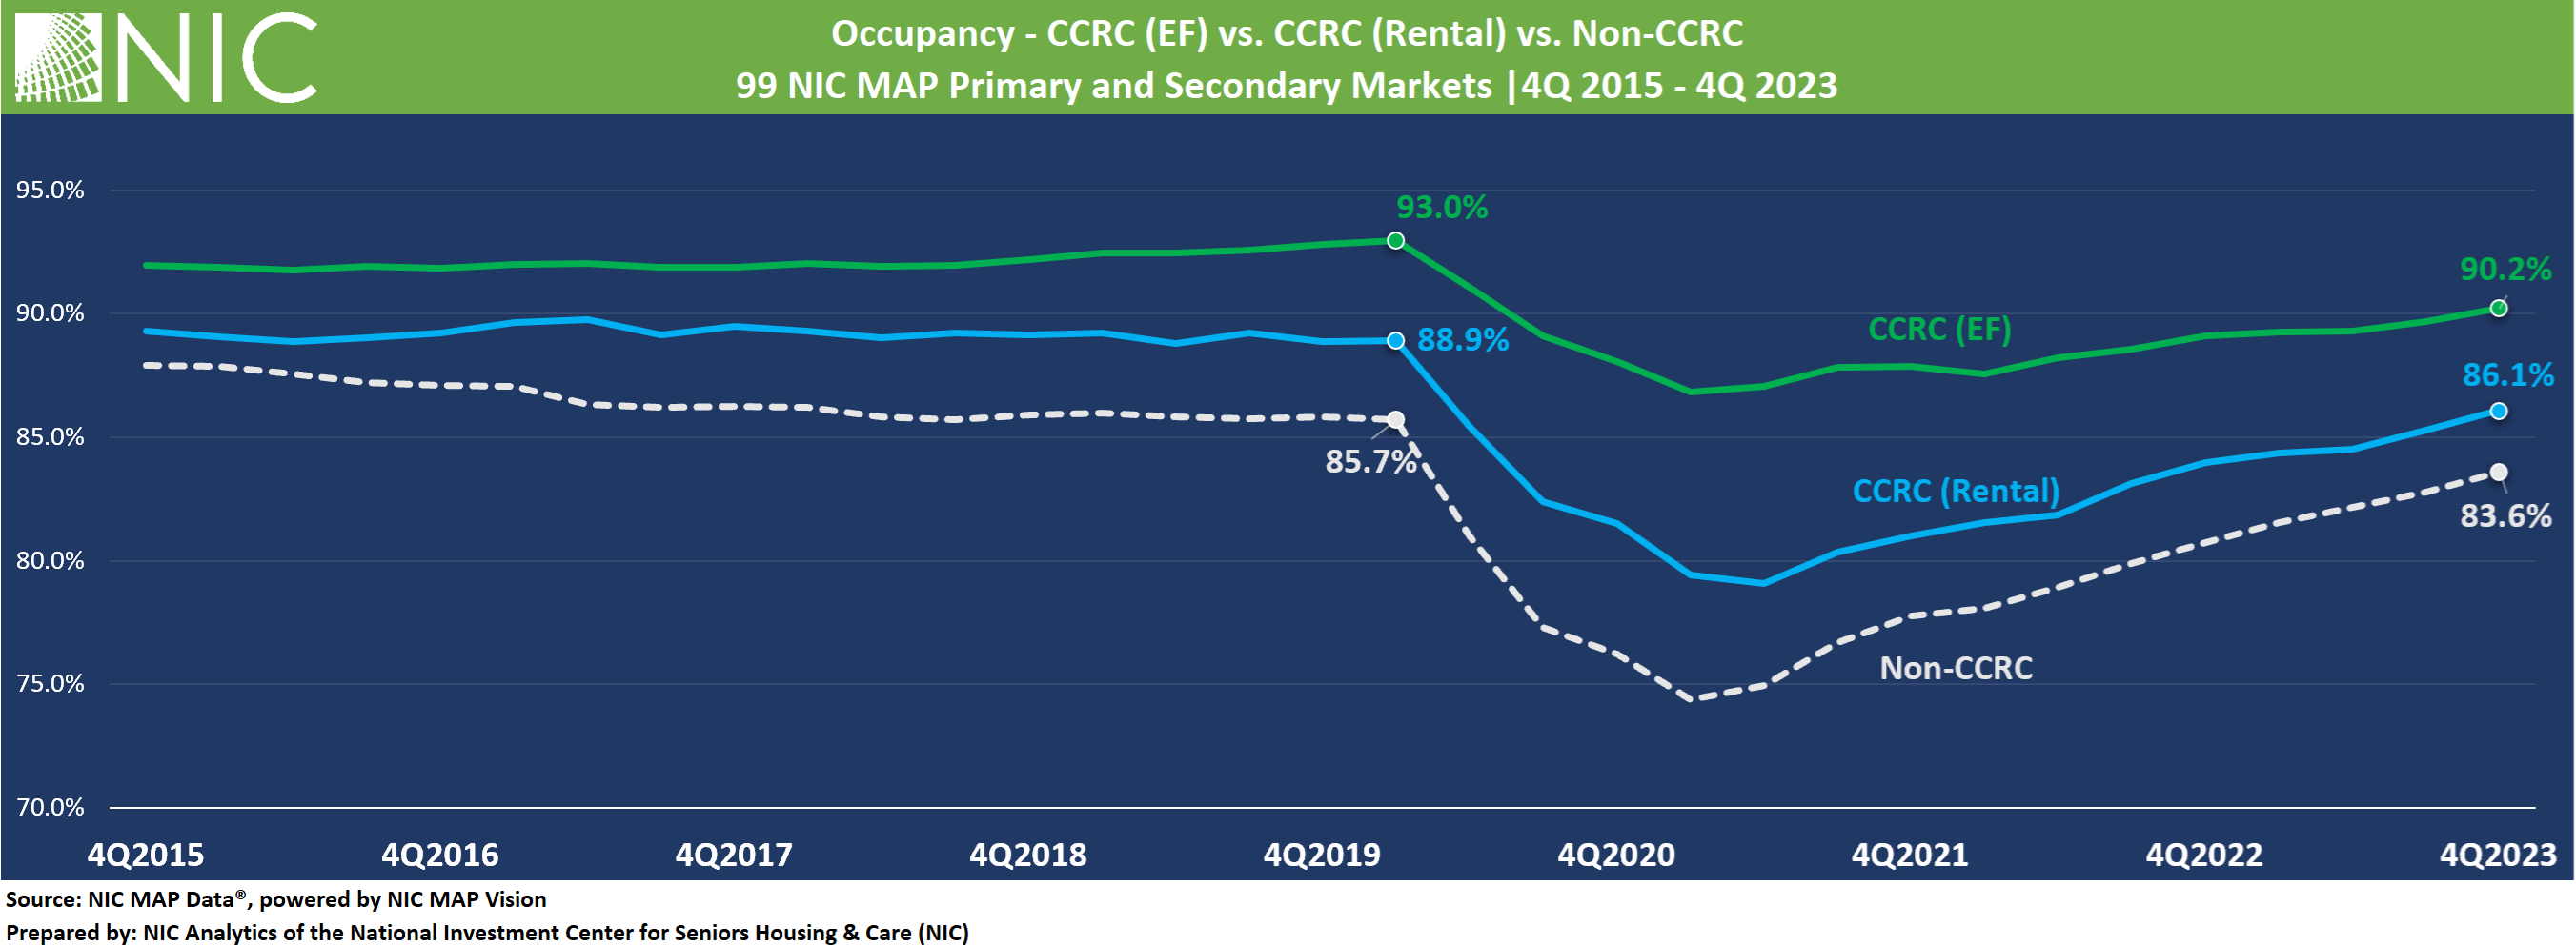
- The occupancy rate for entrance fee CCRCs surpassed 90% in the fourth quarter 2023.
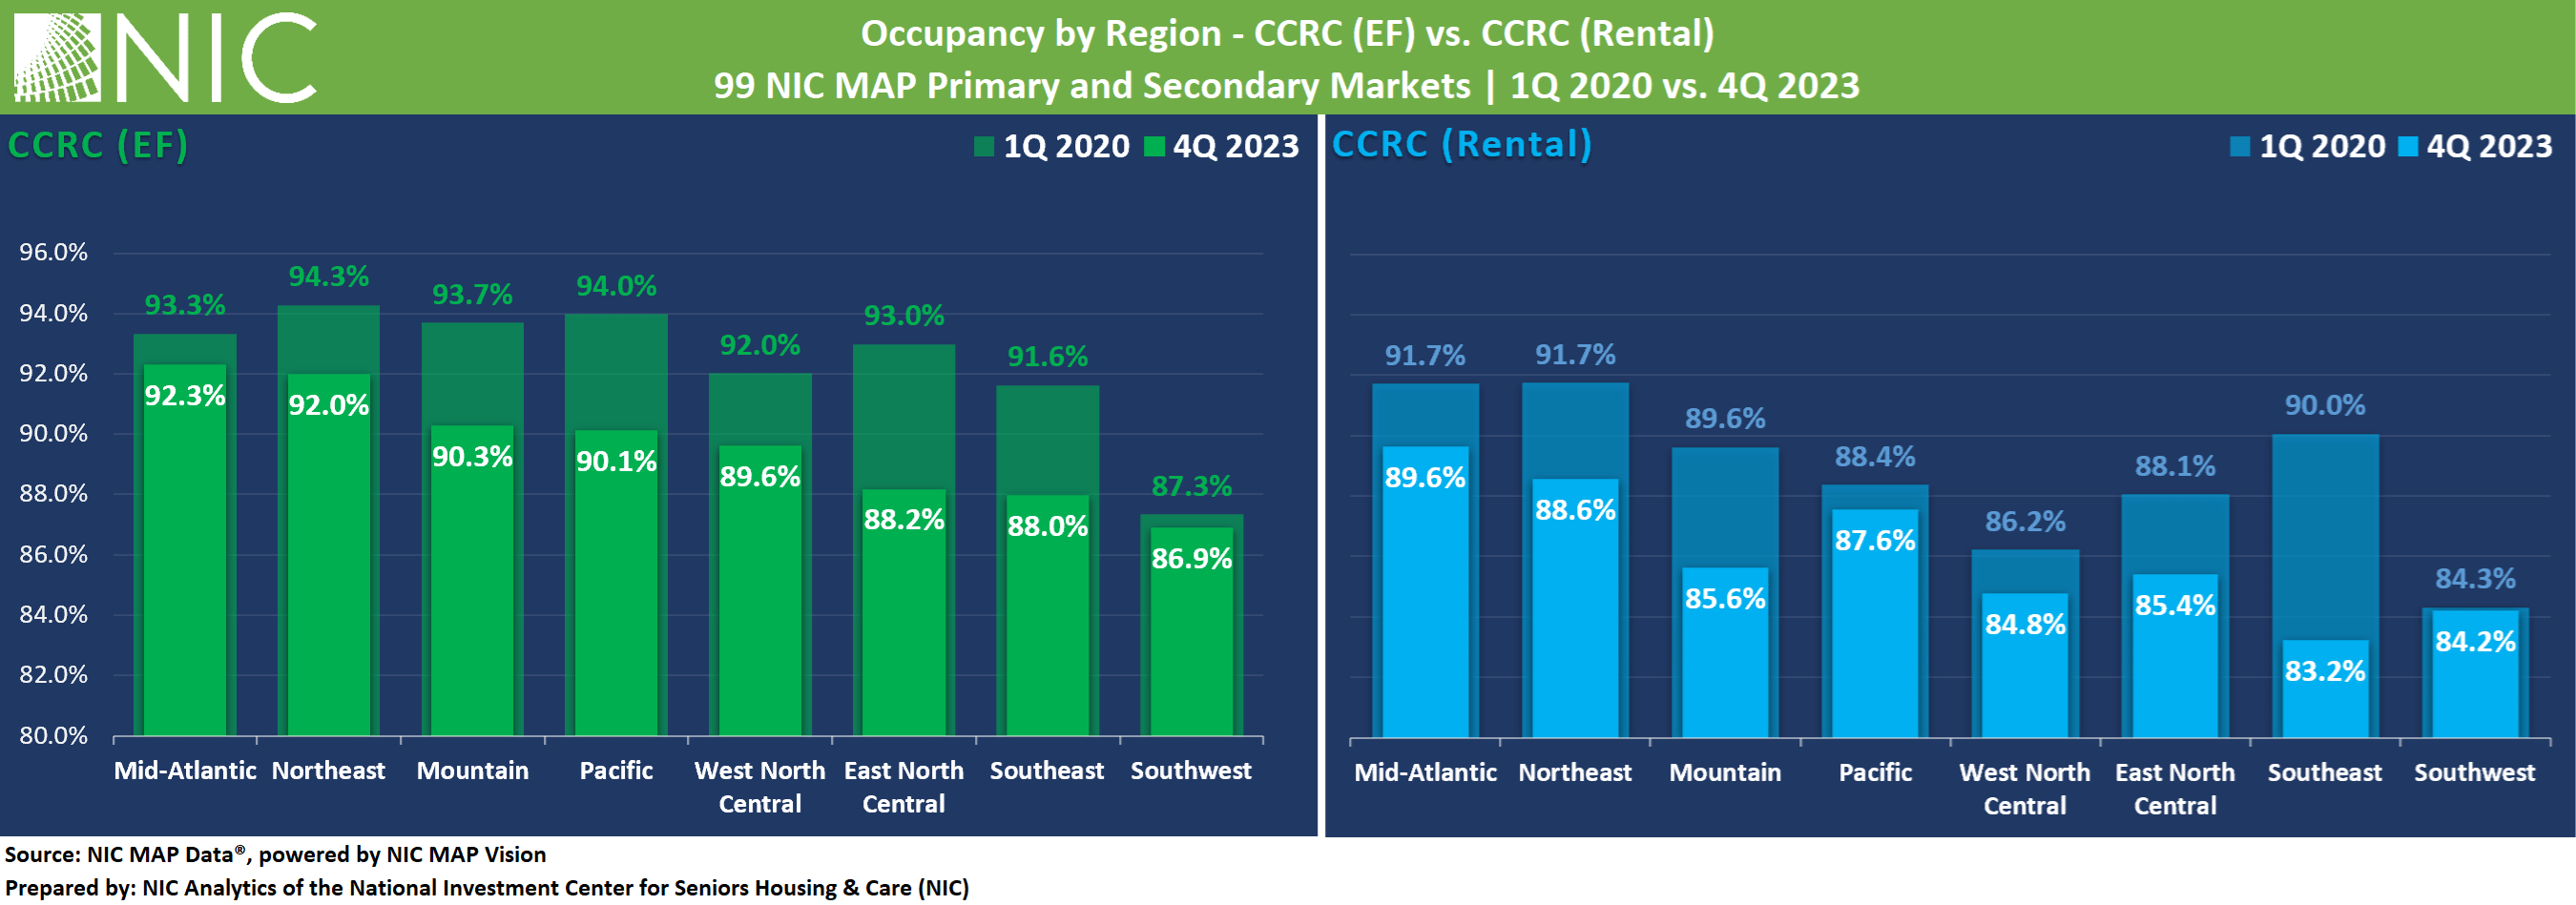
- Entrance fee CCRCs maintained higher occupancy rates than rental CCRCs across all regions and care segments.
- Occupancy rates and recovery timelines continue to be uneven across regions. In future publications, NIC Analytics will explore these regional differences to understand the underlying drivers.
- The memory care segment within rental CCRCs experienced the smallest asking rate growth but the largest annual occupancy gain.
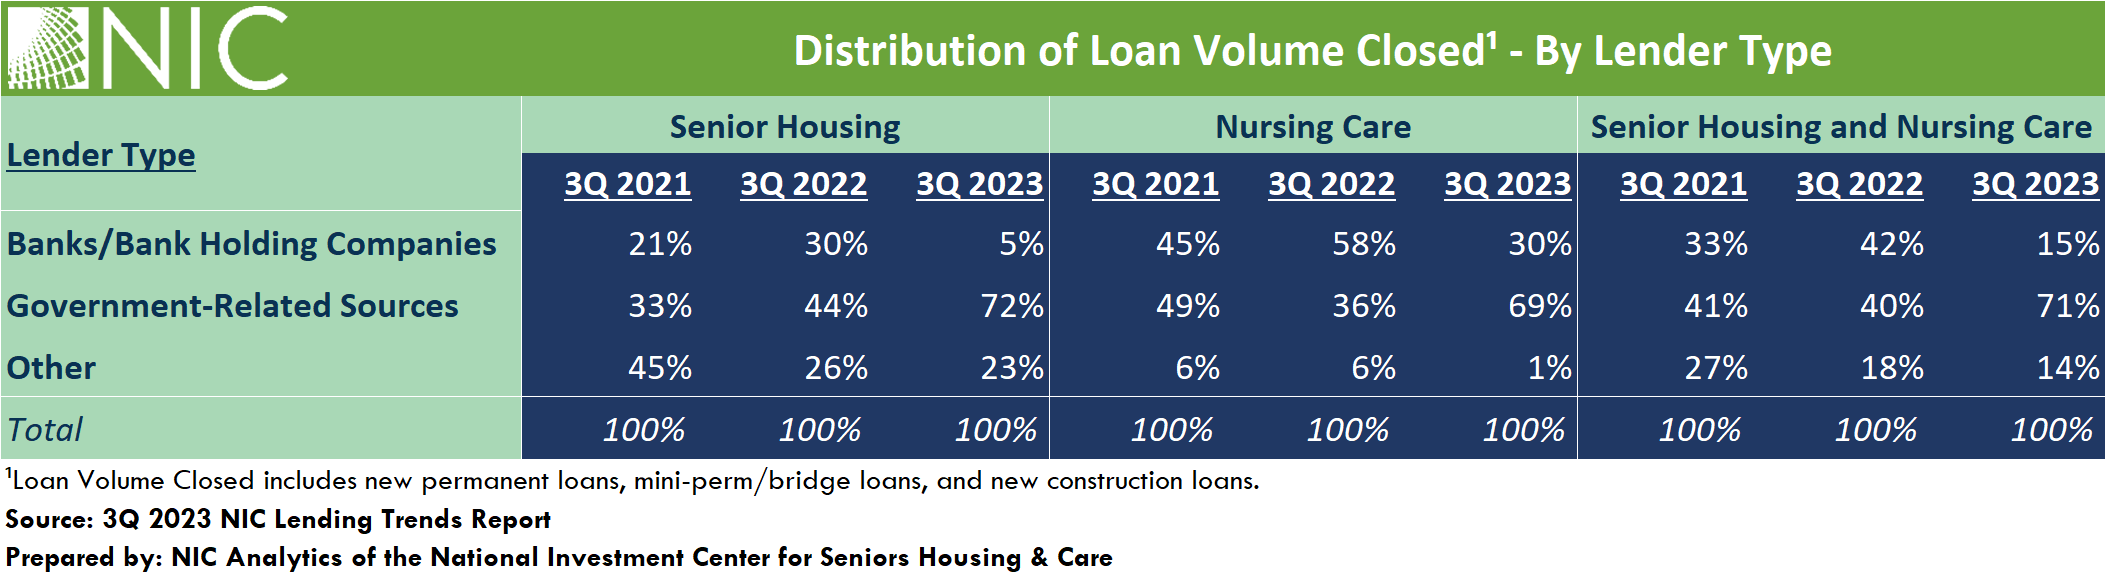
- Nursing care Inventory within CCRCs is shrinking at a higher pace. There is a trend of CCRCs converting skilled nursing beds to assisted living or memory care units.
The Occupancy Rate for Entrance Fee CCRCs Surpassed 90% in the Fourth Quarter 2023. In the 99 NIC MAP Primary and Secondary markets, the occupancy rate for entrance fee CCRCs increased to 90.2%, 4.1 percentage points (pps) higher than rental CCRCs (86.1%) and 6.6pps higher than non-CCRCs (83.6%).
NIC Analytics recently published its first occupancy stratification report, which examines the distribution of stabilized occupancy within the senior housing sector in 2023. The report shows that CCRCs had the smallest share of communities with occupancy below 80% compared to other community types. Additionally, only about 10% of entrance fee CCRCs reported occupancy below 80%, less than half the share found in rental CCRCs and the smallest share across NIC MAP Vision dimensions comparisons.
Across all Regions, Entrance Fee CCRCs Maintained Higher Occupancy Rates than Rental CCRCs in the Fourth Quarter 2023. The largest differences in occupancy between entrance fee and rental were reported for the West North Central and Southeast Regions, where entrance fee CCRC occupancy was 4.8pps higher than rental, followed by the Mountain (4.7pps), and the Northeast (3.4pps).
Strong Occupancy Rates in Mid-Atlantic and Northeast. The Mid-Atlantic and Northeast Regions had the strongest occupancy rates for both entrance fee and rental CCRCs in the fourth quarter 2023. The occupancy rates within these regions with respect to contract type were well above the average occupancy rate for entrance fee CCRCs (90.2%) and rental CCRCs (86.1%) in the combined 99 NIC MAP Primary and Secondary Markets.
Mid-Atlantic and Southwest Regions Closest to Recovery. For entrance fee CCRCs, the Southwest and Mid-Atlantic Regions are the closest to fully recovering and returning to the occupancy levels of the first quarter 2020. The Southwest Region has reached 86.9% occupancy, while the Mid-Atlantic Regions is at 92.3%. Both regions are within 0.4pps and 1.0pps, respectively, of reaching pre-pandemic first quarter 2020 levels. As for rental CCRCs, the Southwest Region (84.3%) has fully recovered and returned to the occupancy level of the first quarter 2020.
In future publications, NIC Analytics will explore these regional differences to understand the drivers behind higher occupancy rates or faster recovery in some regions, and relatively lower occupancy rates or slower recovery in others.
4Q 2023 Market Fundamentals by Care Segment – Entrance Fee CCRCs vs. Rental CCRCs
Occupancy. Overall, the occupancy rate for entrance fee CCRCs continued to outpace that of rental CCRCs across all care segments. The difference in the fourth quarter 2023 occupancy rates between entrance fee CCRCs and rental CCRCs was largest for the independent living segment (3.8pps) and the assisted living segment (3.4pps), and smallest for the nursing care segment (1.0pps).
The entrance fee CCRC independent living care segment had the highest occupancy (91.9%) in the fourth quarter of 2023, followed by entrance fee CCRC assisted living and memory care segments (89.7% and 88.5%, respectively).
In terms of occupancy improvements from one year ago, the largest occupancy gains for both entrance fee CCRCs and rental CCRCs were seen across assisted living and memory care segments, while the smallest gains were seen across independent living segments (1.0pps and 1.1pps, respectively).
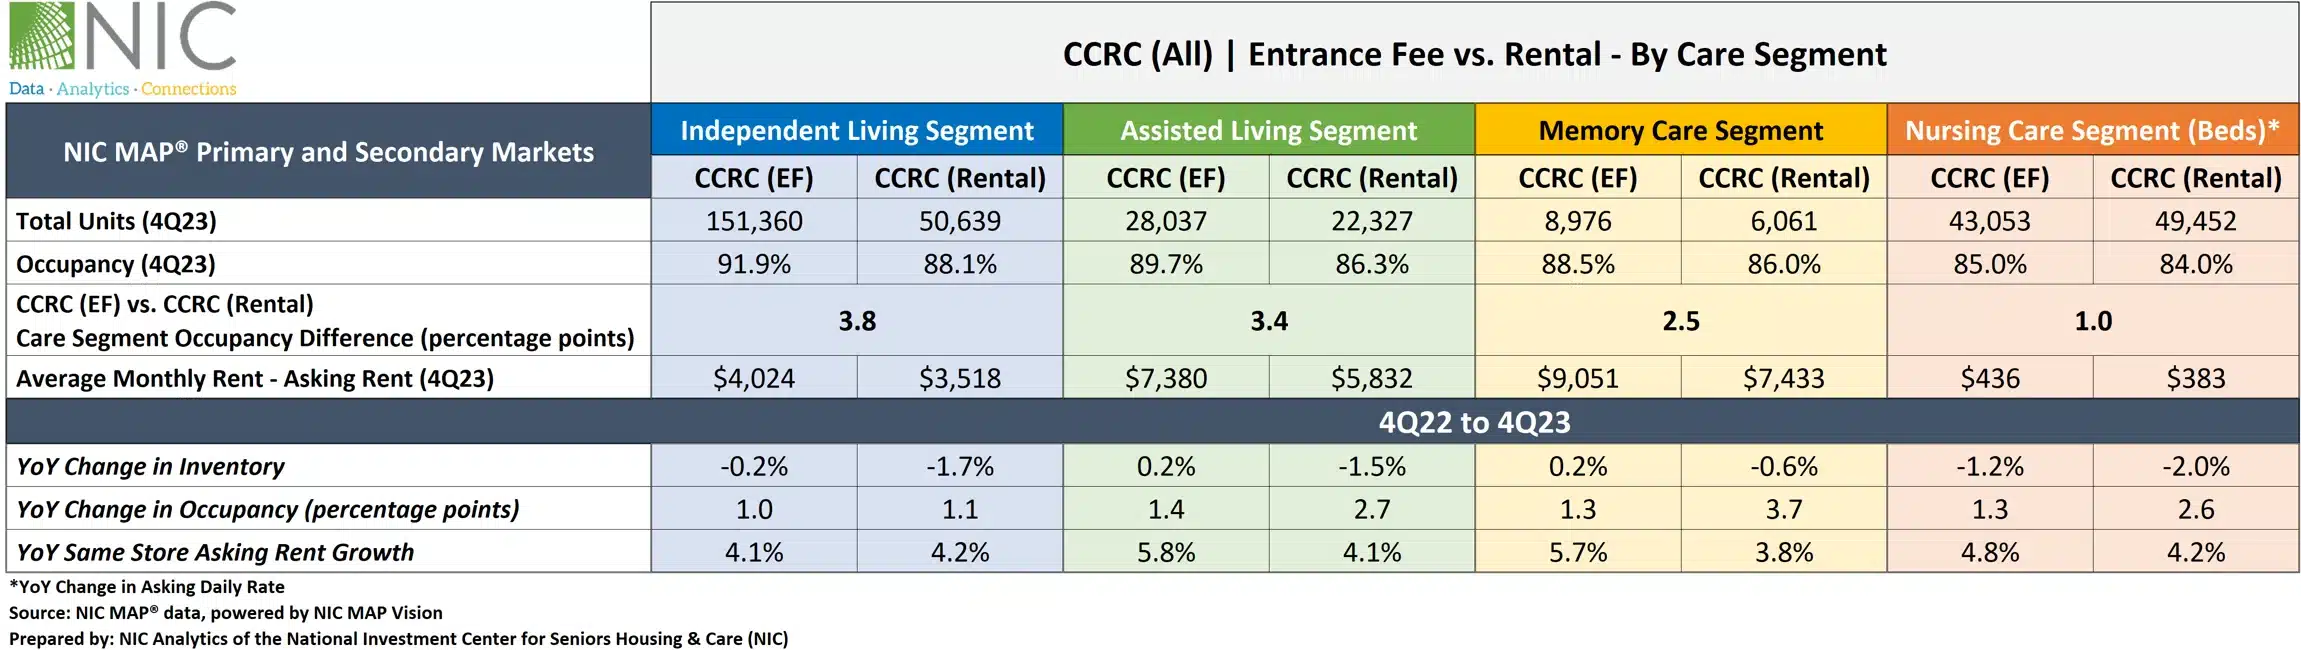
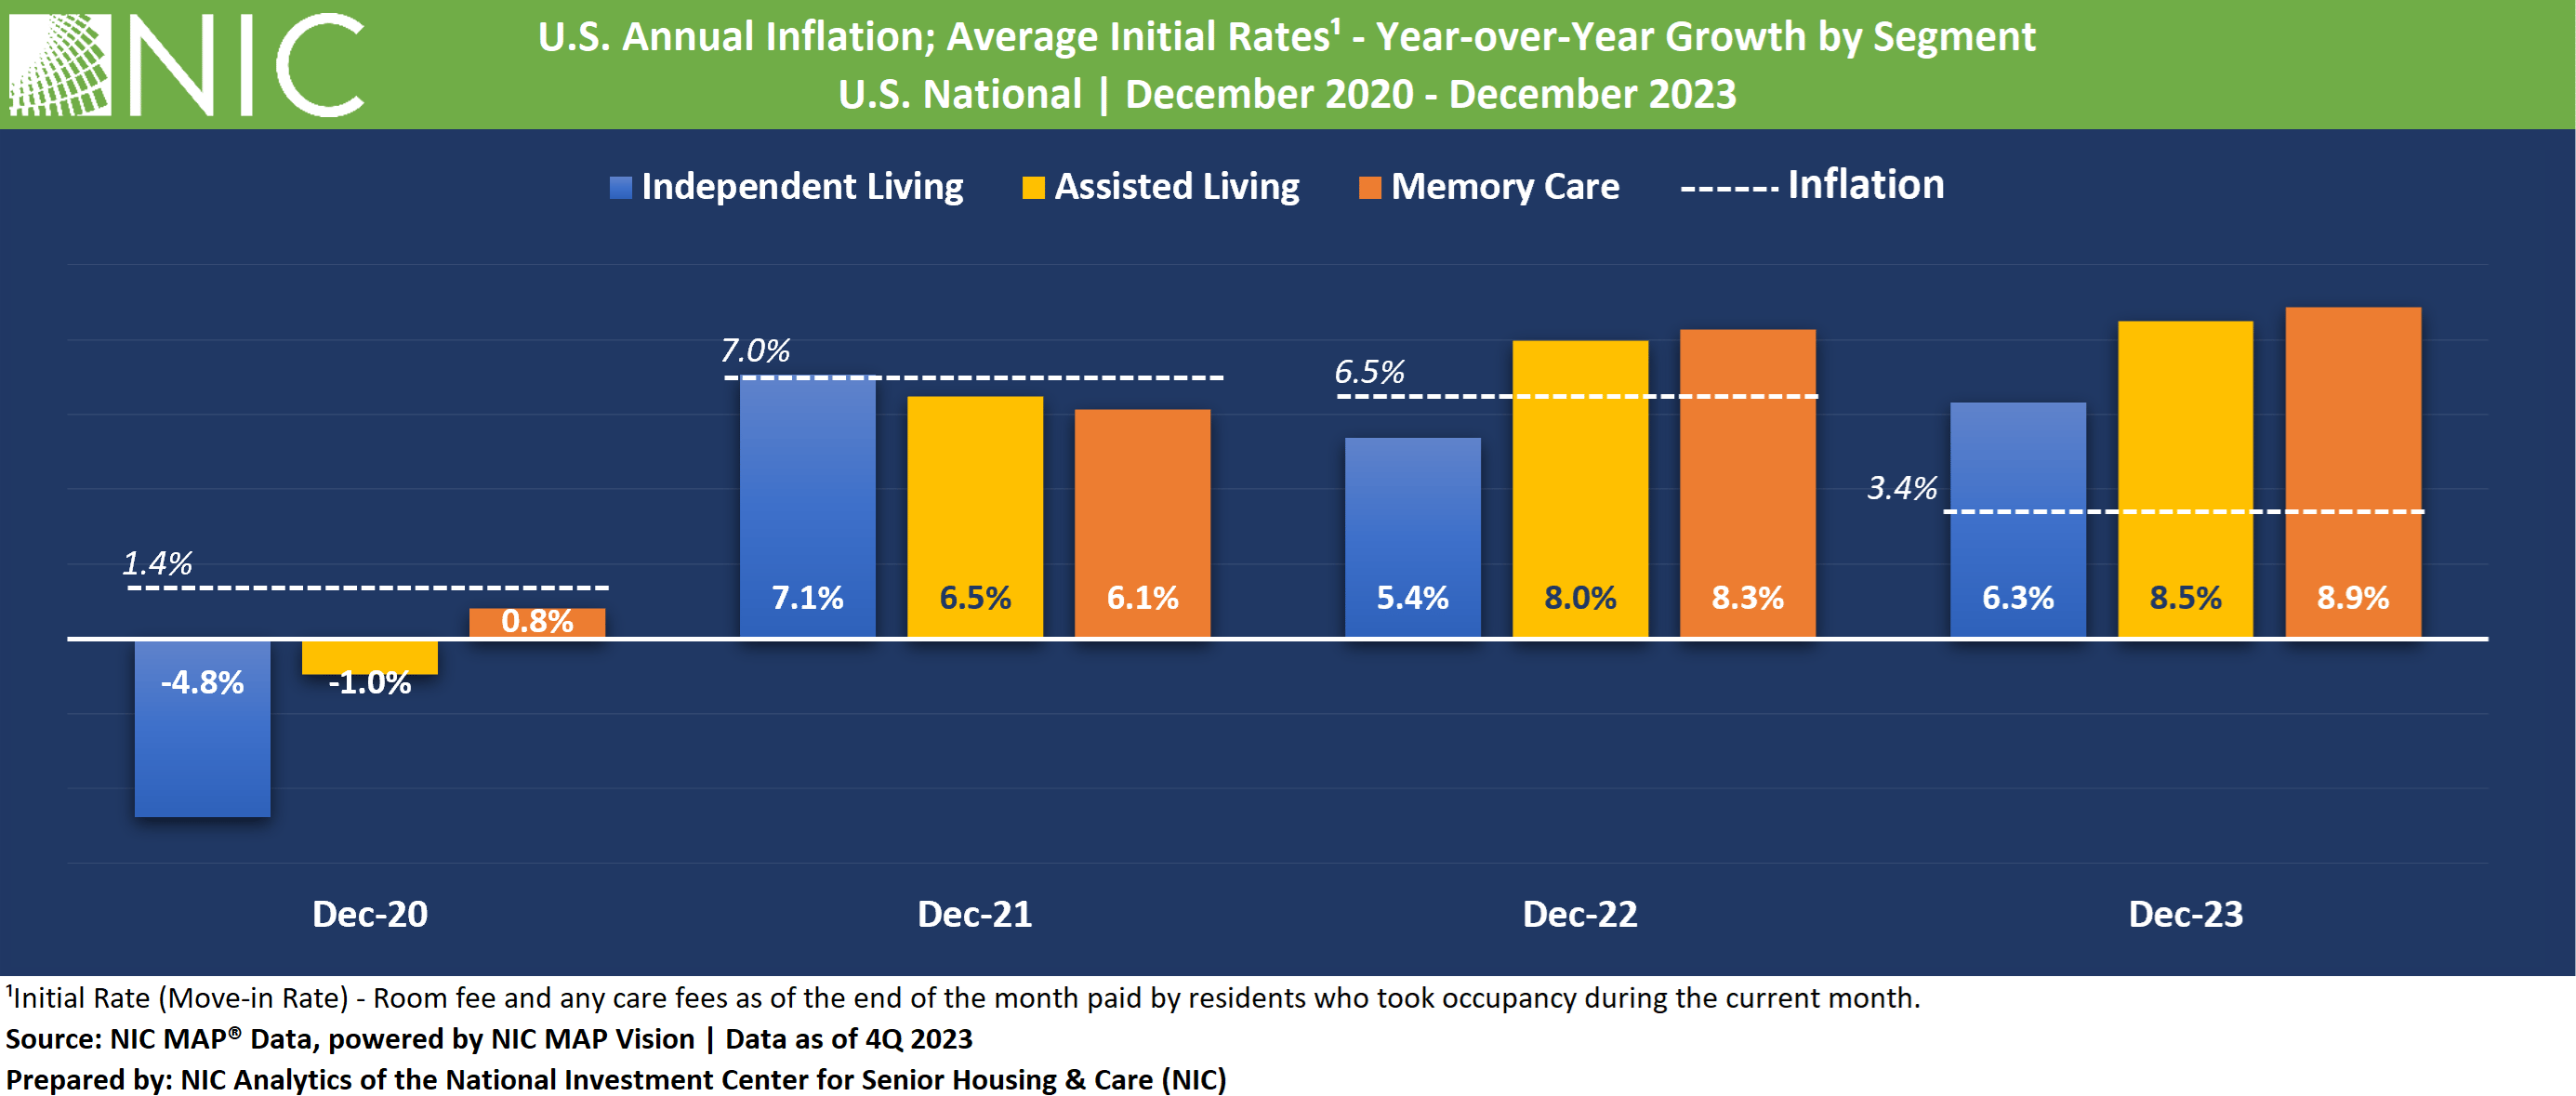
Asking Rent. The monthly average asking rent for entrance fee CCRCs across all care segments remained higher than rental CCRCs. The highest year-over-year asking rent growth for entrance fee CCRCs was noted in the assisted living and memory care segments (5.8% to $7,380 and 5.7% to $9,051, respectively). For rental CCRCs, the largest year-over-year asking rent growth was noted in the independent living segment (4.2% to $3,518), while the smallest growth was seen in the memory care segment (3.8% to 7,433). Interestingly, the memory care segment experienced the largest annual occupancy gain (3.7pps) across all care segments and payment types.
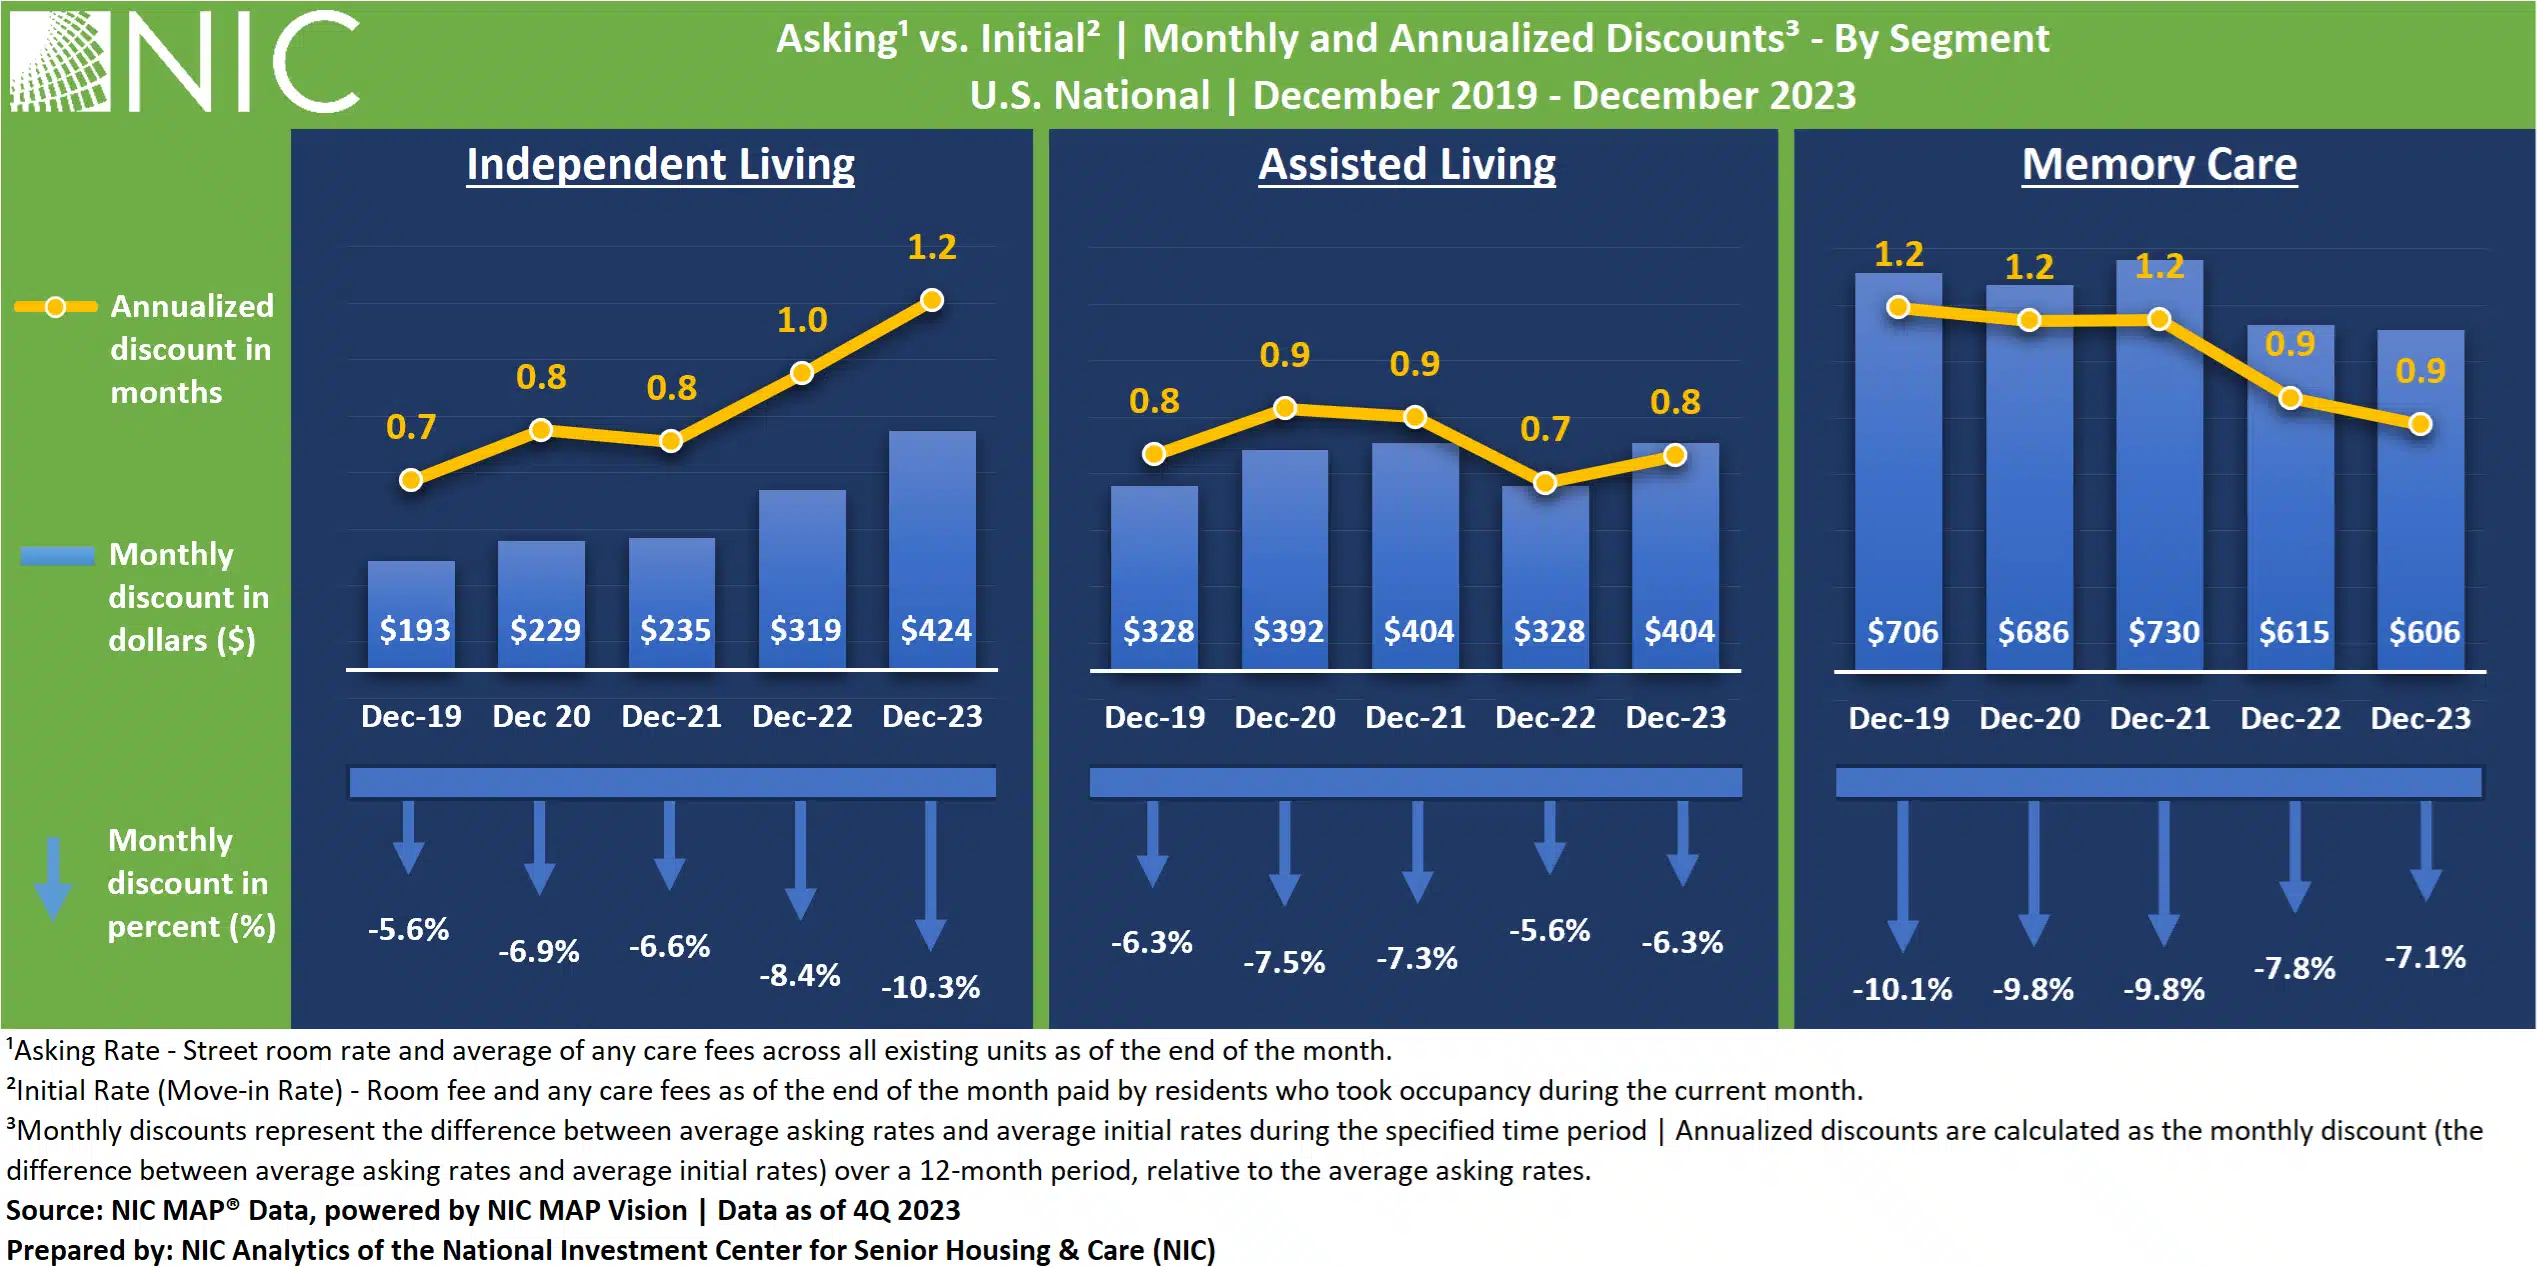
Note, these figures are for asking rates and do not consider any discounting that may be occurring.
Inventory. Compared to year-earlier levels, nursing care inventory for both entrance fee and rental CCRCs continued to experience the largest declines (negative 1.2% and 2.0%, respectively). On the other hand, positive year-over-year inventory growth was reported for the entrance fee CCRC assisted living segments (0.2%) and memory care segments (0.2%).
Negative inventory growth can occur when units/beds are temporarily or permanently taken offline or converted to another care segment, outweighing added inventory. Anecdotally, there is a trend of CCRCs converting skilled nursing beds to assisted living or memory care units.
Look for future blog posts from NIC to delve deep into the performance of CCRCs.
Interested in learning more?
To learn more about NIC MAP Vision data, and about accessing the data featured in this article, schedule a meeting with a product expert today.
This article originally appeared in Ziegler’s Senior Living Finance Z-News.