As the seniors housing and care industry’s leading data provider, NIC tracks occupancy, asking rents, demand, supply and construction data for independent living, assisted living, memory care, skilled nursing and continuing care retirement communities (CCRCs)/life plan communities (LPCs). The following narrative describes CCRC/LPC occupancy and supply and demand trends in the combined primary and secondary markets, which represent the aggregate of the data collected from 99 of the largest core-based statistical areas (CBSAs).
Supply & Demand Fundamentals
CCRC/LPC occupancy was flat in 2017
A review of the current fourth quarter 2017 data for the combined primary and secondary metropolitan markets tracked by NIC MAP® shows that CCRC/LPC occupancy was flat in 2017, fluctuating only as much as 20 basis points during the four quarters. Current all occupancy is 91.1% and stabilized occupancy is 10 basis points higher (91.2%).
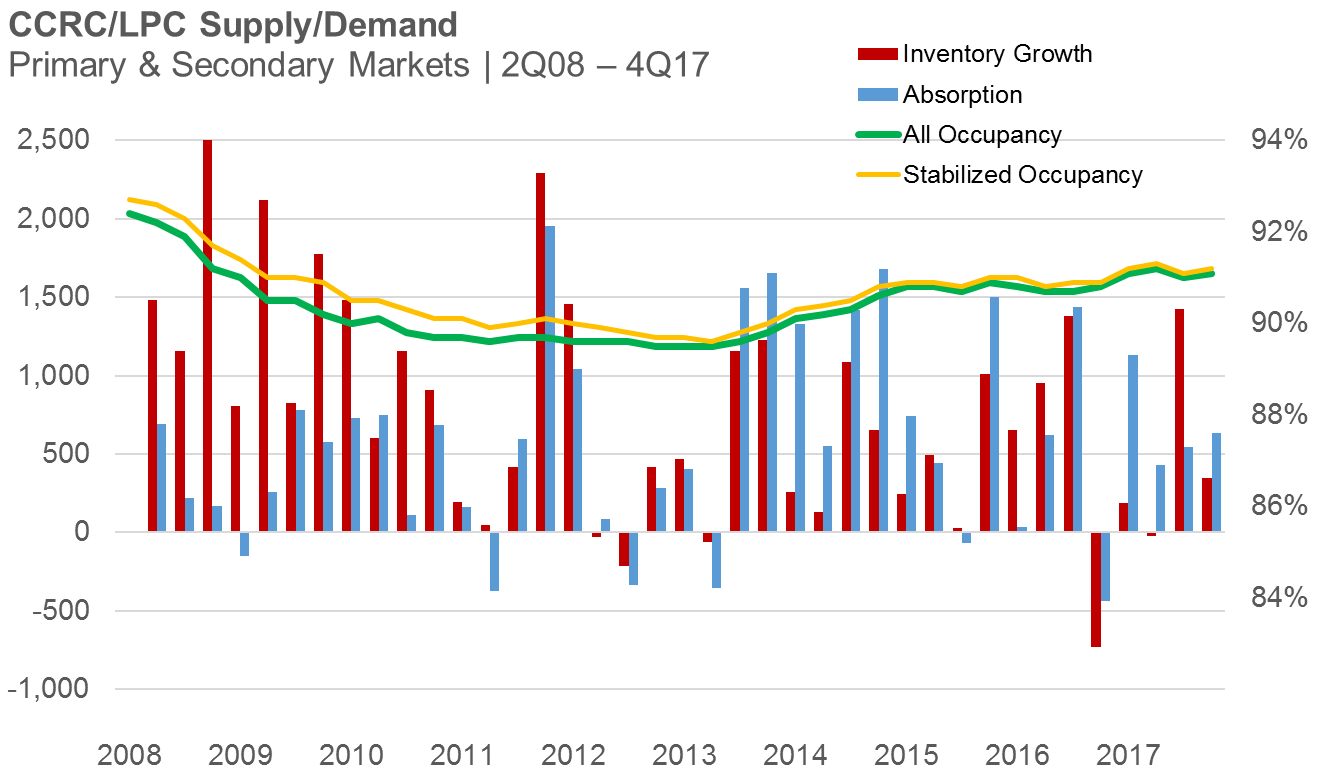
Despite relatively wide variations in inventory growth and absorption reported in the first and third quarters of 2017, on a net basis, absorption exceeded inventory growth by about 800 units, allowing occupancy to remain relatively stable.
CCRC/LPC construction is concentrated in a few markets
Compared to other types of seniors housing, CCRC/LPC construction activity is generally subdued, with about 2.6% of existing inventory currently under construction (9,347 units). Rental CCRC/LPC construction is 3.8% of existing inventory compared to 1.9% entrance fee CCRCs/LPCs.
The map below illustrates where CCRC/LPC inventory growth has been strongest as indicated by the size of the circles. In addition to absolute growth, the color of each circle represents the percentage of CCRC/LPC inventory in relation to total inventory.

As of the fourth quarter of 2017, the largest number of CCRC/LPC units under construction were located in Philadelphia (785), Kansas City (706), Los Angeles (633), Dallas (587) and New York City (566). The greatest percentage of CCRC/LPC units under construction as a share of inventory were reported for Knoxville (44%), Memphis (23%), Riverside, (18%), and Hartford (13%). Half of the primary and secondary markets (51 out of 99) had no CCRC/LPC units under construction.
Occupancy by Profit Status
Not-for-profit CCRCs/LPCs occupancy spread still hovering around 5%
The fourth quarter of 2017 saw an uptick of 10 basis points in occupancy for not-for-profit CCRCs/LPCs (currently 92.4%), while for-profit occupancy remained unchanged since the prior quarter (87.4%).
The occupancy spread for not-for-profit and for-profit CCRCs/LPCs in the combined primary and secondary markets has hovered around 5% since the third quarter of 2015.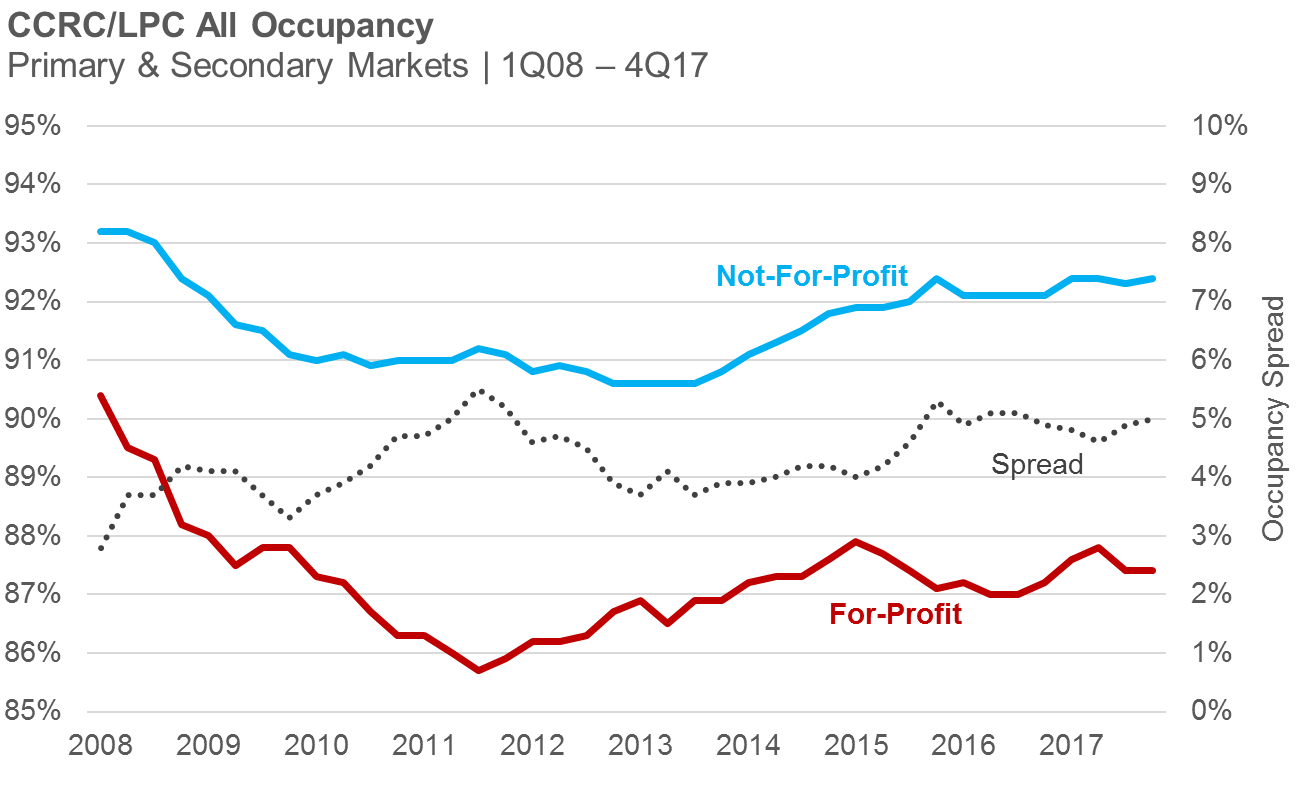
Occupancy by Market Cohort
Primary and secondary market occupancy rates continue to trend upward
As of the fourth quarter of 2017, CCRC/LPC occupancy was up 10 basis points to 91.6% for the secondary markets and 90.8% for the primary markets, respectively.
CCRC/LPC occupancy in the primary and secondary markets has been tracking relatively closely since the first quarter of 2015, with the narrowest spreads observed in the first quarter of 2015 and 2016, and the second quarter of 2017.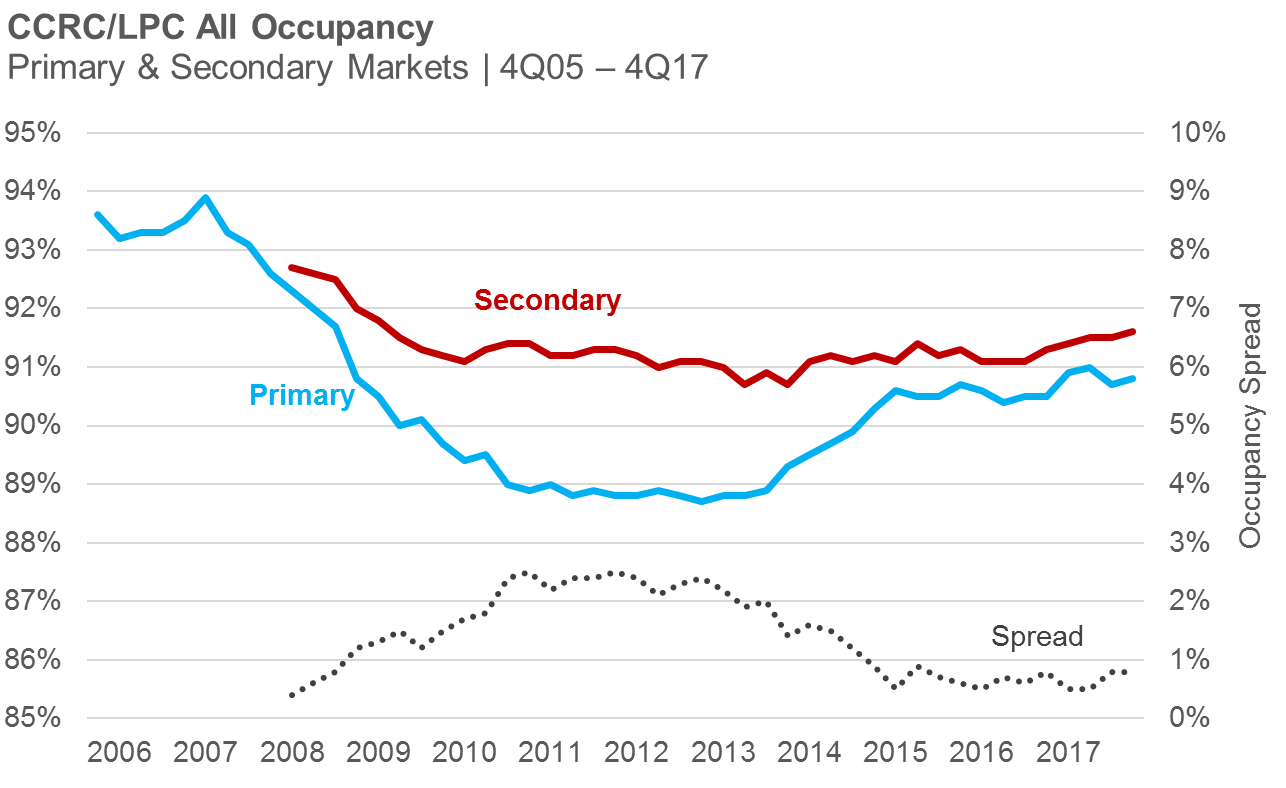
CCRC/LPC Supply & Demand by Payment Type
Entrance fee CCRCs/LPCs continue to outperform rental CCRCs/LPCs in terms of occupancy but rentals are trending upward
While entrance fee CCRCs/LPCs occupancy has been flat for the past nine quarters, rental CCRC/LPC occupancy has trended upward 60-basis points since reaching its cyclical low in the third quarter of 2016.
As of the fourth quarter of 2017, entrance fee CCRC/LPC occupancy was 92.0% and rental CCRC/LPC occupancy was 89.4%.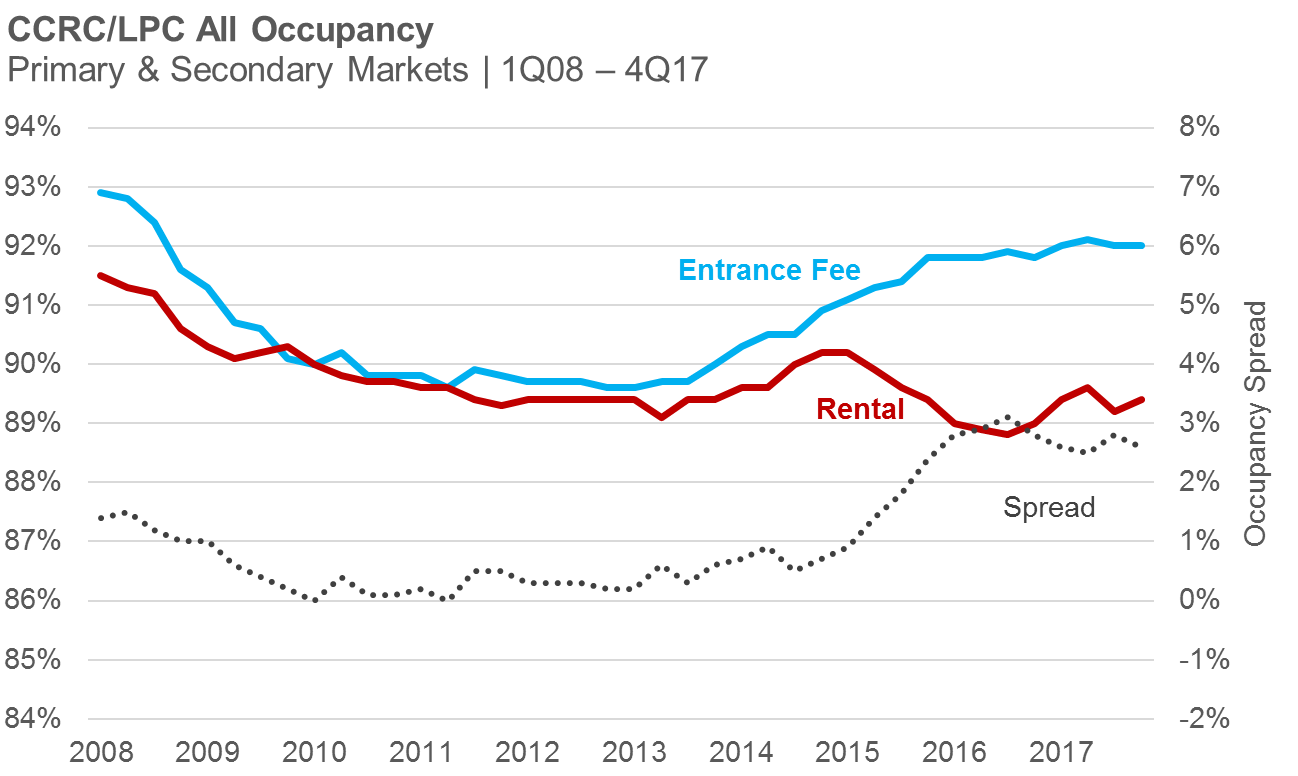
The spread between entrance fee and rental CCRC/LPC occupancy in the combined primary and secondary markets accelerated between early 2015 and mid-2016 and has since narrowed, albeit slightly. The occupancy gap is currently 2.6 percentage points, down 20 basis points from the prior quarter and equal to the first quarter of 2017.
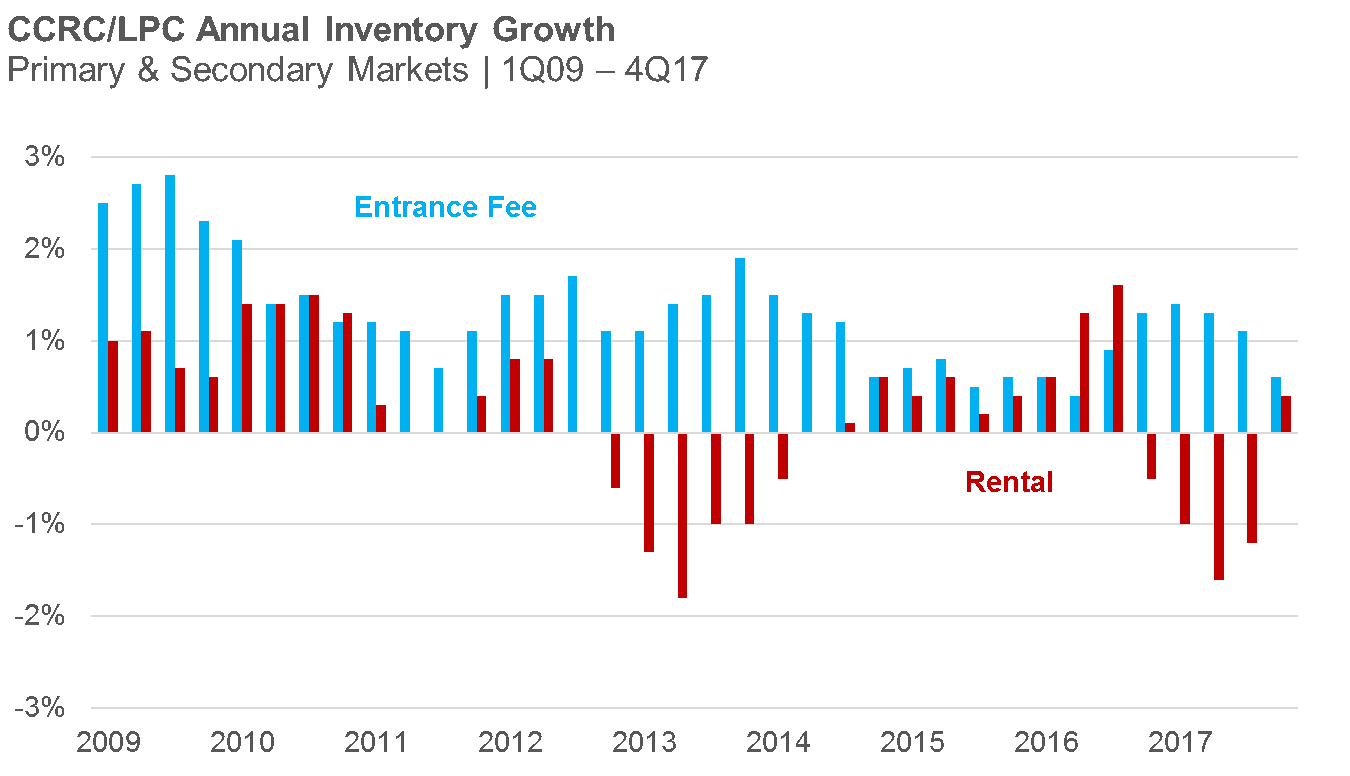
CCRC/LPC Rental annual inventory growth and absorption is positive for the first time in five quarters
As of the fourth quarter of 2017, both entrance fee and rental CCRC/LPC inventory growth and absorption is positive, however entrance fee communities have trended lower since the first quarter of 2017.
Although entrance fee CCRCs/LPCs reported an uptick in annual inventory growth beginning in the third quarter of 2016, rental CCRCs/LPCs trended downward, reporting negative figures following two quarters of peak or near-peak annual inventory growth. A net figure, negative growth may be a result of units being taken off line, or may reflect units being combined into larger residences or shifted to other community types.

Key Takeaways from the Fourth Quarter 2017
- As of the end of 2017, CCRC/LPC community occupancy remained high at 91.1%, just 10 basis points below its most recent peak reached in the second quarter.
- Not-for-profit CCRCs/LPCs lead for-profits in occupancy, and the occupancy gap has been hovering around 5 percentage points for 10 quarters.
- Primary and secondary market CCRC/LPC occupancies continue to track closely and both were trending upward as of the fourth quarter.
- Entrance fee CCRCs/LPCs continue to outperform rental CCRCS/LPCs in terms of occupancy, and rental occupancies were trending upward as of the fourth quarter.
- Compared to other types of seniors housing, CCRC/LPC construction activity is generally subdued, with about 2.6% of existing inventory under construction.
- About half of the top 99 CBSAs that NIC tracks had no CCRC/LPC units under construction, while more than a third of the construction was located in five markets: Philadelphia, Kansas City, Los Angeles, Dallas and New York.
- As of the fourth quarter of 2017, both entrance fee and rental CCRC/LPC inventory growth and absorption was positive.