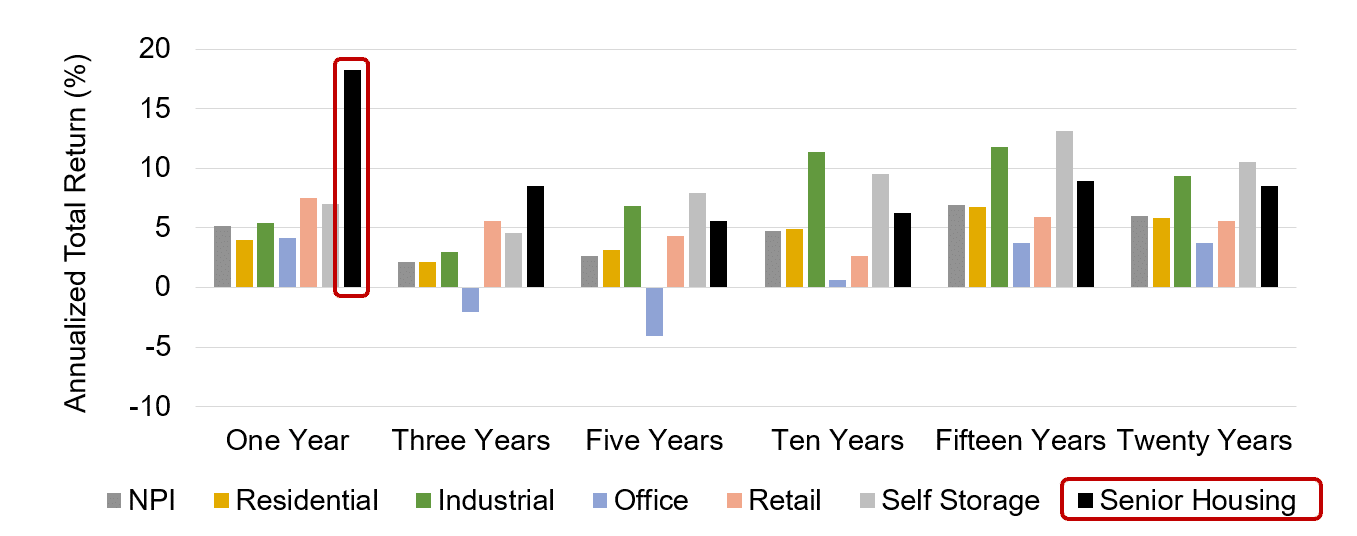
Senior housing investment performance in the third quarter of 2026 accelerated, posting a total return of 6.0%, triple the next highest return, which was retail at 2.0%. Assisted living’s total return of 6.6% outpaced independent living’s 5.4% as the gap in occupancy rates between the two property types continued to narrow. Overall, senior housing during the quarter outperformed the broader NCREIF Property Index (NPI) total return of 1.4% by nearly 460 basis points, marking the eighth consecutive quarter of index outperformance.
Breaking out return contribution, senior housing capital appreciation in the third quarter nearly doubled from the first and second quarters to 4.6%, the highest quarterly gain since 2014. The capital appreciation return is the change in value net of any capital expenditures incurred during the quarter. Senior housing income return in the third quarter held steady, once again yielding 1.4%.
Over the year-to-date period ending September 30, 2026, senior housing strongly outperformed all NCREIF Property Type Subindexes, posting the only double-digit total return at 14.4%, which was more than ten percentage points above the NPI’s total return of 4.0%. These performance measures reflect the returns of 242 senior housing properties valued at $17.8 billion in the third quarter. Overall, the number of senior housing properties tracked within the NCREIF Property Index has grown significantly from the 56 properties initially tracked in 2003, a reflection of increased institutional investment in the property type.
Turning to market fundamentals, the occupancy rate for senior housing rose 0.6 percentage points in the third quarter for the 31 NIC MAP Primary Markets to reach 90.4%, driven by positive net absorption outpacing the number of new units arriving online. The third quarter of 2026 marked the first time that senior housing occupancy rates have been above 90% since 2014.
| TOTAL RETURN | ||||
|---|---|---|---|---|
| NCREIF Property Index (NPI) |
Senior Housing |
Assisted Living |
Independent Living |
|
| 3Q 2026 | 1.4 | 6.0 | 6.6 | 5.4 |
| YTD | 4.0 | 14.4 | 15.6 | 12.0 |
| One Year | 5.2 | 18.3 | 19.8 | 15.3 |
| Three Years | 2.1 | 8.6 | 7.8 | 8.8 |
| Five Years | 2.6 | 5.6 | 4.6 | 6.3 |
| Ten Years | 4.7 | 6.2 | 5.8 | N/A |
| Fifteen Years | 6.9 | 8.9 | N/A | N/A |
| Twenty Years | 6.0 | 8.5 | N/A | N/A |
| INCOME | ||||
| NCREIF Property Index (NPI) |
Senior Housing |
Assisted Living |
Independent Living |
|
| 3Q 2026 | 1.2 | 1.4 | 1.5 | 1.3 |
| YTD | 3.5 | 4.3 | 4.5 | 4.0 |
| One Year | 4.7 | 5.7 | 6.1 | 5.3 |
| Three Years | 4.7 | 5.3 | 5.3 | 5.3 |
| Five Years | 4.5 | 4.6 | 4.4 | 4.9 |
| Ten Years | 4.5 | 4.8 | 4.6 | N/A |
| Fifteen Years | 4.8 | 5.4 | N/A | N/A |
| Twenty Years | 5.1 | 5.8 | N/A | N/A |
| APPRECIATION | ||||
| NCREIF Property Index (NPI) |
Senior Housing |
Assisted Living |
Independent Living |
|
| 3Q 2026 | 0.2 | 4.6 | 5.1 | 4.1 |
| YTD | 0.4 | 9.9 | 10.7 | 7.8 |
| One Year | 0.4 | 12.1 | 13.2 | 9.6 |
| Three Years | -2.5 | 3.2 | 2.5 | 3.3 |
| Five Years | -1.8 | 1.0 | 0.3 | 1.3 |
| Ten Years | 0.2 | 1.4 | 1.1 | N/A |
| Fifteen Years | 2.0 | 3.5 | N/A | N/A |
| Twenty Years | 0.9 | 2.6 | N/A | N/A |
| Source: NCREIF, Data through September 30, 2026 | ||||