Programs • Place • Precision • Performance
Senior living enters 2026 at an important transition point. This is the year the first baby boomers turn 80 years old, and many will begin entering into the senior living continuum. At the same time, many communities are experiencing high occupancy, markets are constrained by limited new growth and population demand dynamics are accelerating. Together, these drivers create steady momentum that will present opportunities for senior housing leaders to take practical, measurable, and actionable steps with proactive health strategies in 2026. This article examines four factors—programs, place, precision and performance from a healthcare lens to provide a look at what’s ahead.
Programs — Wellness as a Scalable Operating Engine
Wellness programs are becoming more than amenity-driven offerings and are beginning to shape core operating principles. Residents, in general, are arriving older and with greater medical needs and functional complexity, narrowing the window for effective intervention. As a result, in 2026 more reactive care models may begin to give way to structured, preventive approaches.
Leading communities are scaling prevention and customized wellness programs and technologies that integrate mobility and fall prevention, cognitive health, nutrition and hydration, behavioral health, social connection, and preventive clinical services. Increasingly, these programs are standardized, data-informed, and designed to be replicated to then further become tailored to the resident, rather than preset for one community at a time.
2026 Impact: Programs enabling senior housing with holistic wellness approaches will increasingly provide visibility as a product in the marketplace and a reliable engine that empowers residents and supports activities of daily living (ADLs) with stability, social and emotional engagement, and extended independence. The best programs in the best communities may further be seen as portable and be provided outside the community to engage partners and attract future residents.
Place — Architecture as a Platform for Health and Growth
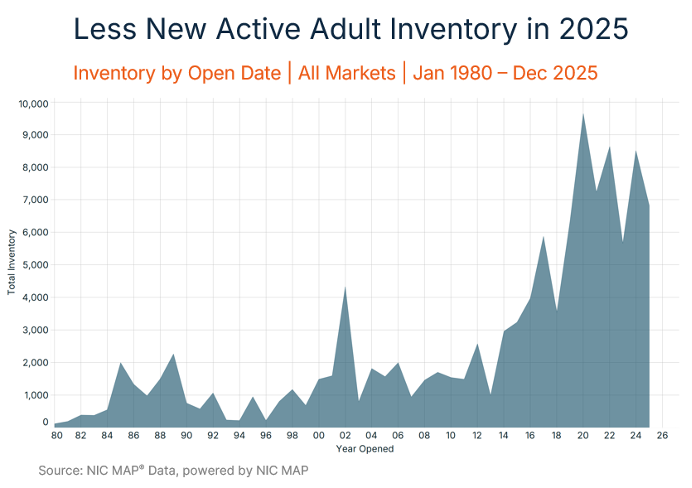
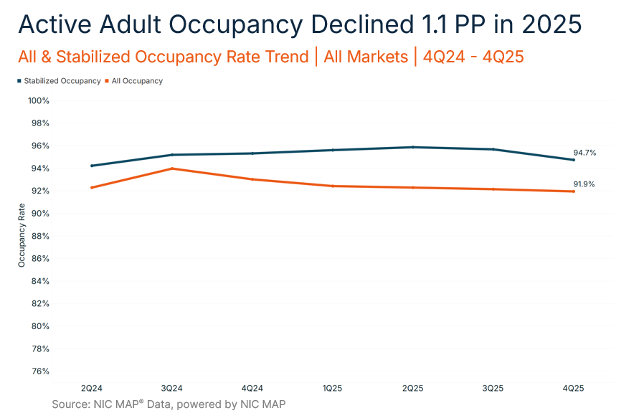
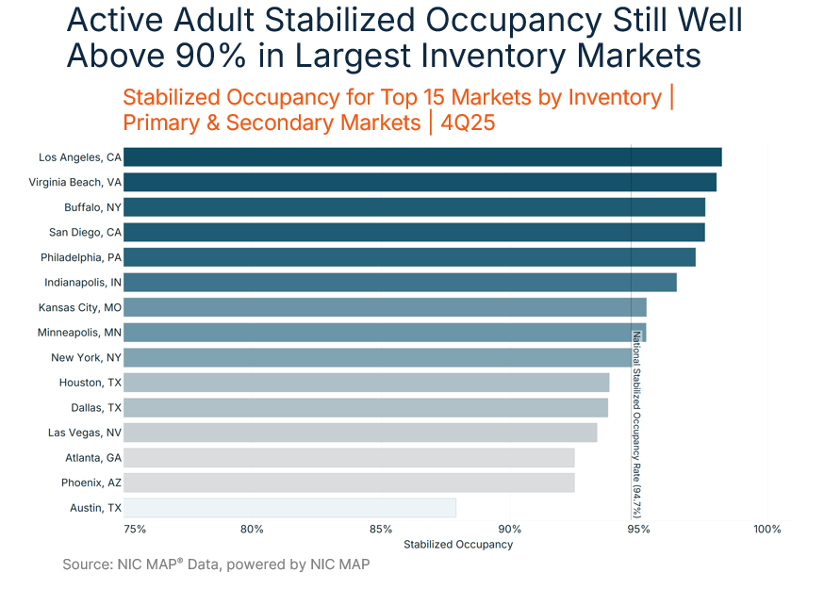
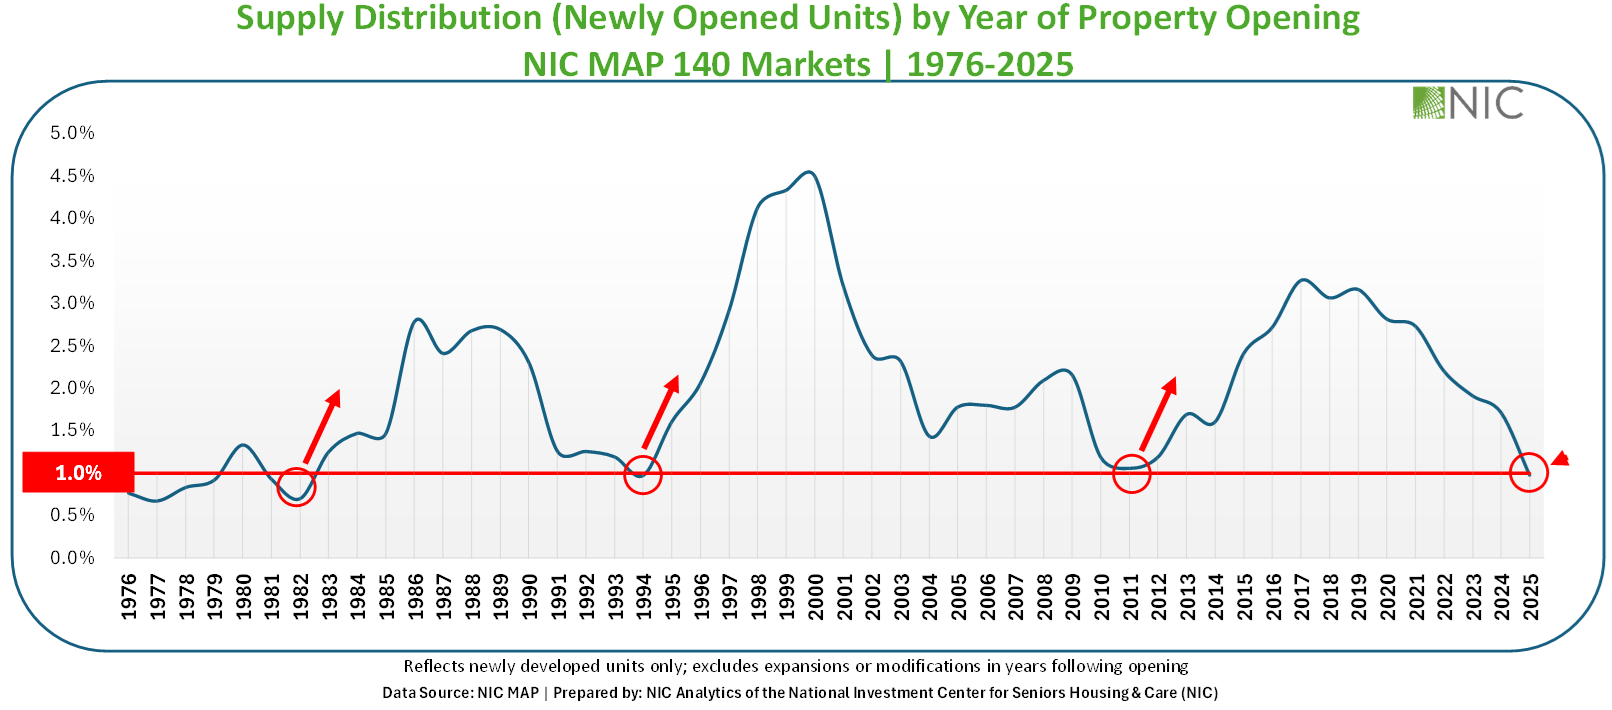
Sustained high occupancy and demographic growth are placing pressure on existing supply and will make new construction and expansion unavoidable in many markets. This creates a meaningful opportunity to design future environments that directly support health, wellness, and care delivery.
Next-generation community design is emphasizing biophilic factors—intentionally strengthening connection to nature to support health, wellbeing, and performance—while also incorporating natural, small-household layouts, walkable environments, circadian lighting, and clinical-adjacent wellness spaces. Increasingly, communities will likely launch as infrastructure-ready to accommodate future diagnostics, sensors, and care models without major retrofits and modifications.
2026 Impact: Place, as a setting, will be envisioned and designed to better meet the growing needs coming in 2026 and beyond by providing a welcoming, health-planned environment and a long-term place to grow in a community lifestyle. Creating durable assets that support resident desires and anticipate health functional needs will set the stage to begin sunsetting aging properties and dated designs.
Precision — Science and Artificial Intelligence (AI) That Enable Earlier Action
Advances in diagnostics and AI are bringing precision medicine into everyday senior care. Multi-organ biomarker panels, dementia blood tests—such as the Alzheimer’s screening blood test that launched in primary care in 2025—will continue to bring precision medicine forward, alongside digital biomarkers for gait, sleep, and hydration. Coupled with more AI-based early warning systems it will be increasingly possible to identify risk earlier and with greater confidence in senior living.
These tools can accelerate, and advance longevity even as the science will increasingly begin to better connect organ health directly to functional decline. Senior housing is a natural environment for these efforts to combine. Innovators and AgeTech solution providers will be increasingly drawn into the sector, providing more capabilities for a growing population with high health needs.
2026 Impact: Precision science will further shift care from reactive to predictive, enabling earlier, more targeted support that stabilizes function, allowing care teams to intervene before ADLs deteriorate rather than after a crisis occurs. While this shift may be more gradual, preparing short, applied programs – “science for caregivers” – and developing tech partner strategies and AI community guidelines will better enable senior housing residents, staff and leaders to embrace the benefits of precision with advanced diagnostics and AI connected care plans.
Performance — Outcomes and Policy Alignment
When Programs, Place, and Precision are successfully combined, the result can be measurable Performance: extended length of stay, fewer hospitalizations, improved functional stability, higher resident and family satisfaction, and more efficient staffing. These are all factors that national and state health programs and health payors are also focused on leveraging and testing. The drive to move healthcare (even hospital care) at home is a national movement that will continue in 2026 and beyond. Demographic shifts across the nation, expectations of residents, their families, and financial drivers in the broader healthcare insurance marketplace will increasingly integrate Performance through value-based and accountable care relationships.
This integration also aligns with recent CMS Innovation Center models such as TEAM, ACCESS and MAHA ELEVATE, which all emphasize prevention, functional support, and accountability across community-based settings. Senior living communities that operate or seek to better operate as coordinated wellness and prevention partners will be well positioned to partner with Accountable Care Organizations, hospitals and health systems. Further, the best communities may be increasingly seen as desirable for advanced utilization management and care coordination with some health payor strategies and pilots.
2026 Impact: Performance requires senior housing leaders to recognize that access to and excessive dependency on the hospital emergency room should become a legacy. It may have created performance enhancement in the past as a relief valve, but it will be increasingly scrutinized in 2026 and the future. Senior housing leaders should develop a roadmap to advance in the healthcare ecosystem to leverage their strengths, develop unparalleled relationships with residents, and find healthcare partnerships that suit their goals and resident needs. More advanced senior housing organizations may also begin taking further control over Performance by designing, customizing and launching their own health insurance plans and contracted services.
What’s Next?
In 2026 NIC will provide data, insights, and analytics to empower senior housing leaders to succeed on their healthcare journey. Roadmaps, tools, playbooks and insightful training and education sessions are coming across these four factors that will help leaders continue to succeed in bringing healthcare home for seniors.