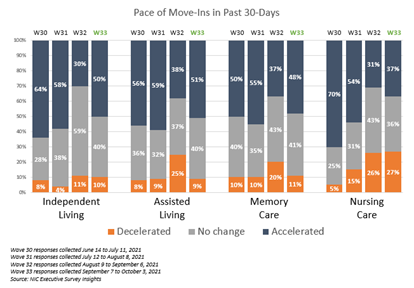
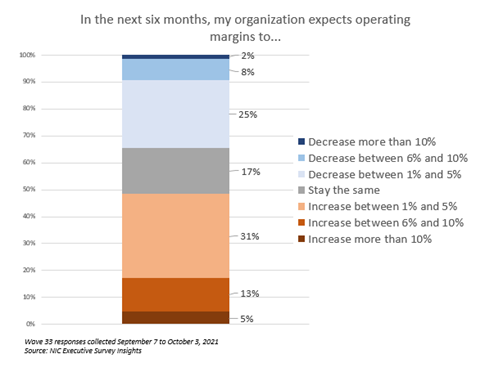
“In the Wave 33 survey, roughly 50% of respondents with senior living residences report that the pace of move-ins accelerated in the past 30-days—a notable increase from the prior survey. The shift was smaller for nursing care. Increased resident demand was the primary reason for acceleration in move-ins. Operators have suffered pandemic-related vacancies and myriad unplanned expenses and NOI has been pressured. In the Wave 33 survey, respondents were asked how much they expect their operating margins to increase or decrease in the next six months. Roughly half of respondents (49%) indicated they expect operating margins to increase with about one-third (31%) anticipating an increase between 1% and 5%.”
—Lana Peck, Senior Principal, NIC
NIC’s Executive Survey of operators in seniors housing and skilled nursing is designed to deliver transparency into market fundamentals in the seniors housing and care space as market conditions continue to change. This Wave 33 survey includes responses collected September 7 to October 3, 2021, from owners and executives of 67 small, medium, and large seniors housing and skilled nursing operators from across the nation, representing hundreds of buildings and thousands of units across respondents’ portfolios of properties.
Detailed reports for each “wave” of the survey and a PDF of the report charts can be found on the NIC COVID-19 Resource Center webpage under Executive Survey Insights.
Wave 33 Summary of Insights and Findings
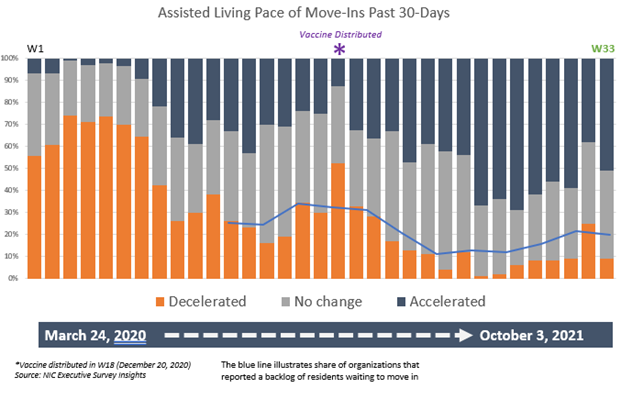
- In the Wave 33 survey (representing operator experience in the month of August) roughly 50% of respondents with independent living, assisted living and/or memory care units report that the pace of move-ins accelerated in the past 30-days—a notable increase from the Wave 32 survey a month earlier. The shift was smaller for nursing care where 37% saw the pace of move-ins accelerating in the past 30-days, up slightly from 31% in the prior survey. Increased resident demand was the primary reason for acceleration in move-ins as the COVID-19 Delta variant’s pace of infection began to slow in many areas of the country.
- Illustrated in the chart below, the share of organizations with residents waiting to move in was nearly 35% in November 2020 during the third peak of the virus (Wave 16 conducted Nov. 9 – 22, 2020). After the COVID-19 vaccine became available through the Long-Term Care Vaccination Program in the latter half of December the backlog of move-ins began to ease for many operators. Organizations reporting an increase in the pace of move-ins remained robust until the Wave 32 survey (August 9 – September 6, 2021), and has since improved.
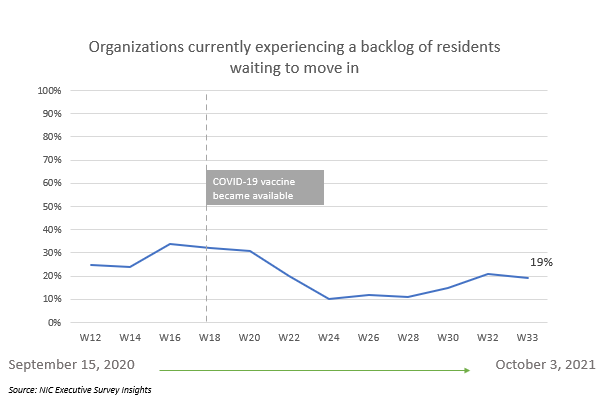
- During the summer, as the Delta variant primarily affected unvaccinated individuals, the share of organizations experiencing a backlog of residents waiting to move in grew slightly. The chart below shows the full time-series of the pace of move-ins for the assisted living care segment. It is interesting to note the similarities of the shares of organizations reporting a deceleration in the pace of move-ins (orange segments below) compared to the shape of the line chart (above) depicting backlog of residents waiting to move in.
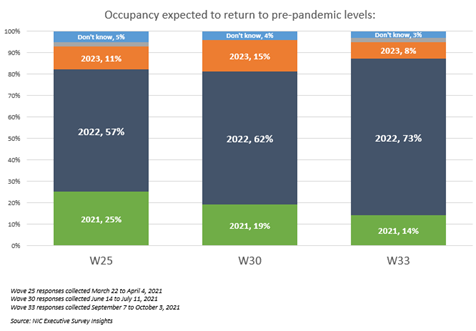
- Despite the temporary decline in the momentum in the pace of move-ins experienced by some operators in Wave 32, optimism regarding occupancy recovery is strengthening. Nearly three-quarters of respondents (73%) currently expect their organization’s occupancy to return to pre-pandemic levels sometime in 2022–up from 57% in the Wave 25 survey (March 22 – April 4, 2021).
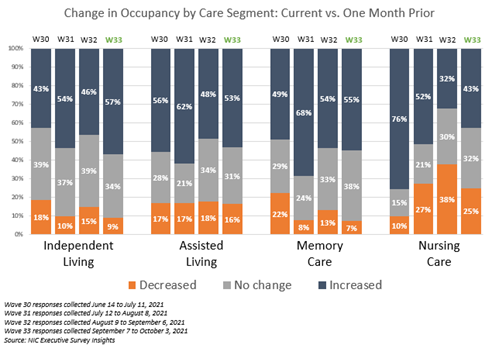
- In Wave 33 between roughly 50%-60% of organizations with independent living, assisted living and/or memory care units reported an increase in occupancy across their portfolios of properties in the past 30-days. About 40% of organizations with nursing care beds saw an increase in nursing care occupancy, up from one-third (32%) in the prior survey but still significantly below Wave 30 (June 14 – July 11) when three-quarters of organizations with nursing care beds saw occupancy increases in the 30-days prior (76%).
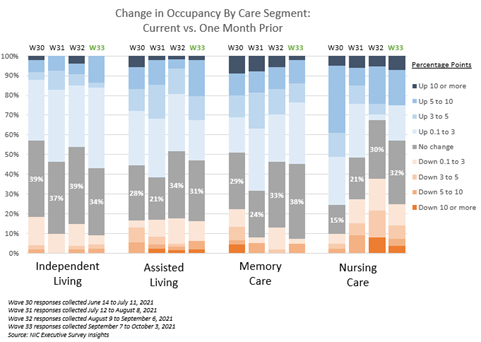
- In Wave 33, the share of organizations with independent living units reporting an increase in occupancy (57%) was equivalent to the peak reached in the Wave 28 survey (May 3 – 16, 2021). However, as shown in the chart below, most occupancy increases were relatively small for the independent living care segment (about 40% between 0.1 and 3 percentage points). Of note, between roughly one-quarter and one-third of organizations with assisted living, memory care and/or nursing care units saw occupancy increases of three percentage points or more.
- Staffing shortages that were experienced by many seniors housing and care operators prior to and exacerbated by the pandemic persist. As recently as this summer, as the COVID-19 virus Delta variant spread across the country, nearly all operators responding to NIC’s Executive Survey Insights conducted since July reported that their organizations were experiencing staffing shortages. Additionally, all respondents were paying staff overtime hours, and four out of five organizations were tapping expensive agency/temp staff to fill gaps in schedules and replace workers who left the labor force during the pandemic.
- In recent surveys, respondents were asked to rate the biggest challenge facing their organization today. By August, the share of organizations that cited attracting community and caregiving staff as their biggest challenge had risen from about 75% to roughly 90%.
- Typically, wages and benefits are significant operating expenses for a senior housing property (comprising up to 60% of overall expenses). Since the beginning of the pandemic, operators have sustained myriad unplanned expenses. And considering the losses of revenue associated with a pandemic-related decline in occupancy rates NOI has been pressured for many operators and their capital partners. In the Wave 33 survey, respondents were asked how much they expect their operating margins to increase or decrease in the next six months. Roughly half of respondents (49%) indicated they expect operating margins to increase. While about one-third (31%) anticipate an increase between 1% and 5%, one-quarter (25%) expect a decrease between 1 and 5%.
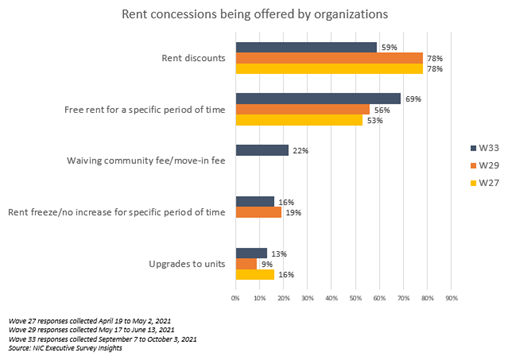
- While rent concessions often help to drive increases in occupancy, the shares of organizations offering rent concessions has not varied significantly since last summer (2020) when NIC began tracking the data. Currently, one-half (51%) of respondents are offering rent concessions to attract new residents. Fewer are offering rent discounts than in previous surveys (59% vs. 78% in Waves 27 and 29), however more are incentivizing with free rent for a specific period (69%).
Wave 33 Survey Demographics
- Responses were collected between September 7 and October 3, 2021, from owners and executives of 67 seniors housing and skilled nursing operators from across the nation. Owner/operators with 1 to 10 properties comprise one-half (50%) of the sample. Operators with 11 to 25 and 26 properties or more make up 25% of the sample, respectively.
- Under two-thirds of respondents are exclusively for-profit providers (62%); under one-third operate not-for-profit (29%) and 9% operate both.
- Many respondents in the sample report operating combinations of property types. Across their entire portfolios of properties, 74% of the organizations operate seniors housing properties (IL, AL, MC), 26% operate nursing care properties, and 29% operate CCRCs (aka Life Plan Communities).
Owners and C-suite executives of seniors housing and care properties, please help us tell an accurate story about our industry’s performance.
The current survey is available and takes under ten minutes to complete. If you are an owner or C-suite executive of seniors housing and care and have not received an email invitation to take the survey, please contact Lana Peck at lpeck@nic.org to be added to the list of recipients.
NIC wishes to thank survey respondents for their valuable input and continuing support for this effort to bring clarity and create a comprehensive and honest narrative in the seniors housing and care space at a time when trends are continuing to change in our sector.