This analysis examines the supply-demand dynamics, regional occupancy patterns, and rate growth trends among 5,461 freestanding nursing care communities across the 99 NIC MAP Primary and Secondary Markets as of the first quarter of 2026.
Fundamentals of Freestanding Nursing Care Communities
Occupancy Continues to Rise
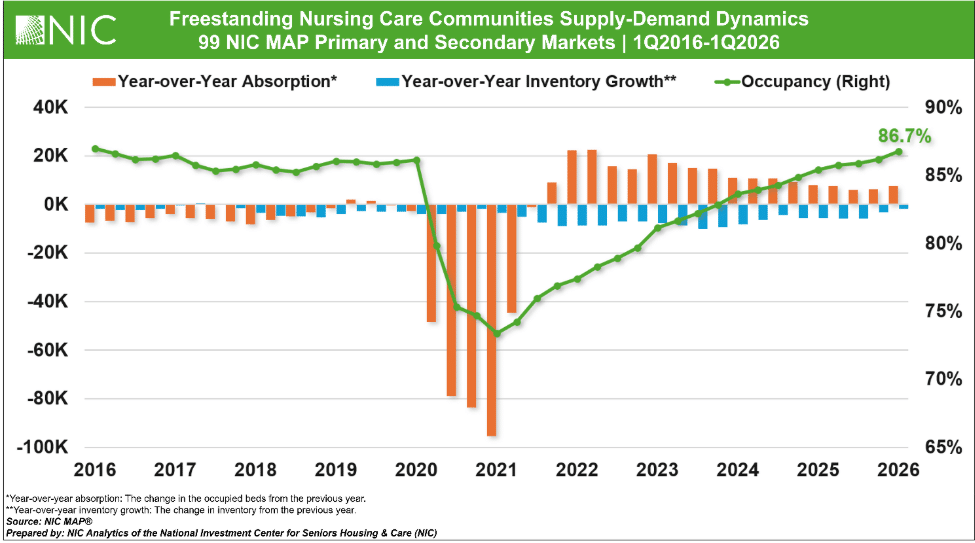
The occupancy rate for freestanding nursing care communities reached 86.7% in the first quarter of 2026 across the 99 Primary and Secondary Markets. After reaching a series low of 73.4% in the first quarter of 2021, occupancy increased for 20 consecutive quarters, gaining a cumulative 13.3 percentage points through the first quarter of 2026. This sustained improvement reflects strengthening demand fundamentals, supported by positive absorption and continued inventory contraction. At 86.7%, freestanding nursing care occupancy is now at its highest level since 2016.
Demand Remains Resilient
After moderating from the elevated levels recorded in 2022 and 2023, often attributed to the post-pandemic recovery, year-over-year absorption for freestanding nursing care communities across the 99 Primary and Secondary Markets stood at 1.3% (7,738 newly occupied beds) in the first quarter of 2026, compared to 3.7% (20,692 newly occupied beds) in the first quarter of 2023. Despite the moderating demand, the continued positive absorption pattern for 18 consecutive quarters through early 2026 suggests that demand remains resilient across the nursing care sector. This is a marked difference in the demand levels seen in the quarters leading up to the pandemic.
Supply Contraction Slows
Across the 99 Primary and Secondary Markets, year-over-year inventory growth for freestanding nursing care communities has remained negative, reflecting a prolonged period of supply reduction. The contraction was especially significant from 2021 through 2024, when year-over-year inventory declines often ranged from approximately 6,000 to 10,000 beds. More recently, however, the pace of decline has slowed, with year-over-year inventory declines narrowing from negative 0.8% (-5,512 beds) in the first quarter of 2025 to negative 0.2% (-1,704 beds) in early 2026.
Regional Occupancy Patterns
The following map shows regional occupancy rates for freestanding nursing care communities across the 99 Primary and Secondary Markets in the first quarter of 2026.
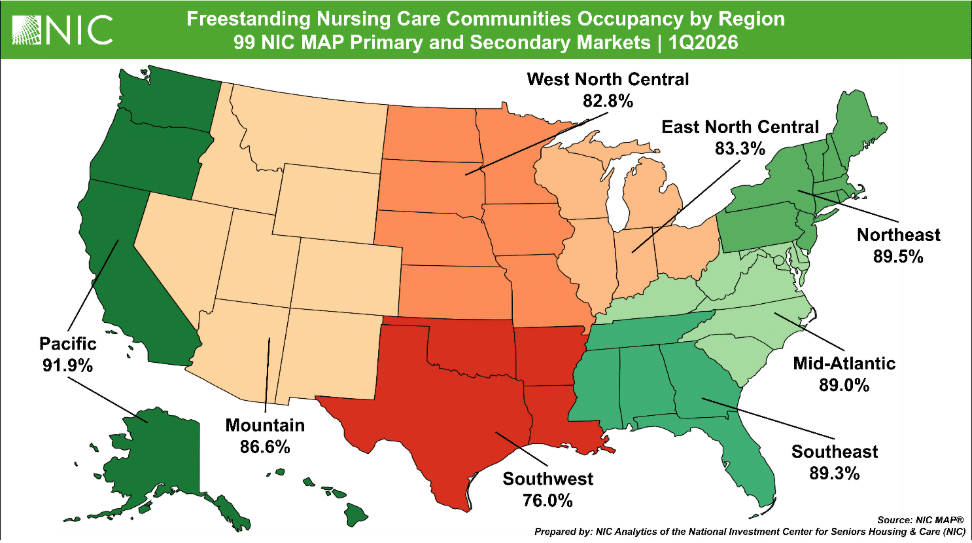
The Pacific region recorded the highest occupancy at 91.9%, supported by strong performance across several California markets. The Northeast, Southeast, and Mid-Atlantic regions also posted relatively strong occupancy, each reaching approximately 89% or higher.
By contrast, the Southwest region had the lowest occupancy at 76.0%, well below all other regions, with several Texas and Oklahoma markets reporting relatively lower occupancy. The East North Central and West North Central regions also reported below-average occupancy among the 99 Primary and Secondary Markets, at 83.3% and 82.8%, respectively, while the Mountain region was closer to the national average (86.7%) with 86.6% of beds occupied in the first quarter.
Overall, the regional pattern suggests that freestanding nursing care occupancy is strongest in several coastal regions, while parts of the Southwest continue to lag.
Year-over-Year Rate Growth Surpassed 5%
The exhibit below shows the year-over-year average private-pay daily rate growth for freestanding nursing care communities across the 99 Primary and Secondary Markets.
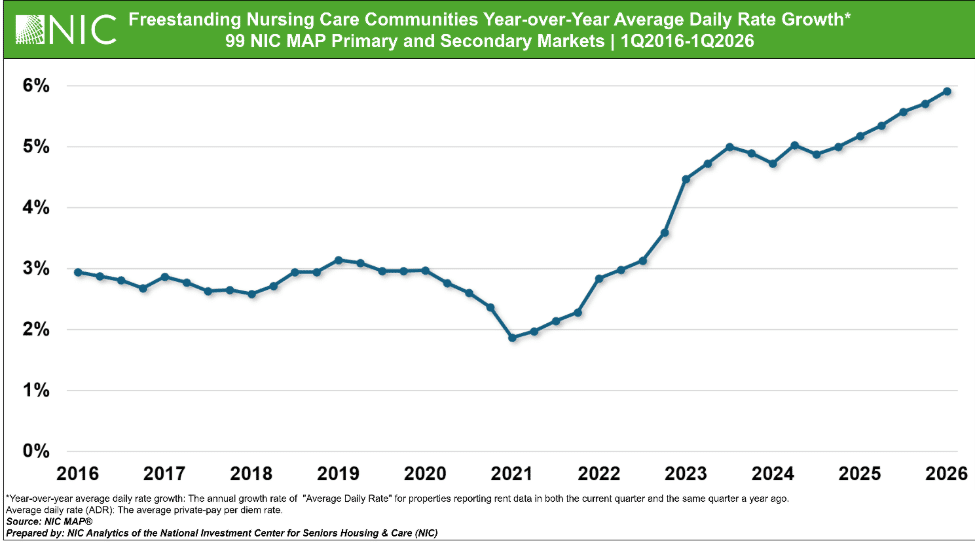
In the first quarter of 2026, year-over-year rate growth for freestanding nursing care communities remained elevated at 5.9%, the highest level recorded between 2016 and 2026. After remaining relatively modest from 2016 through 2021, year-over-year rate growth began to strengthen in 2022 and has stayed elevated since 2023. More recently, the pace of growth continued to increase, rising from 4.7% in the first quarter of 2024 to 5.2% in the first quarter of 2025 and 5.9% in the first quarter of 2026, indicating sustained pricing momentum across the nursing care sector. As a result, the average daily rate reached $420 in the first quarter of 2026, representing a 27.5% increase from the first quarter of 2019.
Look for future articles from NIC to learn more about the nursing care sector.