Skilled Nursing COVID-19 Tracker
View weekly rate of change in skilled nursing facilities, by geography
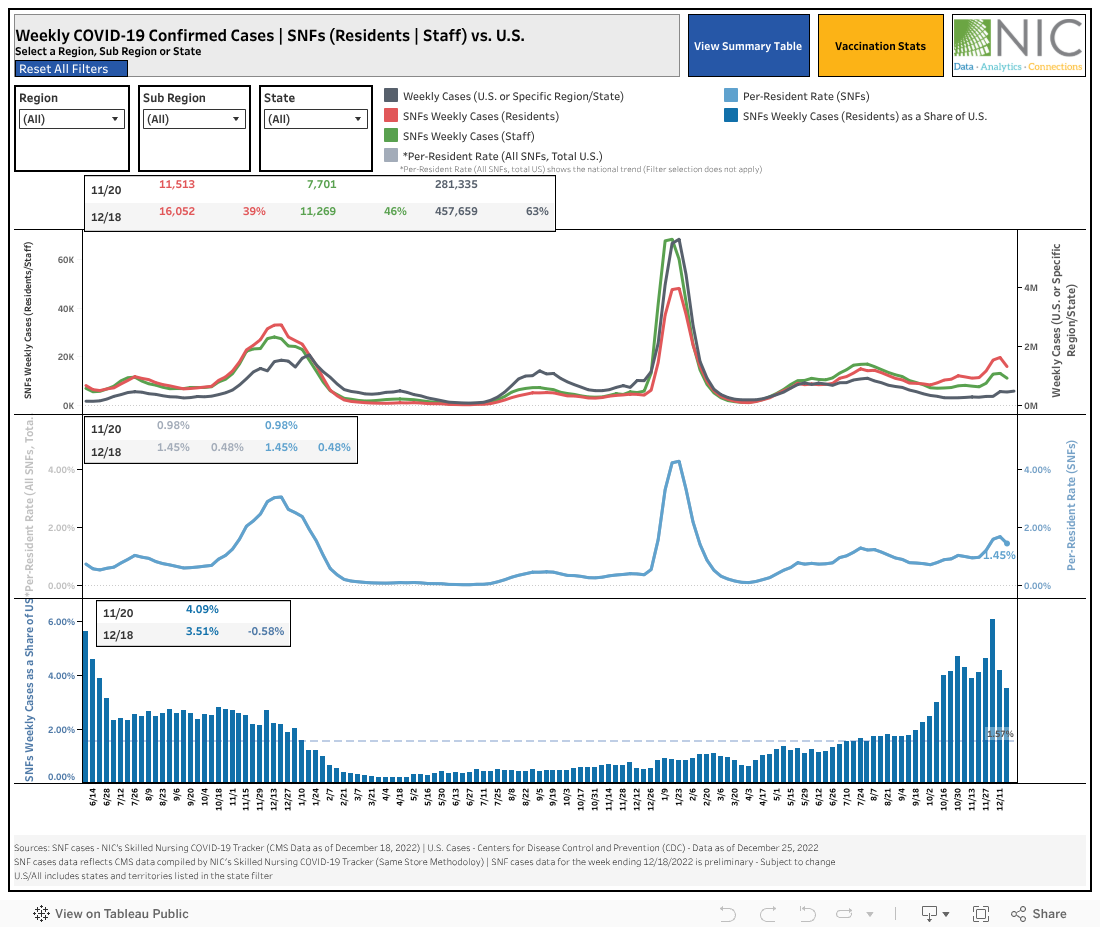
NIC’s Skilled Nursing COVID-19 Tracker (SNF Tracker) shows the week-over-week change rate for new resident cases of COVID-19 within skilled nursing facilities on a per-facility basis, by geography. The data is displayed in an easy-to-use interactive dashboard that allows sorts down to the county level.
The all-new Supplemental Data interactive dashboard offers a means for understanding the challenges faced by skilled nursing facilities, highlighting facilities’ actions and measures related to testing, PPE, and staffing.
The SNF Tracker and Supplement Data provide an indicator on the rate of virus spread within skilled nursing communities by geographic location, offering a way to better understand where and why cases are spreading, slowing, or remaining flat. Data show incremental confirmed cases and fatalities week-over-week on a per-facility basis, percent of residents with newly confirmed cases, percent of fatalities, and occupancy changes (based on CMS data) in same store* skilled nursing facilities.
- Interactive dashboard. Sort by map, or filter by U.S. region, subregion, state, and county
- Week-over-week comparisons at both state and county levels
- Rate of change of confirmed cases and fatalities
- Time series trends, including change in cases, fatalities, and occupancy
- Supplemental data filters by property size, occupancy, and new cases as a share of residents
- Vaccination coverage Sort by U.S. region, subregion, and state
Interactive Tool – Weekly COVID-19 Confirmed Cases | Skilled Nursing Facilities (Residents & Staff) vs. U.S.
Choose specific regions or states from the dropdowns in the tool below to change the graphs, or any two weeks comparison in the (View All States tab) to compute the percent change.
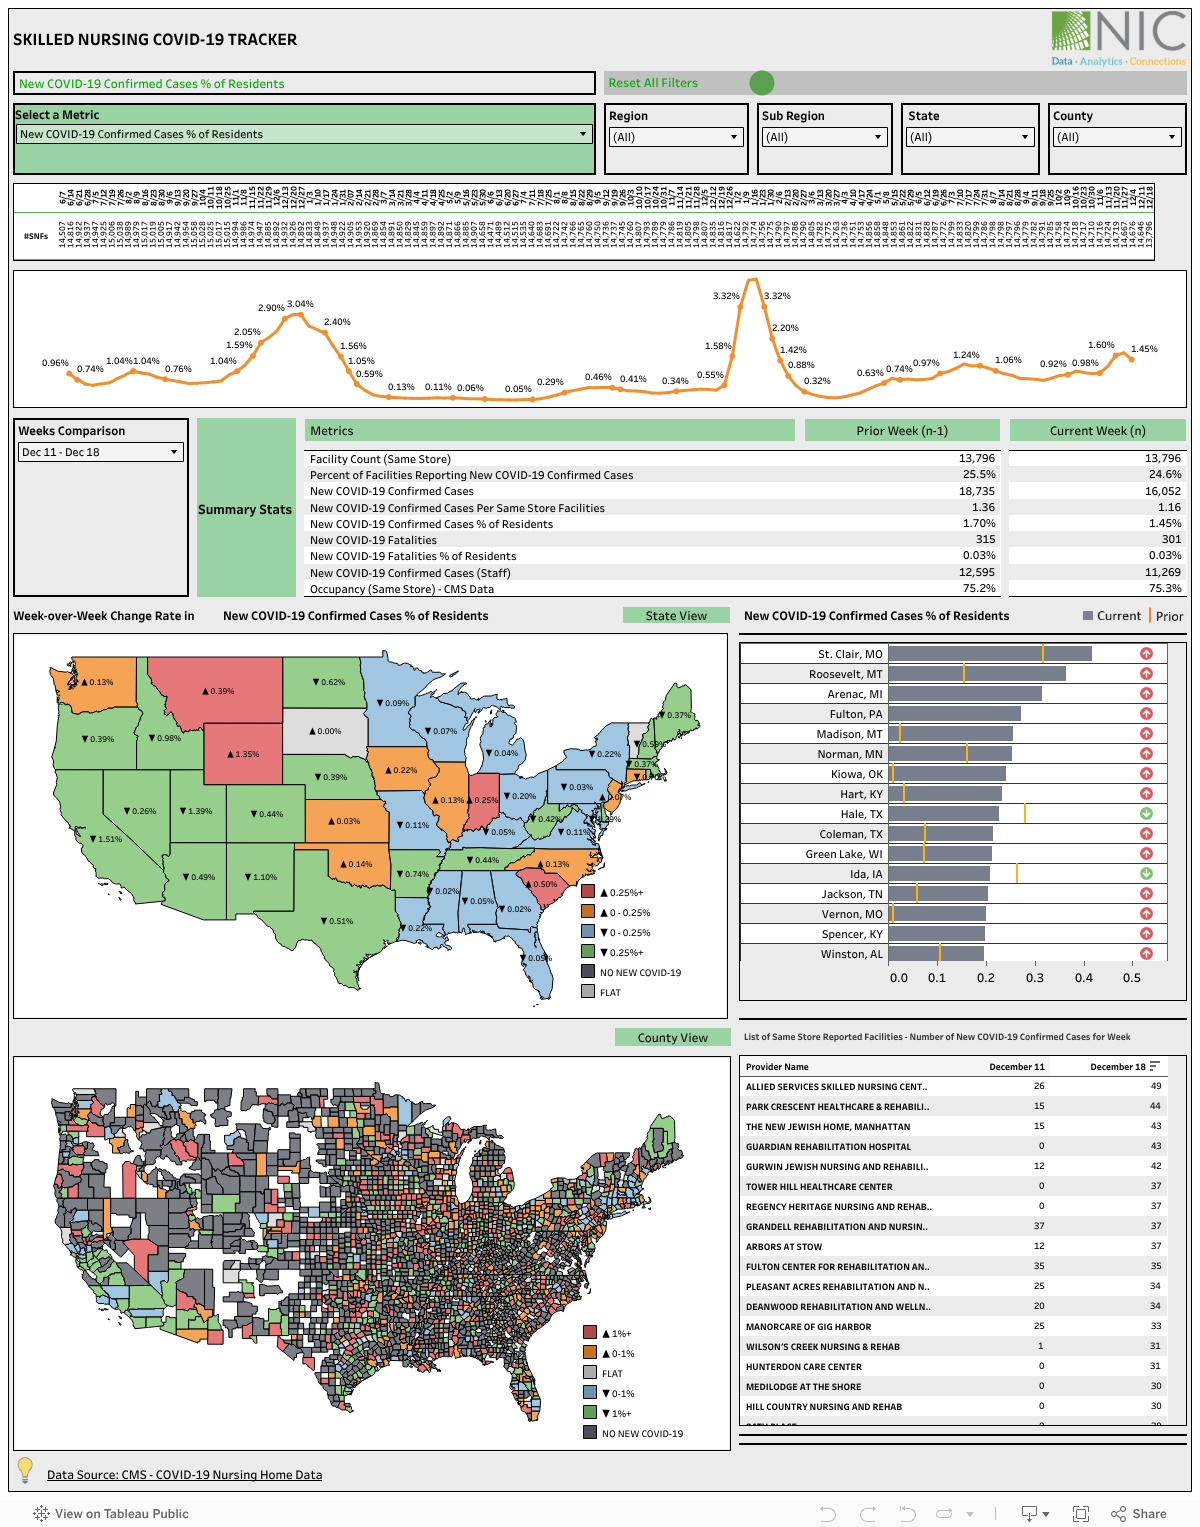
Skilled Nursing COVID-19 Tracker
Skilled Nursing COVID-19 Tracker – Special Edition December 2020
Skilled Nursing COVID-19 Tracker Additional Details:
- Tracker data provides a per-facility metric, enabling a more direct comparison between geographic areas while normalizing for the number of skilled nursing facilities.
- Tracking new cases per facility rather than the cumulative number of cases over time provides a metric more sensitive to changes in current COVID-19 testing reach and reach of the virus among residents.
- Tracker data shows week-to-week changes in new cases per facility to indicate where the virus is accelerating its spread and where the spread of the virus is slowing, subject to limitations in the reach, and timing of testing and reporting.
- Data is derived from the Nursing Home COVID-19 Public File, the most comprehensive and timely set of data available, as captured by the CDC and reported out by the Centers for Medicare & Medicaid Services (CMS). Only those facilities that submitted data for the reporting week and passed the CDC’s Quality Assurance checks are included. Additionally, facilities that did not provide total number of beds or occupied beds or where occupied number of beds were greater than total number of beds were excluded.
- Data shown for New COVID-19 Fatalities Percent of Residents highlights “Residents weekly COVID-19 deaths” as described by the CDC: Number of residents with new suspected or laboratory positive COVID-19 who died in the facility or another location (COVID-19 DEATHS) as reported by the provider for this collection date.
SNF Tracker data* includes:
- Facility Count (Same Store)
- Percent of Properties Reporting New COVID-19 Confirmed Cases
- New COVID-19 Confirmed Cases
- New COVID-19 Confirmed Cases/Same Store Facilities
- New COVID-19 Confirmed Cases Percent of Residents
- Occupancy/Same Store – Based on CMS Data
- Week over Week Change in Occupancy
- Week-over-Week Change in Confirmed Cases/Same Store Facilities
- Week over Week Change in New COVID-19 Confirmed Cases Percent of Residents
- Week over Week Change in New COVID-19 Fatalities Percent of Residents
- New COVID-19 Fatalities Percent of Residents
- New COVID-19 Confirmed Cases (Staff)+
- List of same-store facilities (COVID-19 Confirmed Cases –current & prior week)
Vaccination coverage
- # Skilled Nursing Facilities (SNFs)
- % SNFs reporting vaccination data to CMS
- # Residents staying in facilities reporting vaccination data (at least one day this week)
- % Fully vaccinated residents
- % Partially vaccinated residents
- # All healthcare personnel eligible to work in facilities reporting vaccination data (at least one day this week)
- % Fully vaccinated healthcare personnel
- % Partially vaccinated healthcare personnel
+Staff and facility personnel
*Results calculated using “same store” methodology. This methodology includes only those facilities that have reported in both comparison time periods (week-over-week). Facilities reporting in one but not both weeks are removed from the analysis. Total count using same-store metrics will vary from total geographic count provided directly in CDC data.
Supplemental Data Dashboard
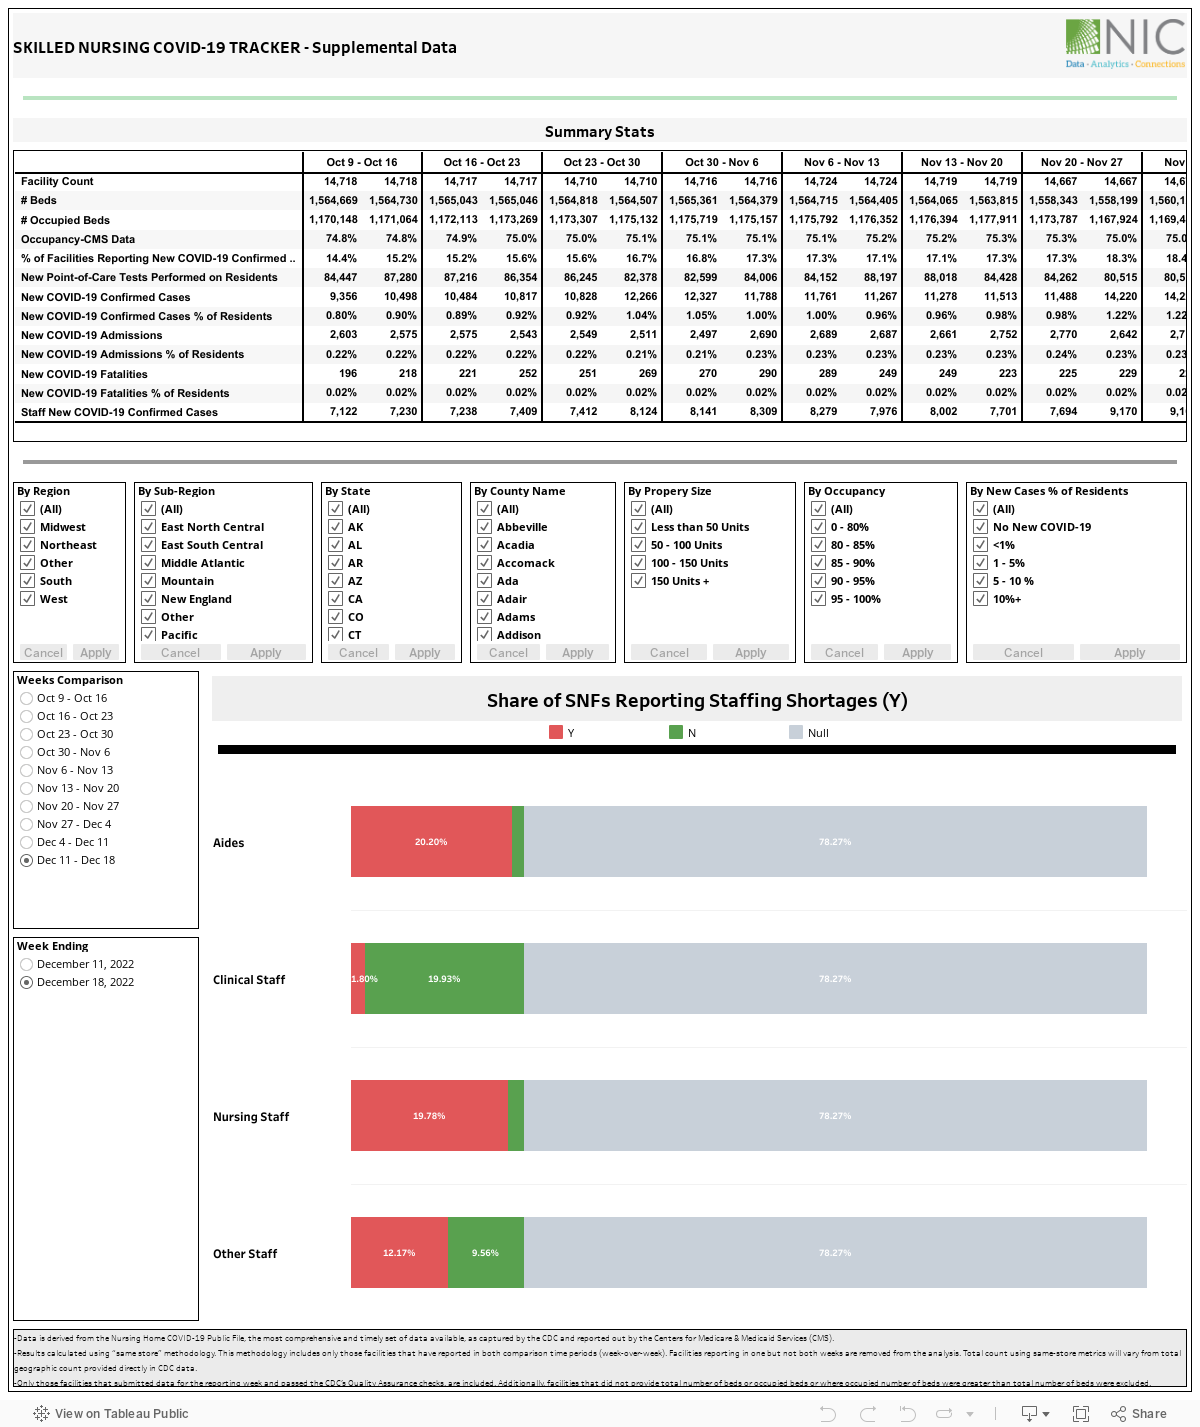
Supplemental Data Additional Details:
The supplemental data is derived from the same set of data used in the Skilled Nursing COVID-19 Tracker (same store methodology) to provide insights into the rate of virus spread and help explain why and where the virus is spreading, slowing, or remaining flat. The Supplemental Data complements the SNF Tracker.
The report provides access to the underlying data (property level) to track properties in a specific market that lack resources to test residents, personal protective equipment (PPE), or have shortages of staff and/or personnel. This could help stakeholders allocate necessary resources to those properties.
In addition, the Supplemental Data provides a summary stats table with different metrics allowing the user to track the development of cases, fatalities and other contributing factors as mentioned above. The Supplemental Data report captures the most recent 10 CMS reporting periods. The tooltip includes the questions as they appear in CMS raw data file, indicating if a property answered (Y/N), Facility Count (Same Store), Percent of Total, Residents New COVID-19 Confirmed Cases, Staff New COVID-19 Confirmed Cases.
The questions have been categorized into 5 groups for both, residents and staff/personnel.
- Testing
- When does testing occur?
- Reason for not testing
- Any current supply of PPE
- Shortages of staff and/or personnel