NIC Skilled Nursing Data Report: Key Takeaways from the First Quarter 2019

  • First year-over-year occupancy increase since January 2015
  • Managed Medicare revenue mix reaches time-series high of 12.1%, higher in urban areas

NIC released its first quarter 2019 Skilled Nursing Data Report last week, which includes key monthly data points from January 2012 through March 2019.

Here are some key takeaways from the report:

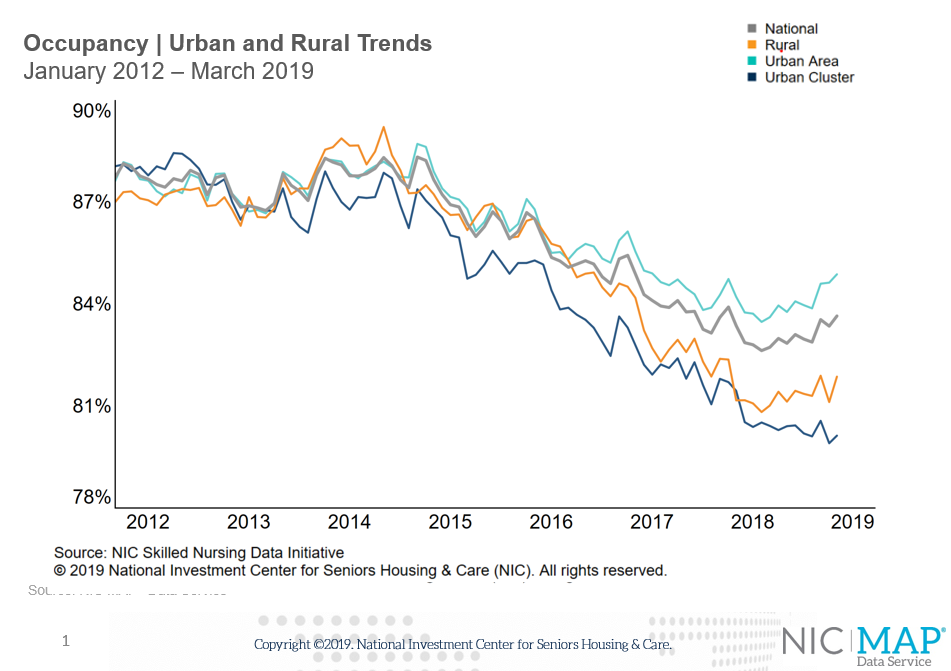
  1. Occupancy has been on an upward trend since June of last year (2018). Overall occupancy increased 77 basis points from the fourth quarter of 2018 to 83.7% in the first quarter of 2019, the highest rate since the first quarter of 2018. An increase in occupancy is typically expected from the fourth to the first quarter, given the flu season and higher admissions in the winter months. However, as occupancy has shown strength over the past several months, it suggests that seasonality is not the only factor in the recent uptrend in occupancy. In fact, year-over-year occupancy was also positive as it increased 28 basis points from March of 2018. This is the first yearly increase in occupancy since January 2015. The occupancy trend was the same in both rural and urban areas as it increased on both a quarterly and yearly basis. The quarterly occupancy increase was more pronounced in urban areas, however, as it increased 100 basis points from the fourth quarter to 84.9% at the end the first quarter 2019.
  2. First quarter skilled mix increased from the fourth quarter. The gain was mostly driven by the increase in managed Medicare, although Medicare mix rose as well. This suggests that higher acuity patients were a driver in the first quarter as they are often admitted during the winter/flu season which in turn often drives an increase in overall occupancy. Skilled mix increased 84 basis points from the fourth quarter 2018 to end the first quarter 2019 at 26.0%. However, skilled mix was down 103 basis points compared to the first quarter of 2018 when it was at 27.0%. Skilled mix increased in urban and rural areas as well compared to the fourth quarter 2018 ending at 27.0% and 22.2%, respectively. Urban and rural both declined in terms of skilled mix compared to March 2018.
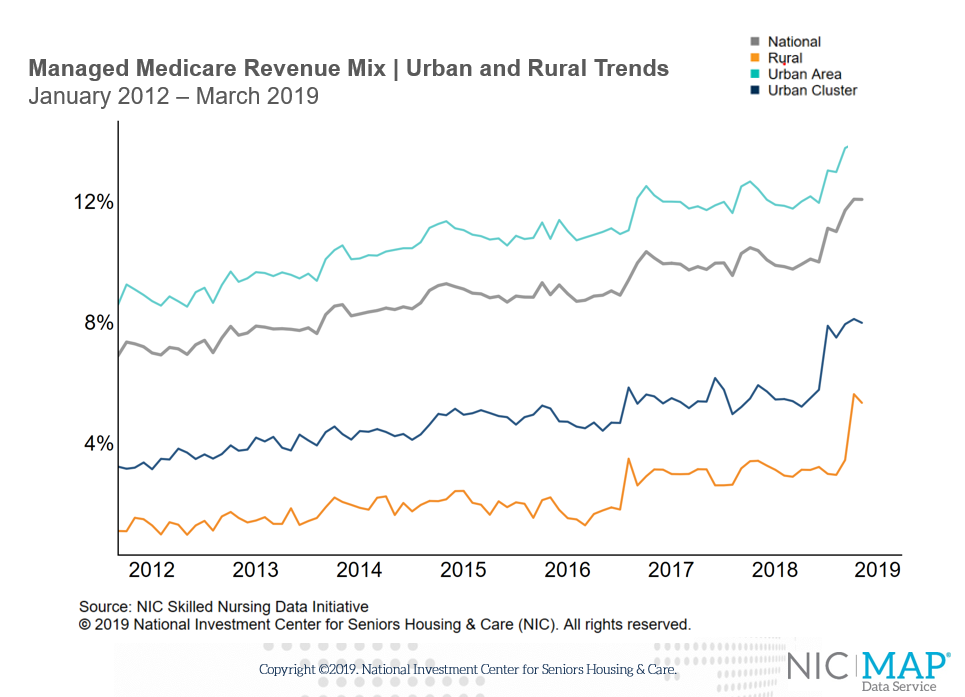
  3. Overall managed Medicare revenue mix reached a time-series high in the first quarter 2019, ending March 2019 at 12.1%. This revenue mix increased 106 basis points from the fourth quarter of 2018 and 169 basis points from the first quarter of 2018 when it was 10.4%. This continued growing influence on operator revenue further demonstrates the importance of the managed Medicare payor within the skilled nursing sector. This trend is evident across both the urban and rural areas. The revenue mix is highest in the urban areas, where penetration is higher due to the density and managed care opportunity, as it ended the first quarter 2019 at 14.0%. Interestingly, the rural areas now register over 5% in terms of managed Medicare revenue mix ending the first quarter 2019 at 5.4%.
  4. Managed Medicare revenue per patient day (RPPD) pressures became evident again in the latest data as it decreased from $439 in the fourth quarter 2018 to $432 as of March 2019. It was down $14, or 3.2%, compared to a year ago when the RPPD was $446. This trend is evident in both urban and rural areas as the RPPD decreased on a quarterly basis and yearly basis in both geographies. It ended the first quarter 2019 at $436 in urban areas and $408 in rural areas. The RPPD decrease in the rural areas likely has less of an impact on the business as the managed Medicare penetration is smaller than in urban areas. The managed Medicare patient day mix in rural areas is only 3.4% compared to the 8.6% in urban areas.
  5. Medicaid patient day mix decreased to 65.8% in the first quarter 2019 compared to the 66.4% in the fourth quarter 2018. The decrease in patient day mix is likely due to the increase in other payer sources, e.g. Medicare and managed Medicare, rather than a decrease in patient admissions, as occupancy increased overall in the first quarter 2019. The decrease in Medicaid patient day mix from the fourth quarter 2018 to the first quarter 2019 was driven by the urban areas as it decreased 80 basis points to 66.5%. Rural area Medicaid patient day mix increased 22 basis points to 61.9%.
To get more trends from the latest data you can download the NIC Skilled Nursing Data Report by clicking the button below. There is no charge for this report.

Download Your Copy

The report provides aggregate data at the national level from a sampling of skilled nursing operators with multiple properties in the United States. NIC continues to grow its database of participating operators in order to provide data at localized levels in the future. Operators who are interested in participating can complete a participation form at http://www.nic.org/skillednursing. NIC maintains strict confidentiality of all data it receives.


Dr. Janet L Yellen to open 2019 NIC Fall Conference

NIC is pleased to announce that Dr. Janet Yellen, the first-ever woman to be appointed chair of the Board of Governors of the Federal Reserve System, will address the opening general session of the 2019 NIC Fall Conference at 8:00 AM on Thursday, September 12.  

The seniors housing and care sector will likely feel the influence of numerous economic forces in coming years, ranging from interest rates and the shape of the yield curve to the varying impacts of the global economy on regional economies across the United States. Macro-economic trends will influence domestic policy, the regulatory environment, labor markets, the healthcare sector, and other factors that decision makers will be watching closely.  

Perhaps no individual is in a better position to inform and provoke insight on these economic drivers than Dr. Yellen, who served as the “active executive officer” of the U.S. Federal Reserve System from 2014 to 2018. Prior to her four-year term as chair, Dr. Yellen served as vice chair of the Federal Reserve’s Board of Governors and, from 2004 to 2010, as president and chief executive officer of the Federal Reserve Bank of San Francisco. 

The general session will feature a discussion with Dr. Yellen, moderated by Kathleen Hays, the Global Economics and Policy Editor for Bloomberg Television and Radio. Ms. Hays is one of the top economics reporters and anchors in the country, having covered the U.S. economy, the Federal Reserve, and global economy trends for nearly 30 years on television and radio, and in the print and electronic media. Attendees will be treated to an exchange focused on the economic topics relevant to the seniors housing and care sector – and will hear how the former Federal Reserve Board chair views the economic environment.   

While serving as a member of the Federal Reserve’s Board of Governors (1994–1997), Dr. Yellen was appointed by President Bill Clinton as chair of the Council of Economic Advisers. From 1997 to 1999, she also chaired the Economic Policy Committee of the Organization for Economic Cooperation and Development. Earlier in her career, she served as an economist with the Federal Reserve’s Board of Governors. 

Although most famous as an economic policy-maker, Dr. Yellen has also enjoyed an accomplished career in academia. She was an assistant professor at Harvard University (1971–1976) and a lecturer at the London School of Economics and Political Science (1978–1980). In 1980, she joined the faculty of the University of California at Berkeley, where she was named the Eugene E. and Catherine M. Trefethen Professor of Business and Professor of Economics. Currently, she is a professor emeritus at the Haas School of Business. 

NIC looks forward to welcoming Dr. Yellen as our opening keynote speaker, and to continue a tradition of bringing the most eminent, experienced, and accomplished persons in business, economics, and policy-making to share their considerable insights with attendees of our Fall Conference.  

General Registration for the 2019 NIC Fall Conference is now open.  

Fewer Jobs Created in May: 75,000

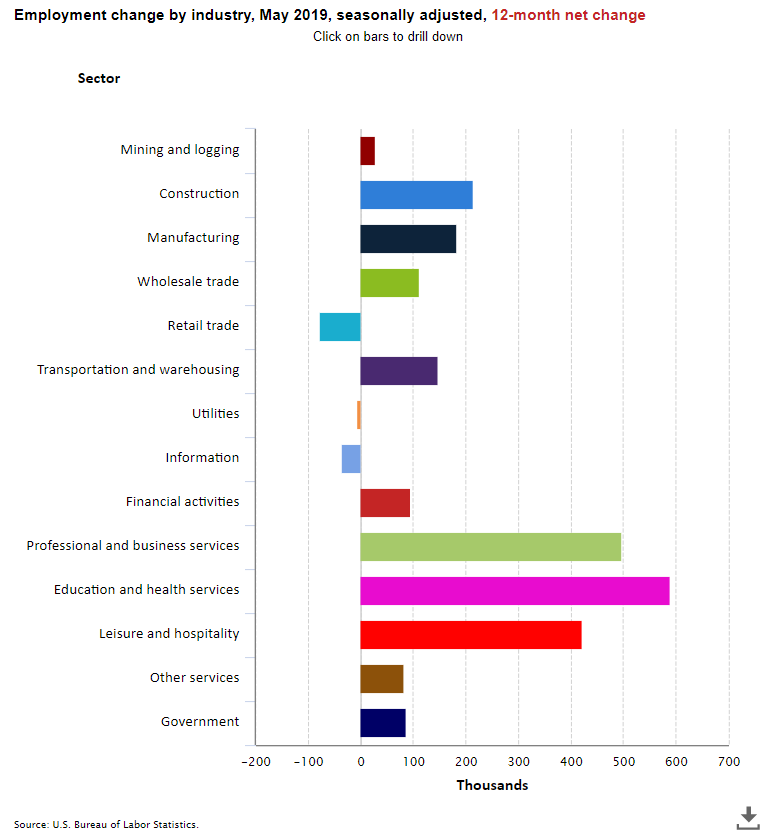
The Labor Department reported that there were 75,000 jobs added in May, well below the downwardly revised gain of 244,000 in April and below the consensus expectation of 180,000. The deceleration in growth may reflect the effects of slowing global growth and the waning effects of the tax cuts and government spending. Nevertheless, this marked the 104th consecutive month of job growth.  The latest three-month average is 151,000, less than last year’s 223,000 monthly average.

Revisions subtracted 75,000 to the prior two months.  Monthly revisions result from additional reports received from businesses and government agencies since the last published estimates and from the recalculation of seasonal factors.

In May, employment in health care rose by 16,000. In the past year, health care has added 391,000 jobs.

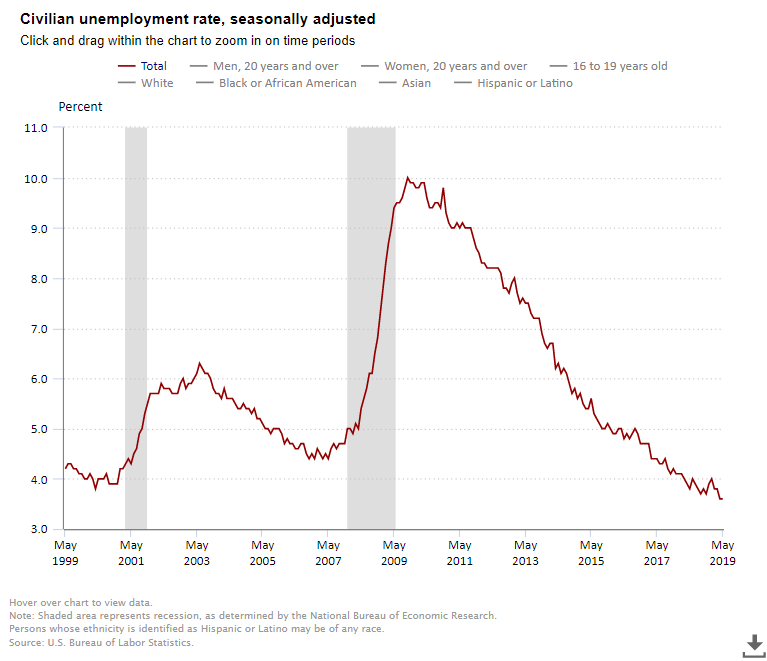
The unemployment rate was unchanged at to 3.6% in May.  This is the lowest rate in 50 years or since 1969.  A broader measure of unemployment, which includes those who are working part time but would prefer full-time jobs and those that they have given up searching—the U-6 unemployment rate—fell to 7.1% from 7.3%.

Average hourly earnings for all employees on private nonfarm payrolls rose in May by six cents to $27.83. Over the past 12 months, average hourly earnings have increased by 3.1%, down from 3.2% last month.   For 2018, the year over year pace was 3.0% and in 2017 it was 2.6%.

The labor force participation rate, which is a measure of the share of working age people who are employed or looking for work was unchanged at 62.8% in May, very low but up from its cyclical low of 62.3% in 2015.  The low rate at least partially reflecting the effects of an aging population.

This report, in combination with other recent data on economic activity, will support speculation that the Fed’s next move may be to lower interest rates.  In recent weeks, the Fed’s has indicated that it is paying close attention to the risks of an economic slowdown.

Investor Summit Jump Starts Conversation for More Middle-Market Seniors Housing: A Three-Part Series

Part I—Equity Investors Weigh in on How to Make the Numbers Work

Facing a shortage of seniors housing and care options for the growing numbers of middle-income seniors based on new research, NIC convened an investor summit May 21 in New York City. The summit brought together industry stakeholders to brainstorm ideas to create innovative housing models that cut costs and streamline operations to improve affordability for middle class elders. Promising approaches included public-private partnerships, shared suites, new technology, and efficient designs and staffing models.

The investor summit included three separate panels of experts. They explored various solutions from the perspective of equity investors, debt providers, and property operators with successful strategies already in use.

The results of a new study, “The Forgotten Middle,” were also presented at the summit. The study was recently published in the journal Health Affairs and discussed at an April 24 policy forum in Washington, D.C.

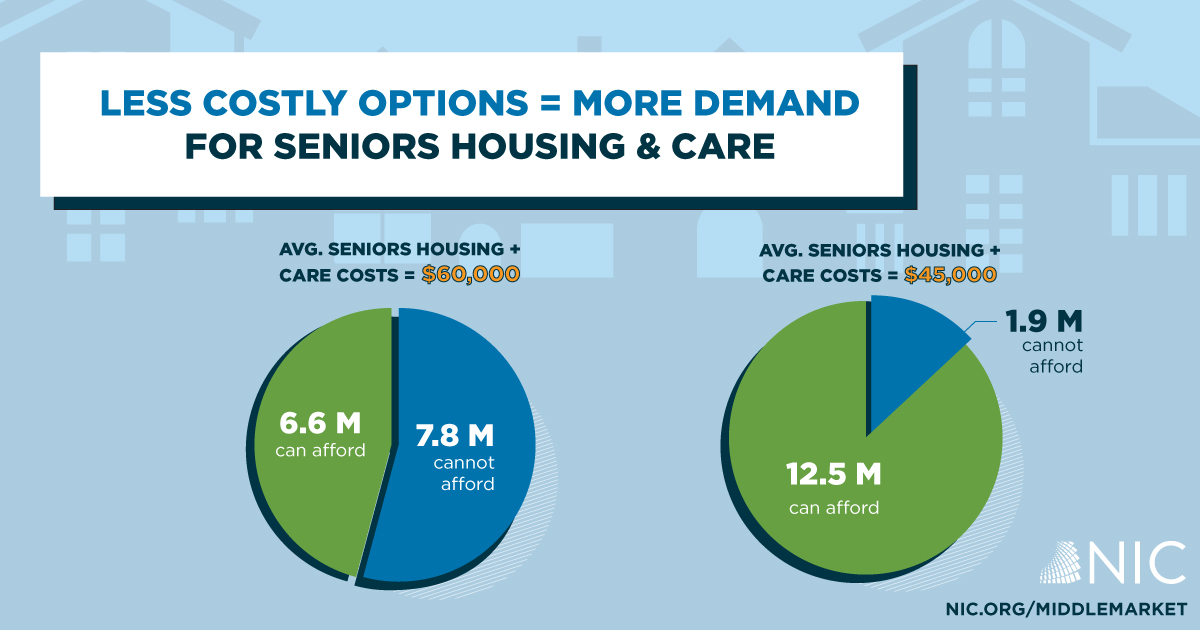
The study shows that fewer than half (46%) of America’s middle-income seniors will be able to afford the $60,000 average annual costs of seniors housing and out-of-pocket medical costs in 2029, even if they use all of their financial resources, including their home equity. But if the costs were cut, millions of older adults could benefit.

The independent research conducted by NORC at the University of Chicago also shows that an additional 5.9 million older adults would be able to afford seniors housing if annual costs were cut by $15,000. Data show that if average annual costs for seniors housing and care fell by just $10,000 a year, an additional 2.3 million older Americans would be able to afford it.

“In only a decade, the number of middle-income seniors will double, and most will not have the savings needed to meet their housing and personal care needs,” said Caroline Pearson, senior vice president at NORC at the University of Chicago and one of the study’s lead authors. “Policymakers and the seniors housing community have a tremendous opportunity to develop solutions that benefit millions of middle-income people for years to come.”

Funding for the study was provided by the National Investment Center for Seniors Housing & Care (NIC), with additional support from AARP, the AARP Foundation, the John A. Hartford Foundation, and The SCAN Foundation.

What follows is an edited Q&A of the first panel discussion which focused on equity investors. (Here is a link to the other panel discussions.)  The equity panel was moderated by NIC Chief Economist and Director of Outreach Beth Mace.

Participants of the equity panel included Pam Herbst, managing director, AEW Capital Management; and Andrew Brett, principal, director of Real Assets Research, NEPC.

Mace: To put our discussion in context, what changes have you seen in the acceptance of seniors housing by institutional investors over the last 10 years?

Brett:  We’ve been calling seniors housing an emerging asset class for a number of years, but now it’s becoming more of a core investment like the four main commercial real estate asset classes. Not all investors are there yet, but it’s an active conversation. We currently tend to look at seniors housing as a value-add or opportunistic investment.

Herbst: The first time years ago when we went to a client about investing in a stabilized portfolio of seniors housing at a 10.5% cap rate, they were scared to death. But we were able to convince them to invest and we walked out of the room with $100 million in equity for a portfolio and it did amazingly well.  We could show clients that the operating risk was not as much as they thought. A lot of them thought assisted living and memory care was like the nursing home where they visited their grandparents.

Over time, the risk perspective has been reduced for clients. They saw during the financial crisis that assisted living did well because it is need driven. We did learn that independent living had a different risk profile because it was a choice and people could not sell their houses. But that risk has come down and now we can meet cash flow and return requirements, so investors are getting more comfortable with that segment.

A number of institutional clients today view seniors housing as a core-plus or value-added strategy. Fifteen years ago, they looked at it as an opportunistic play. But if clients understand the huge opportunity with growing demand for seniors housing, stabilized properties fit comfortably in the core to core-plus strategy space.

For a middle-market product, we have to work on the cost per unit and required investor margins.  As a company, we’re looking at developing affordable units in Texas for $140,000 per unit. Discounting land costs by $25,000, the cost is still $115,000 a unit—much higher than the cost it would take to meet today’s return requirements.  It’s not just the investment returns that are an issue, but the cost to develop the project.

Mace:  Could you get comfortable with middle-market investing?

Brett:  Institutional investors do believe in the resiliency of the asset class. But we have to have a compelling scenario to meet their actuarial rate of return of 7+ %.

Mace:  Is there a fully private market solution or do we need a public/private partnership?

Herbst:  I think we need some kind of subsidy. We’ve looked at shared units with two bedrooms, shared common space and a bathroom. The costs are 20-25% less than for full market private pay units. Greater demand because of a larger population should produce a quicker lease-up which will impact cash flows. Another thought is to look at shared rooms, like college dorms. It could be a suite with 4 bedrooms, and a bathroom with two sinks, and a shower, and 2 toilets. That arrangement would lower the construction and operating costs.

It’s possible now to speed entitlements with a local municipality when 15-20% of units are earmarked for those with 80-120% of the area’s median income. If a developer would agree to target 20% of units for middle market seniors, and the municipality boosts the project’s FAR (floor area ratio) by 25%, you’re essentially eliminating the additional land cost. Also, seniors don’t impact local schools or use many city services which is an argument to reduce property taxes.

Brett:  I had a similar thought about shared spaces, but how would that impact residents?

Herbst:  We have shared units in four projects and the roommate situation is going great. People have connected with old friends and we’ve had very few problems. It’s important that the bedrooms have room for a chair and TV.  At some point, not everyone can afford a ritzy place. As a country, we have to get realistic about what services we can provide to these seniors based on their budgets.

Mace:  Maybe the seniors housing industry will have to become more like the hotel industry with a spectrum of products.  But 60% of the expenses are labor which is a big challenge. Do we need a different type of capital stack for a middle income product?

Herbst: The capital piece could become a less institutional product. Maybe it would be geared more for retail investors. There are a huge number of people turning 65 looking for fixed income in a world where yields are low. If middle- market seniors housing can lease quickly and stay leased, and generate a return even of below 5%, that’s not bad. Perhaps the product would be almost like a tax free municipal bond backed by the states.

Mace: If a pension fund is not going to earn double digit returns, does it matter to them that they are providing a service to constituents and having a social impact?

Brett:  It still comes back to the rate of return. The goal is to invest on the merits of the return and also achieve a social impact. The return potential has to be there.  A capital vehicle with a tax benefit is an interesting strategy, but I think it would be tough to package as a fixed income instrument from an institutional perspective.

Mace: What are some innovative ideas to create more seniors housing for the middle market?  Could a mall, for instance, be converted into a seniors housing project?

Herbst: I think that would be interesting. We’ve looked at Class B & C office buildings in the suburbs that we could buy for $80 a foot and then renovate for seniors housing. We see more and more medical uses for empty mall space. With its enclosed areas, good for walking, a mall could be right for a rehab or assisted living facility. We need to think outside the box.

Audience Q:  Where can we squeeze out extra cost when labor is 60% of the operating expenses?

Herbst:  There are ways to make the operating model more efficient. Property taxes and food are a big part of operating costs. It might be possible to partner with programs such as Meals on Wheels which might also bring down dining room labor costs.

Mace:  What about bringing in more volunteer labor? Church groups could volunteer or, say, volunteers could bank the time and then use it for themselves when they move into the building. More and more retired people want to be engaged with their communities and it might be a way to change the narrative while lowering labor expenses.

Herbst:  Reducing the operating cost is the hardest part. We have to focus on reducing real estate taxes, bringing down development costs, and finding thoughtful ways to deliver services.


###


May 27, 2019

janekadler@gmail.com

An Update on Actual Rates

The NIC MAP® Data Service recently released national monthly data through March 2019 for actual rates and leasing velocity. The NIC Actual Rates initiative is driven by the need to continually increase transparency in the seniors housing sector and achieve greater parity to data that is available in other real estate asset classes. Having access to accurate data on the monthly rates a seniors housing resident pays as compared to asking rates helps us achieve this goal.

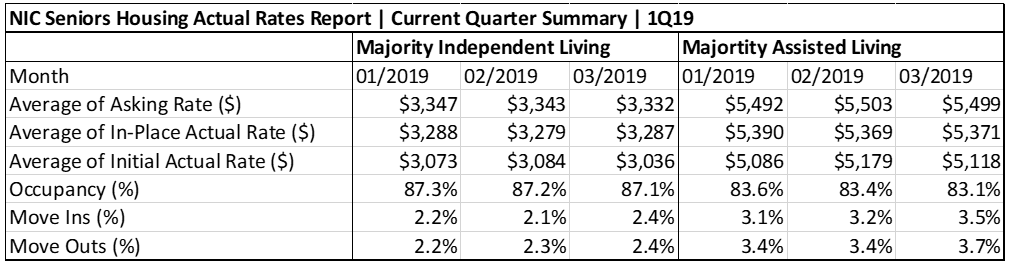
Key takeaways from the 1Q2019 Seniors Housing Actual Rates Report include:

  • Average initial rates for residents moving in were below average asking rates for both majority independent living and majority assisted living properties, with monthly spreads generally larger for majority assisted living properties dating back to April 2015.
  • As of March 2019, initial rates for majority assisted living properties averaged 6.9% below their average asking rate, which equates to an average initial rate discount of 0.8 months on an annualized basis, down from 1.0 months in December 2018. The average discount for majority independent living properties was larger at the equivalent of 1.0 month which was as high as it has been since early 2018. This was notable because the discount has been smaller for independent living than assisted living for nearly the entire time series that began in April 2015.
  • Average asking rates for majority independent living properties have exceeded in-place rates for the past eleven months, a change from the prior 14 months (I.e. March 2017 to April 2018) when asking rates were less than in-place rates. For majority assisted living properties, average asking rates consistently exceed average in-place rates. The average majority independent living asking rate increase in March 2019 was 4.0% above its year-earlier level, a slowdown from 5.8% at year-end 2018. The annual pace of growth for majority independent living initial rates also decelerated and was only up 2.8% from year-earlier levels; this followed four months of 5.0% or better growth.
  • For majority assisted living properties, annual growth was strongest for initial rates as of March 2019, at 4.8%. This compares with 2.7% for in-place rates and 2.3% for asking rates.
  • The rate of move-ins has exceeded or equaled the rate of move-outs for six of the past twelve months for majority independent living. For assisted living, move-ins exceeded or equaled moveouts for seven of the past twelve months, while they were below move-outs for five months. Move-ins tend to exceed move-outs during the Spring and Summer months.

This Seniors Housing Actual Rates Report provides aggregate national data from approximately 300,000 units within more than 2,500 properties across the U.S. operated by 25 to 30 seniors housing providers. Note that this monthly time series is comprised of end-of-month data for each respective month. The operators included in the current sample tend to be larger, professionally managed, and investment-grade operators as we currently require participating operators to manage 5 or more properties.

While these trends are certainly interesting aggregated across the states, actual rate data will be even more useful when it is available at the CBSA level. As NIC continues to work towards growing the sample size to be large enough to release data at the CBSA level, partnering with leading software providers like MatrixCare, Yardi, PointClickCare and Eldermark makes it easier for operators to contribute data to the Actual Rates initiative. NIC appreciates our partnerships with software providers and our data contributors and their work in achieving standardized data reporting. Operators contributing data not only receive the national report free of charge but they are also helping to increase transparency for the benefit of the sector.

If you are an operator or a software provider interested in how you can contribute to the Actual Rates initiative, please contact Brian Connolly at bconnolly@nic.org.